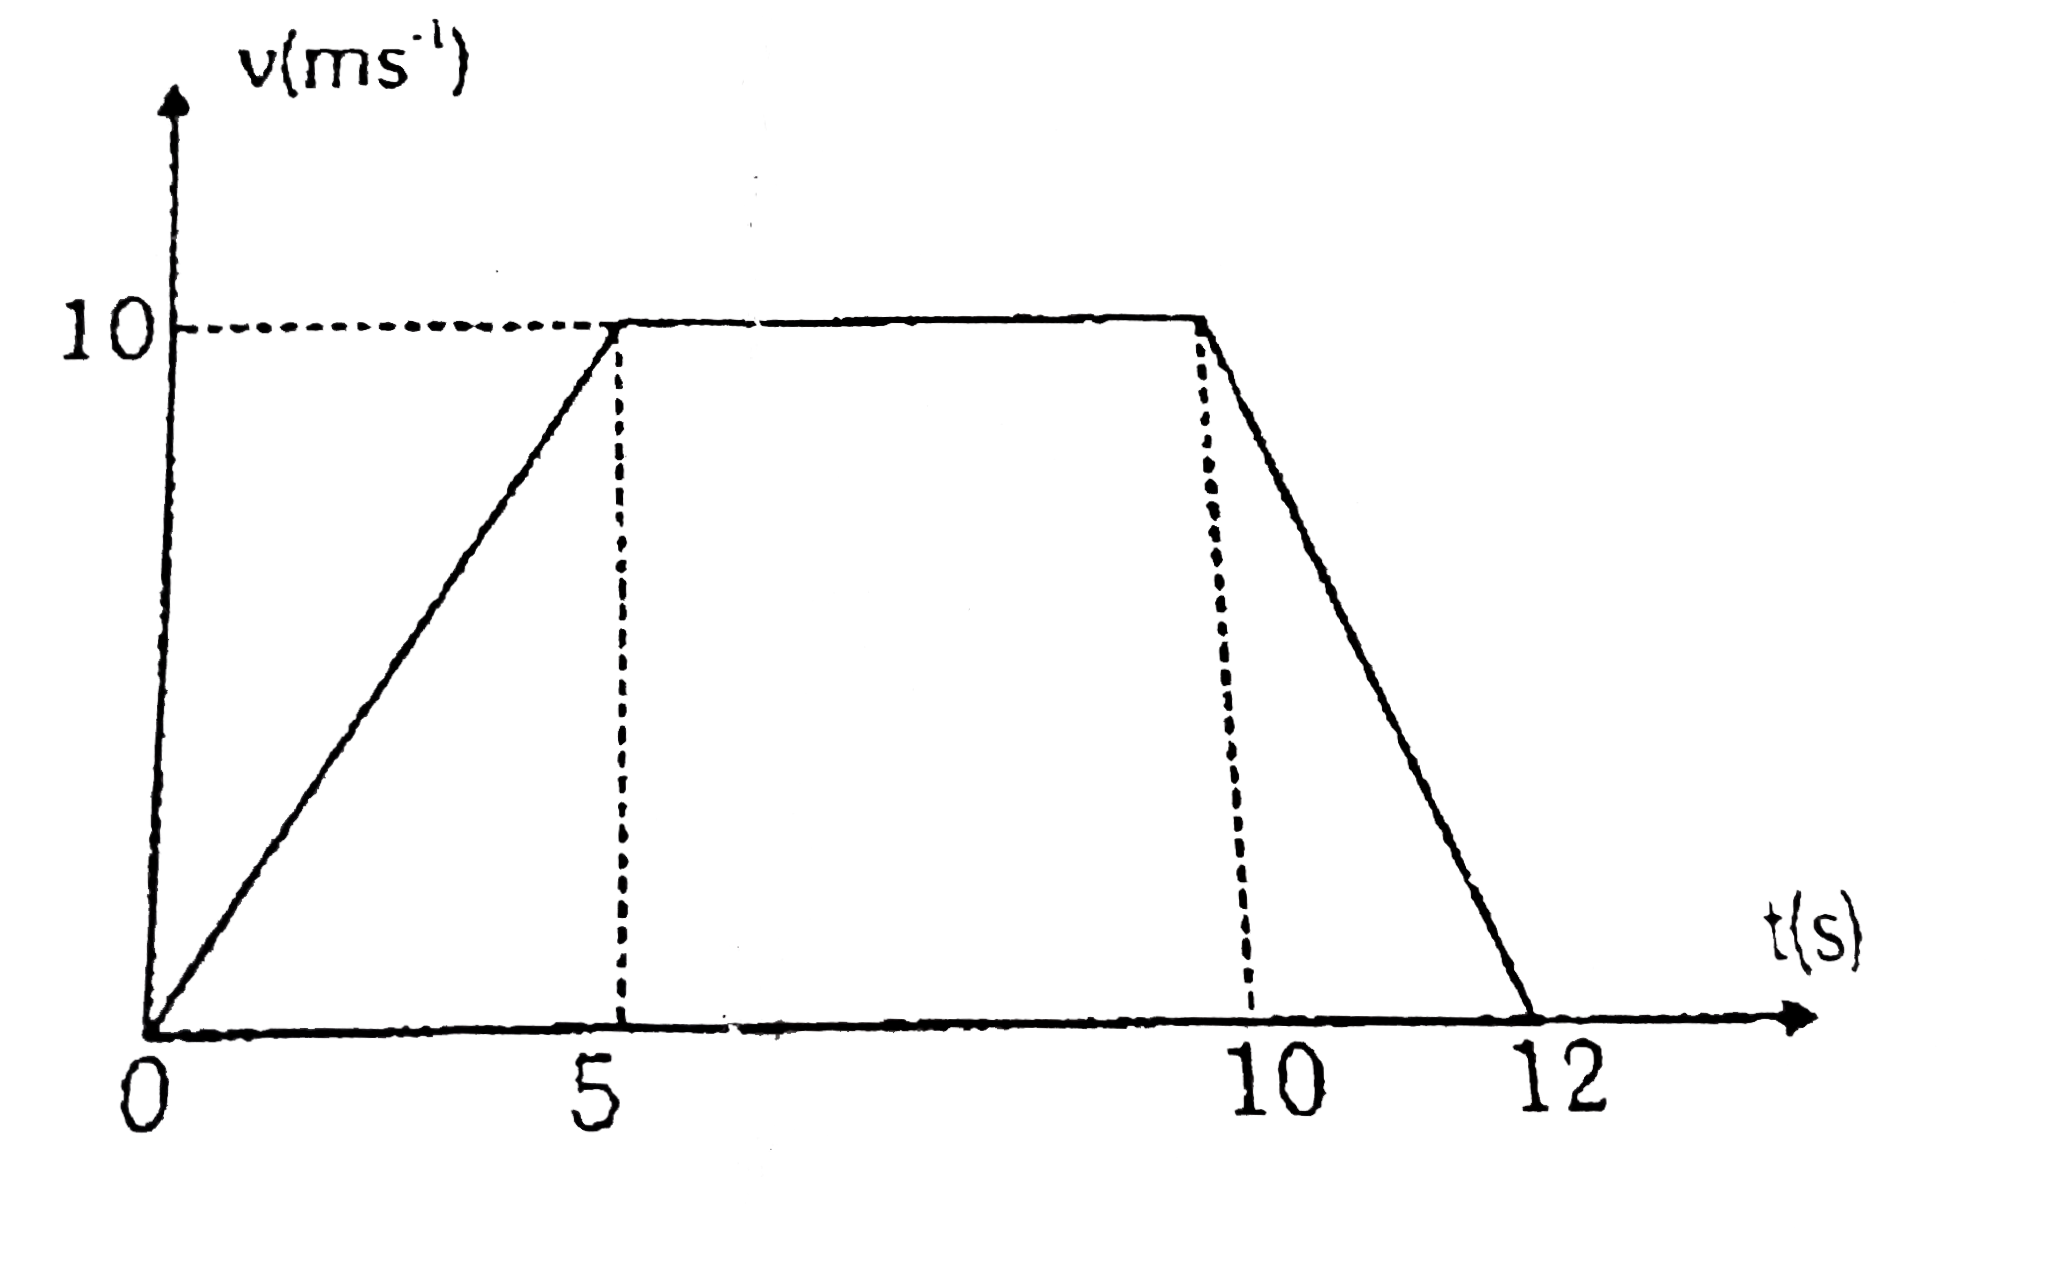
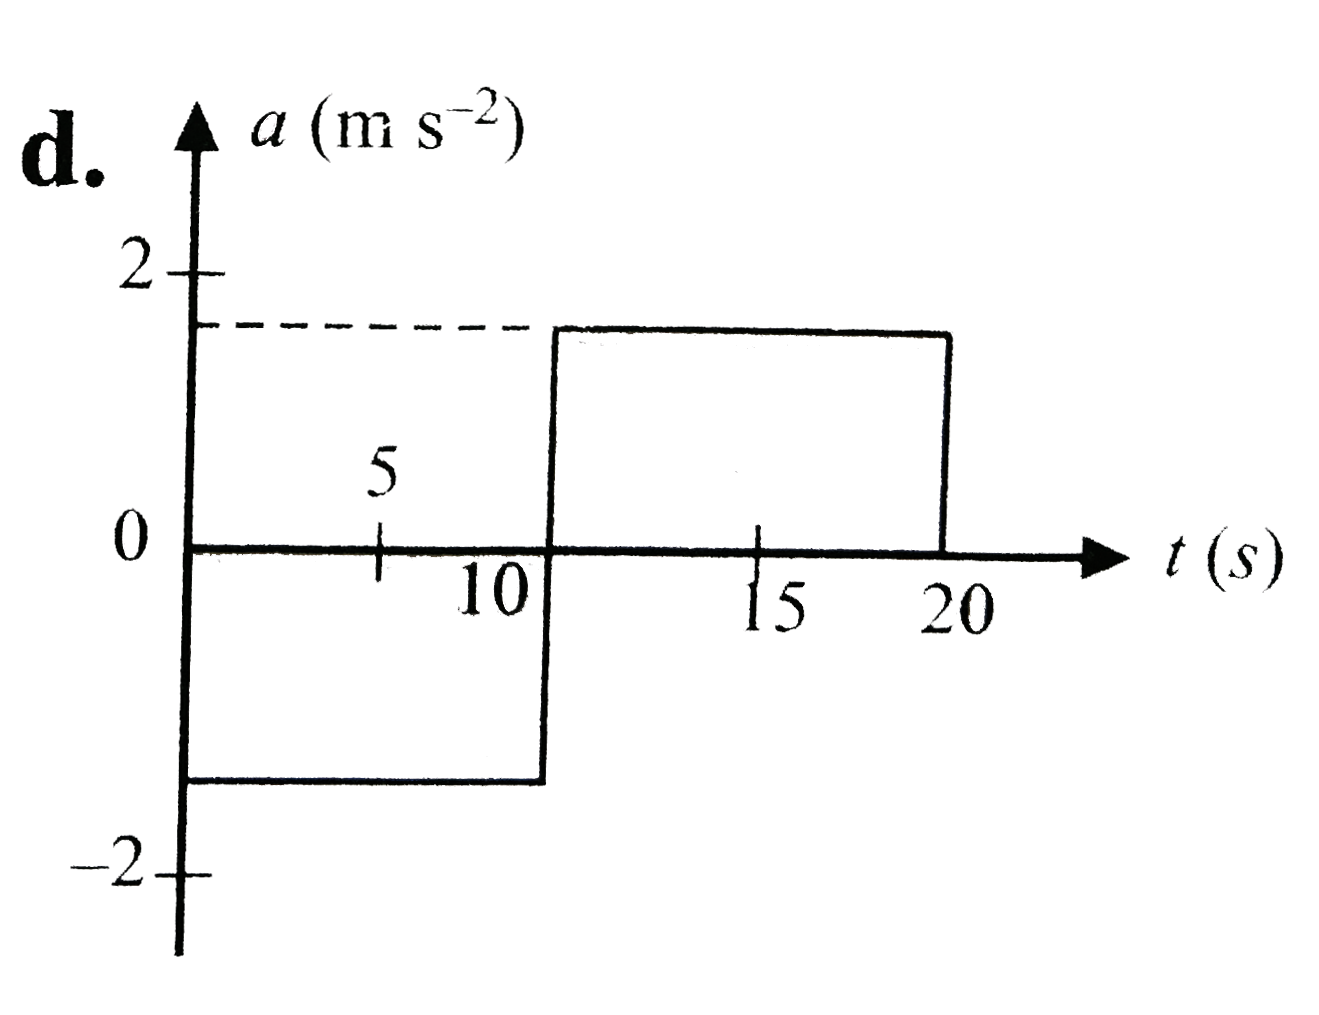
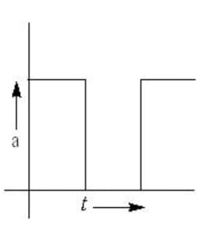
Plot the acceleration-time graph of the welocity-time graph given in.
 .
.
 .
.
 .
.
 .
.
 .
.
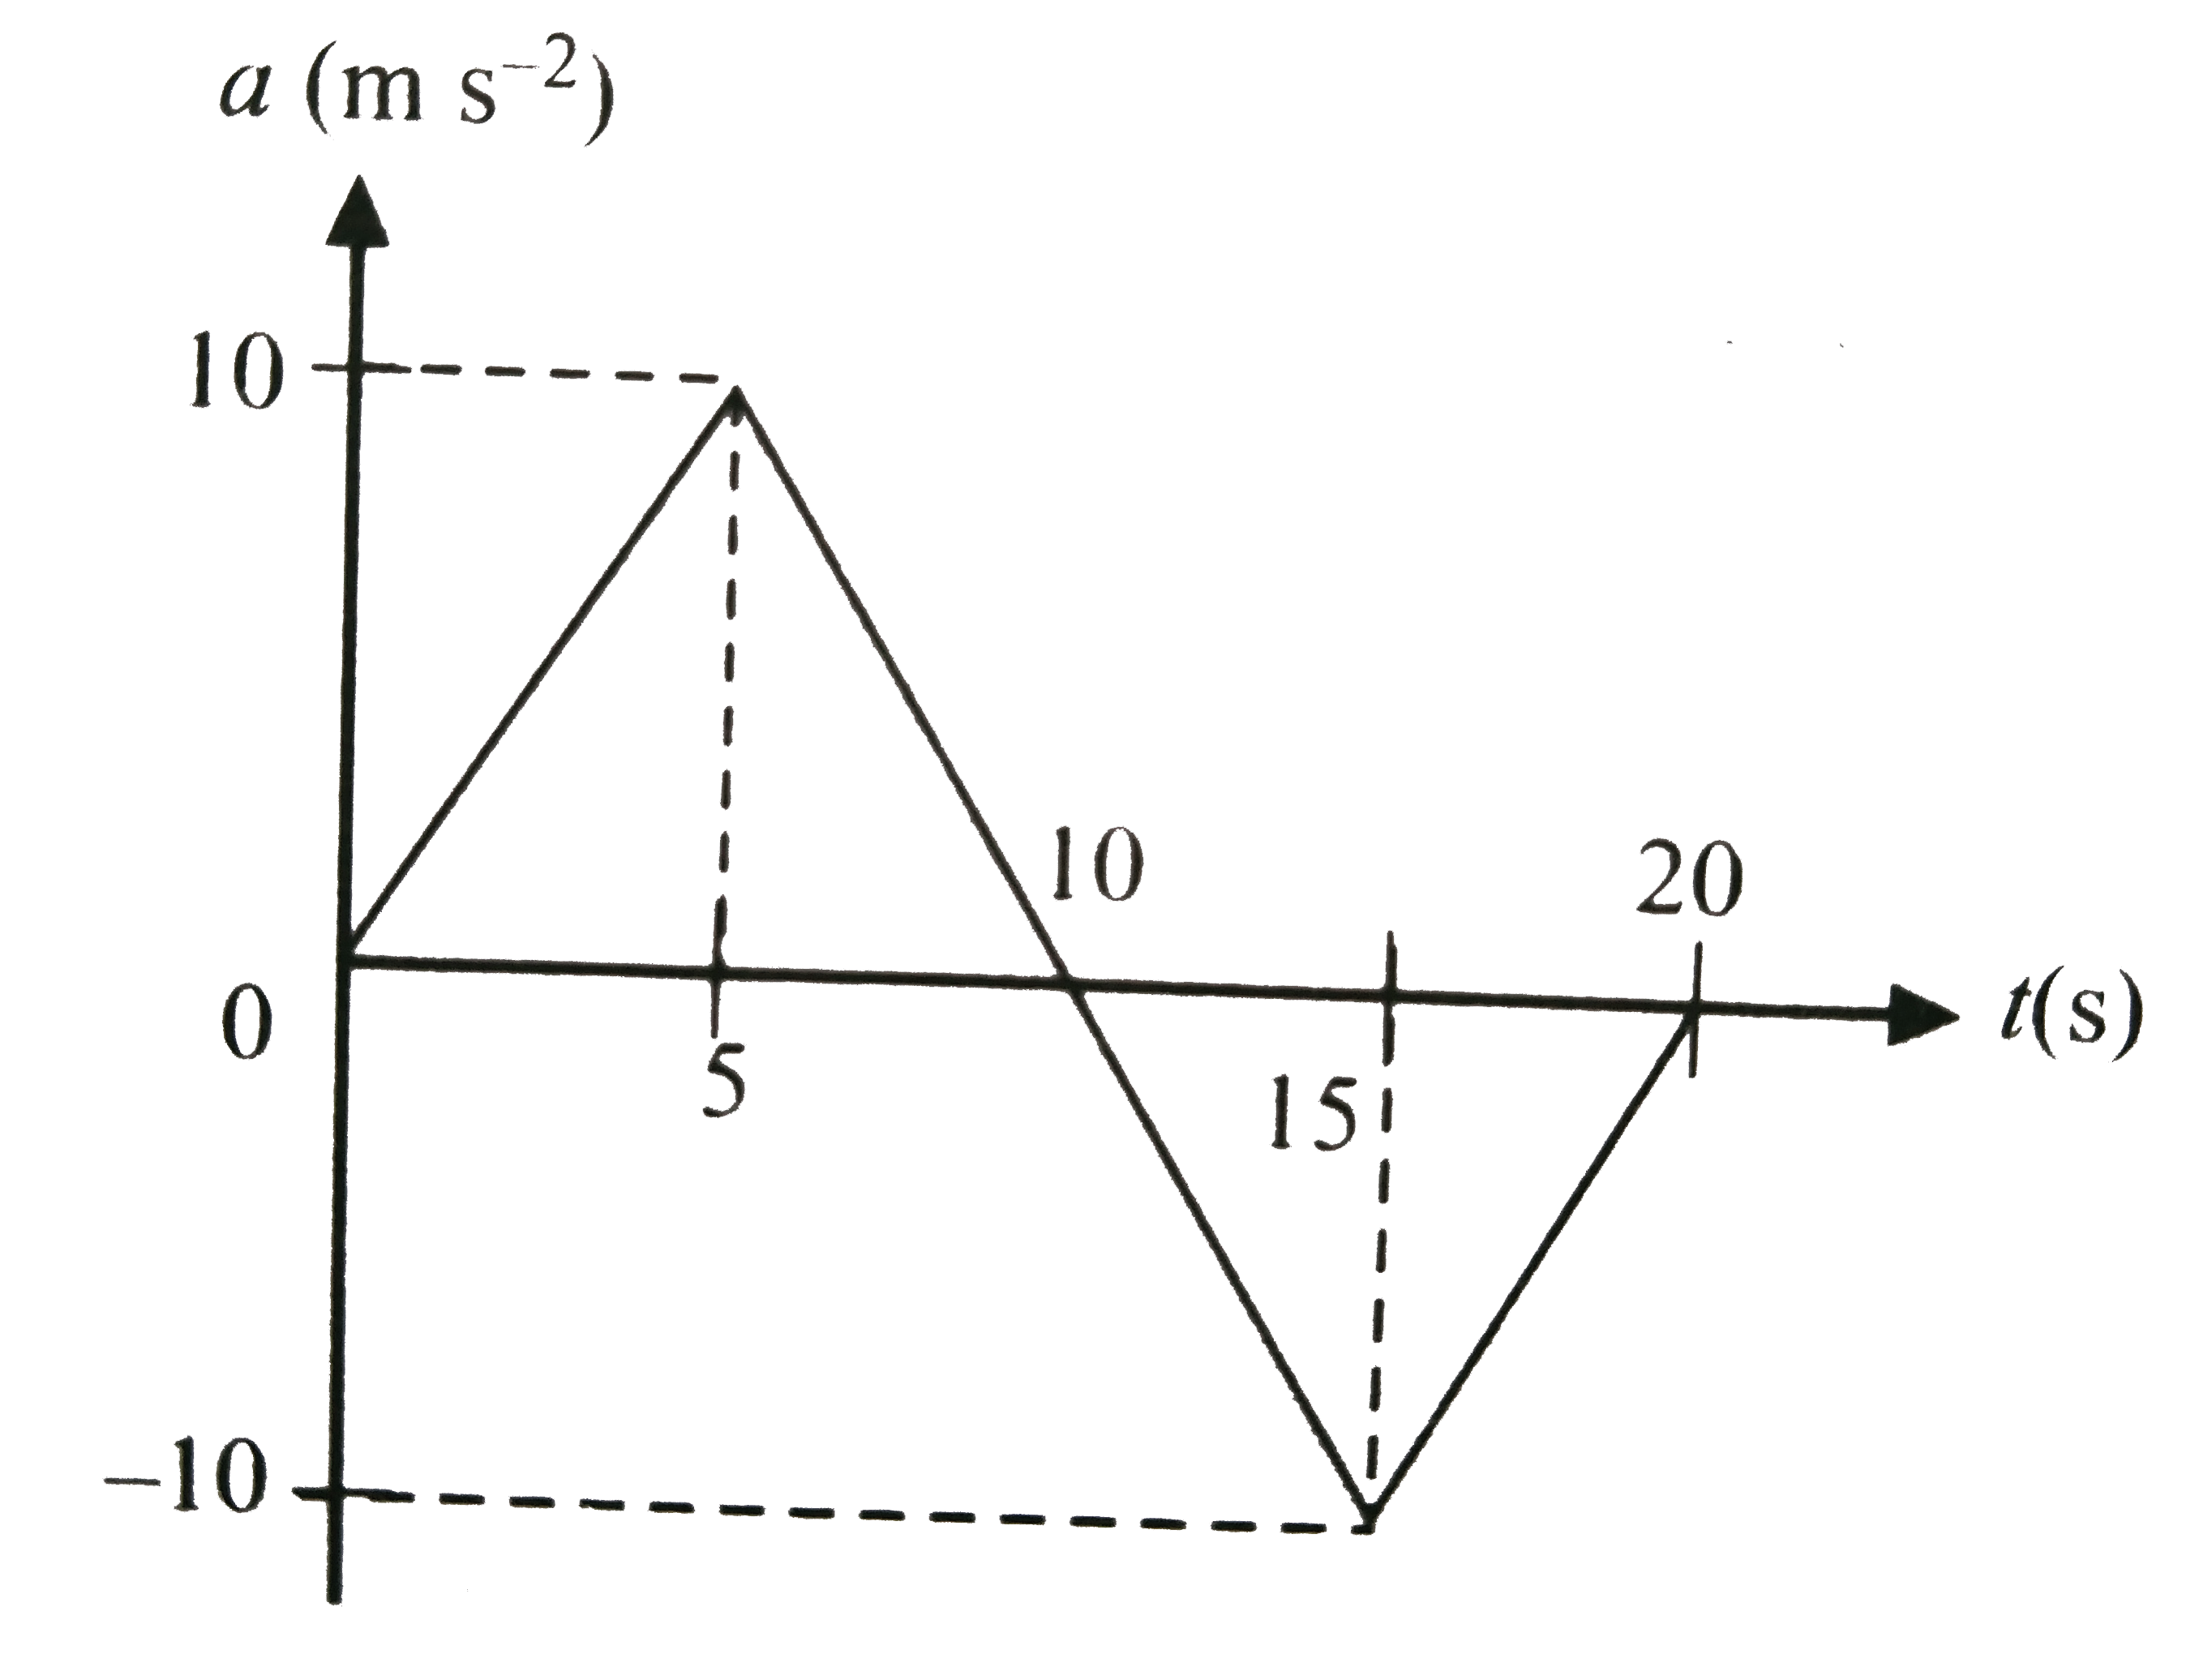
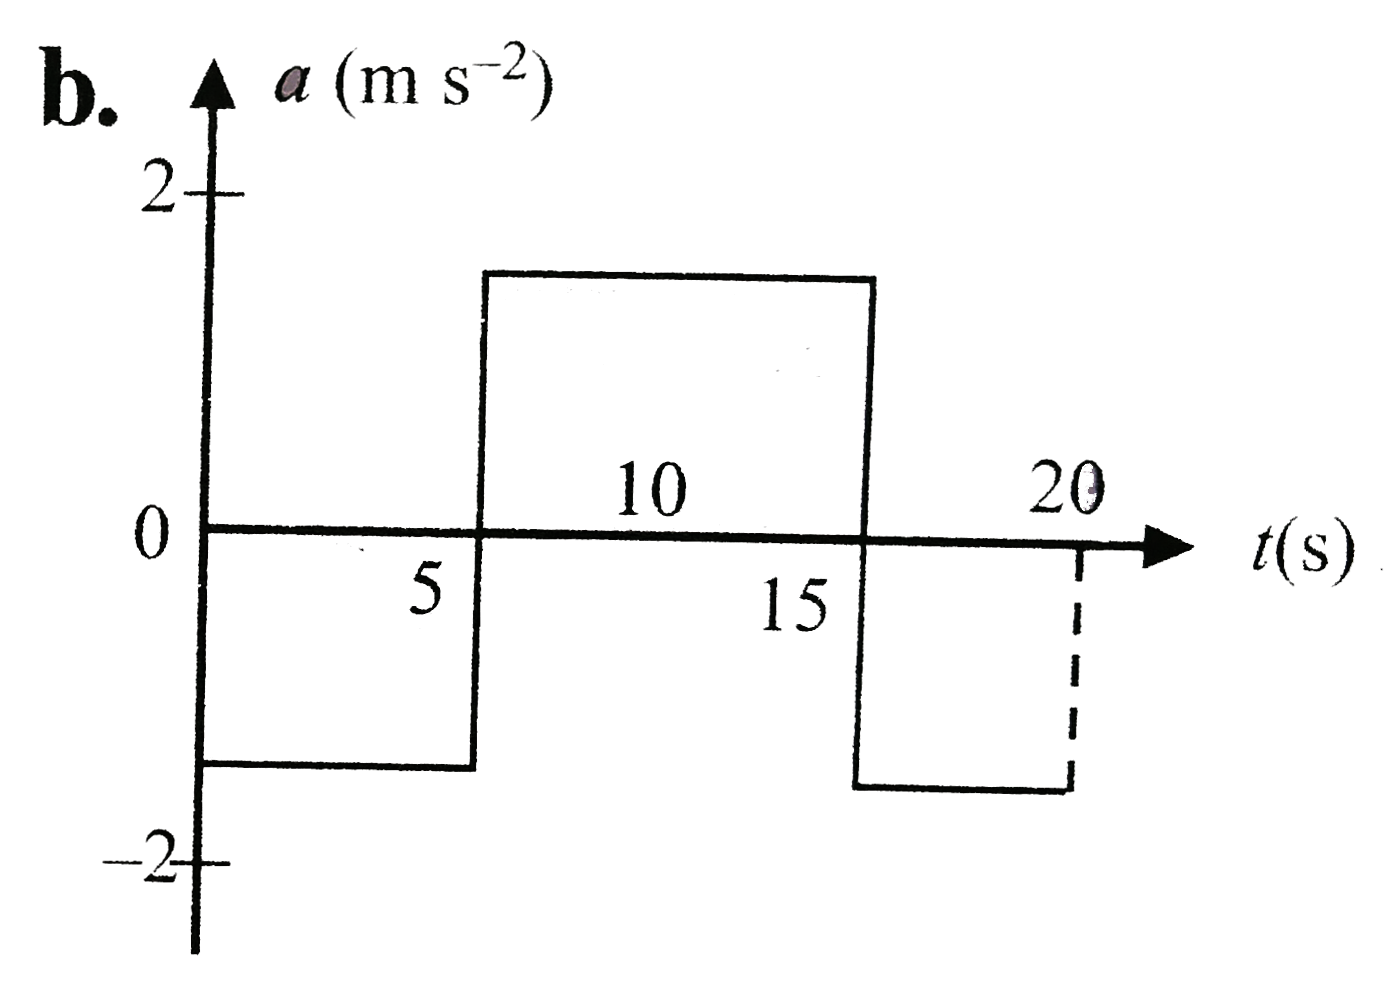
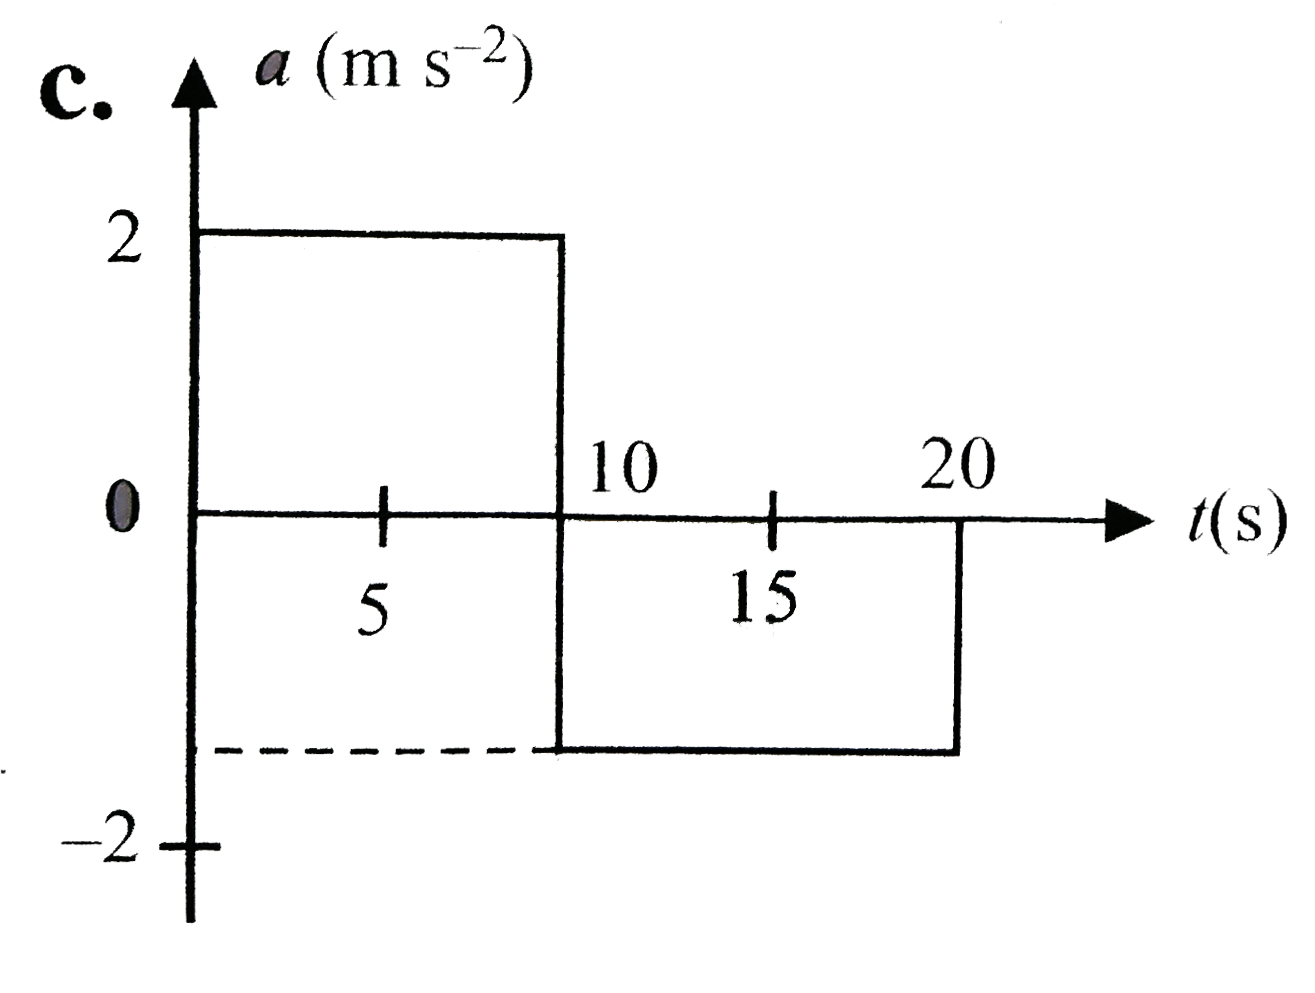
The correct Answer is:A
For 0 to 5s, acceleration is positive, for 5 to 15s acceleration is negative, for 15 to 20s acceleration is positive.
Topper's Solved these Questions
- KINEMATICS-1Book:CENGAGE PHYSICSChapter:KINEMATICS-1Exercise:Graphical cancept
Explore 1 Video
- KINEMATICS-1Book:CENGAGE PHYSICSChapter:KINEMATICS-1Exercise:Multiple Correct
Explore 16 Videos
- KINEMATICS-1Book:CENGAGE PHYSICSChapter:KINEMATICS-1Exercise:Single Correct
Explore 52 Videos
- GRAVITATIONBook:CENGAGE PHYSICSChapter:GRAVITATIONExercise:INTEGER_TYPE
Explore 1 Video
- KINEMATICS-2Book:CENGAGE PHYSICSChapter:KINEMATICS-2Exercise:Exercise Integer
Explore 9 Videos
Similar Questions
Knowledge Check
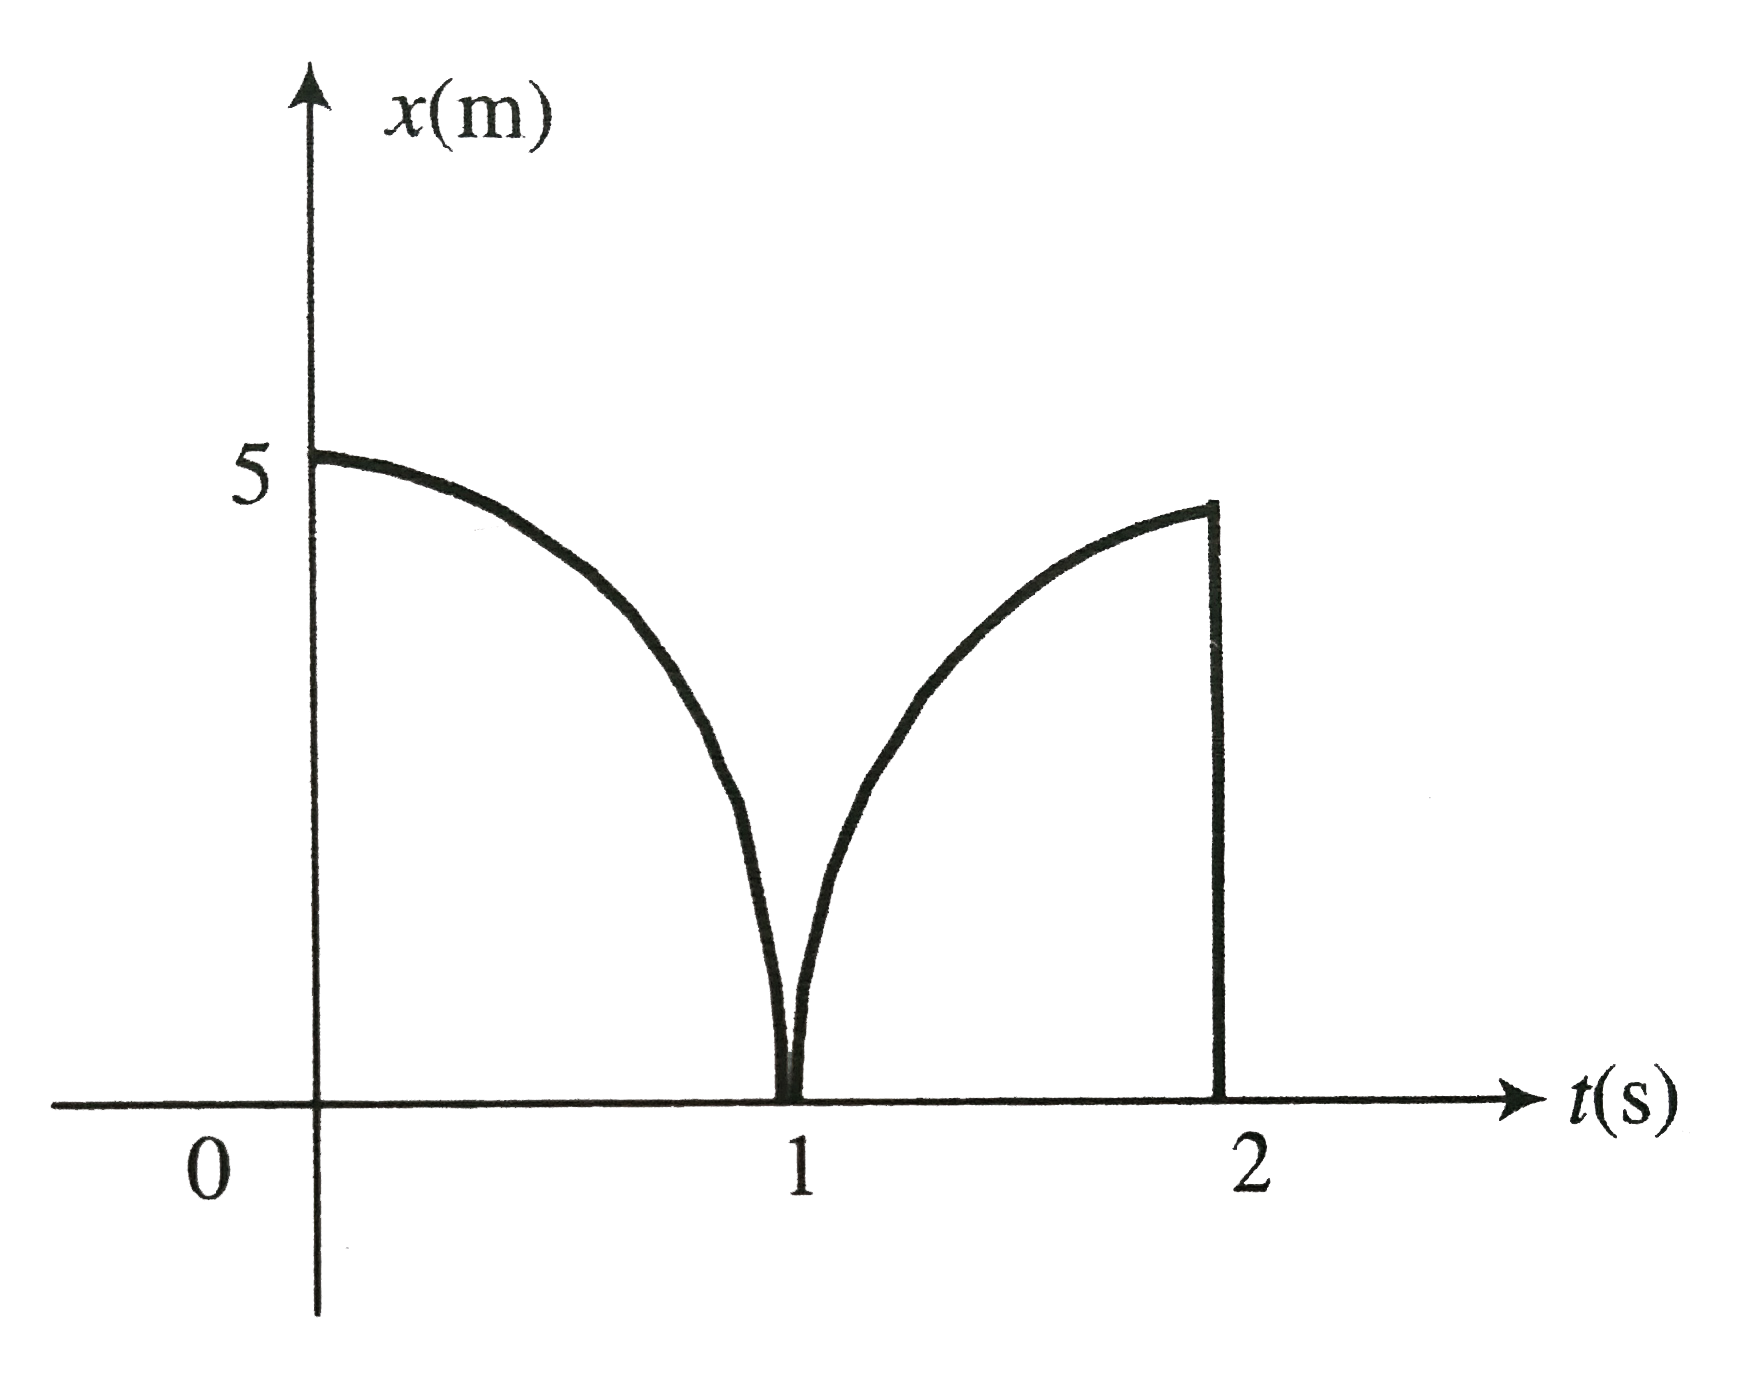
The displacement-time graph of a moving particle with constant acceleration is shown in. The velocity-time is given by
 .A
.A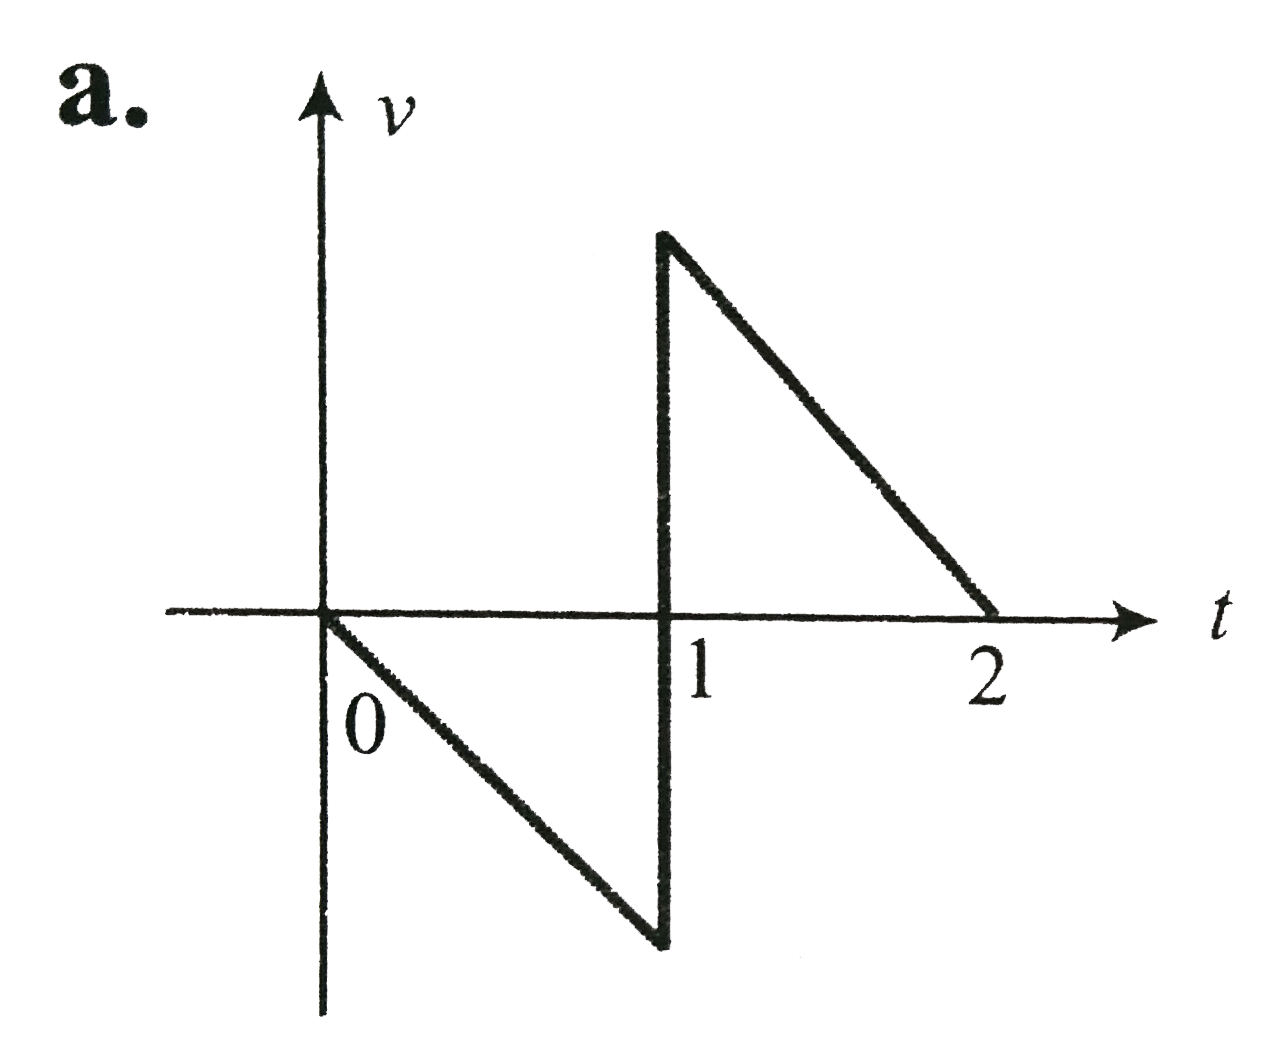 .B
.B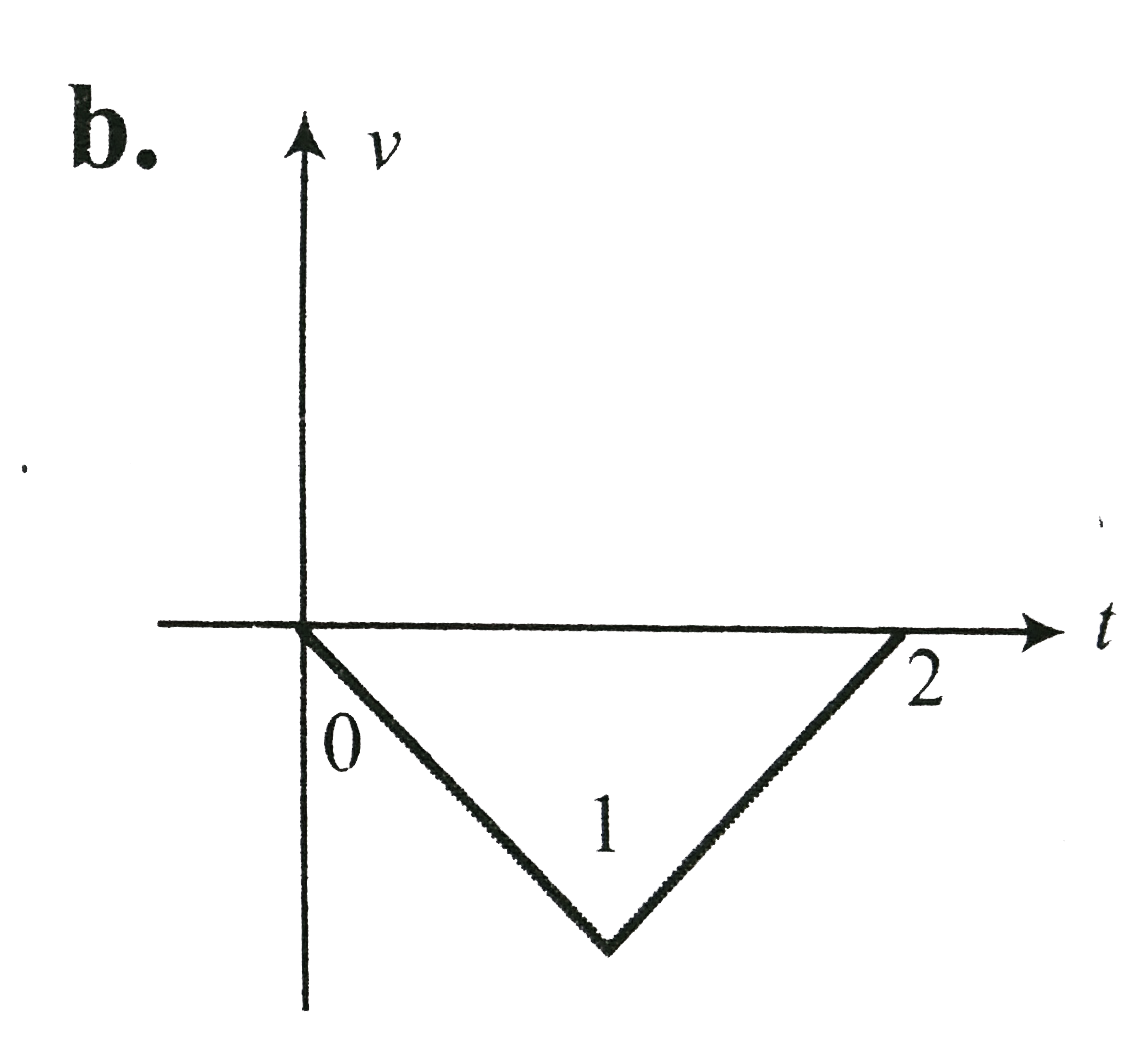 .C
.C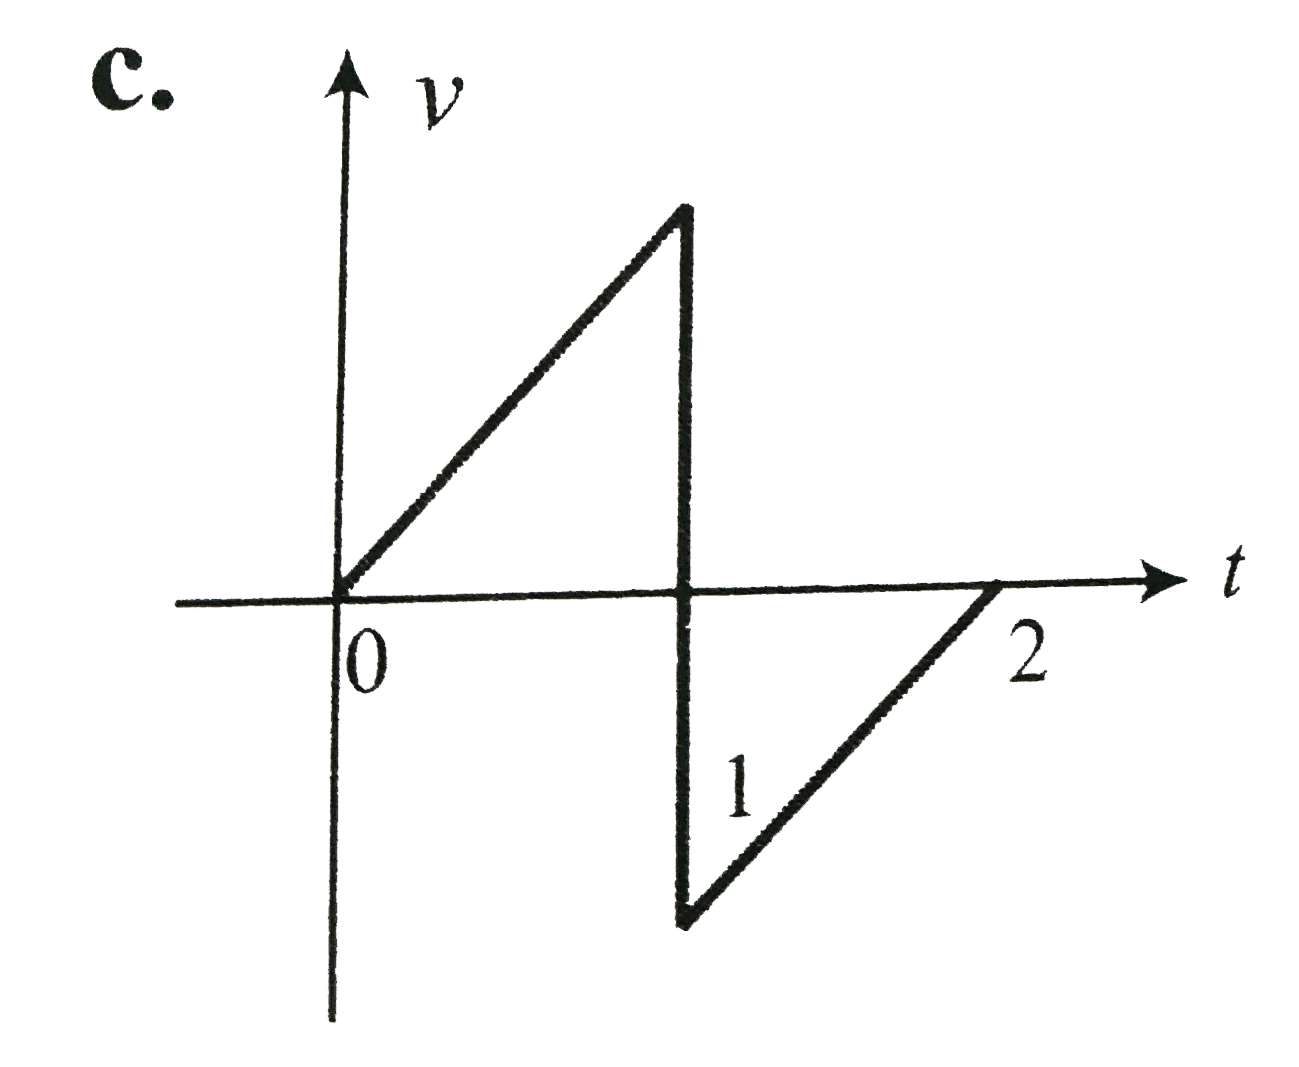 .D
.D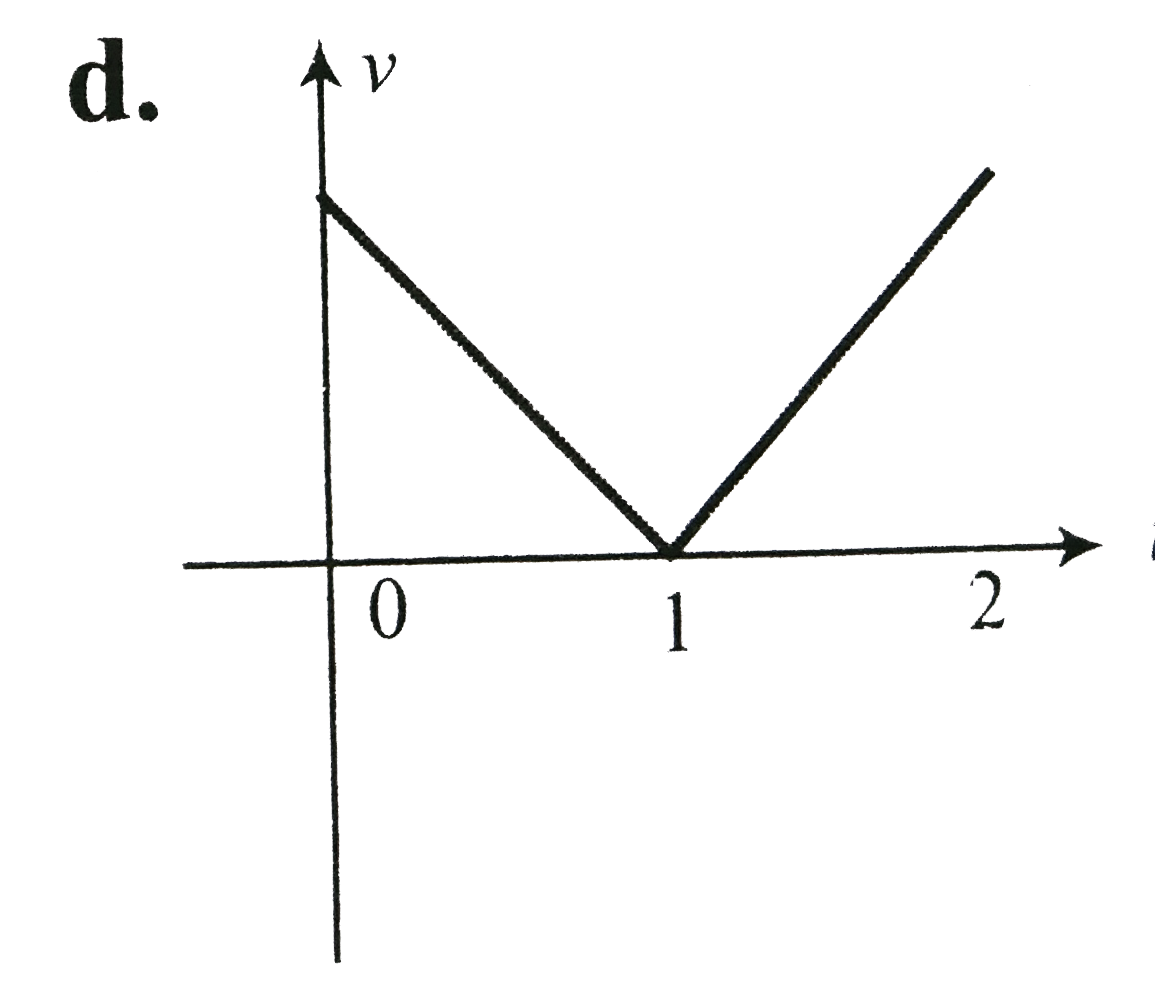 .
.For a given acceleration − time graph, there exist ………………………… velocity − time graph
A1B2C3DmanyThe area under acceleration-time graph gives
ADistance travelledBChange in accelerationCForce actingDChange in velocity
The velocity-time graph is given below
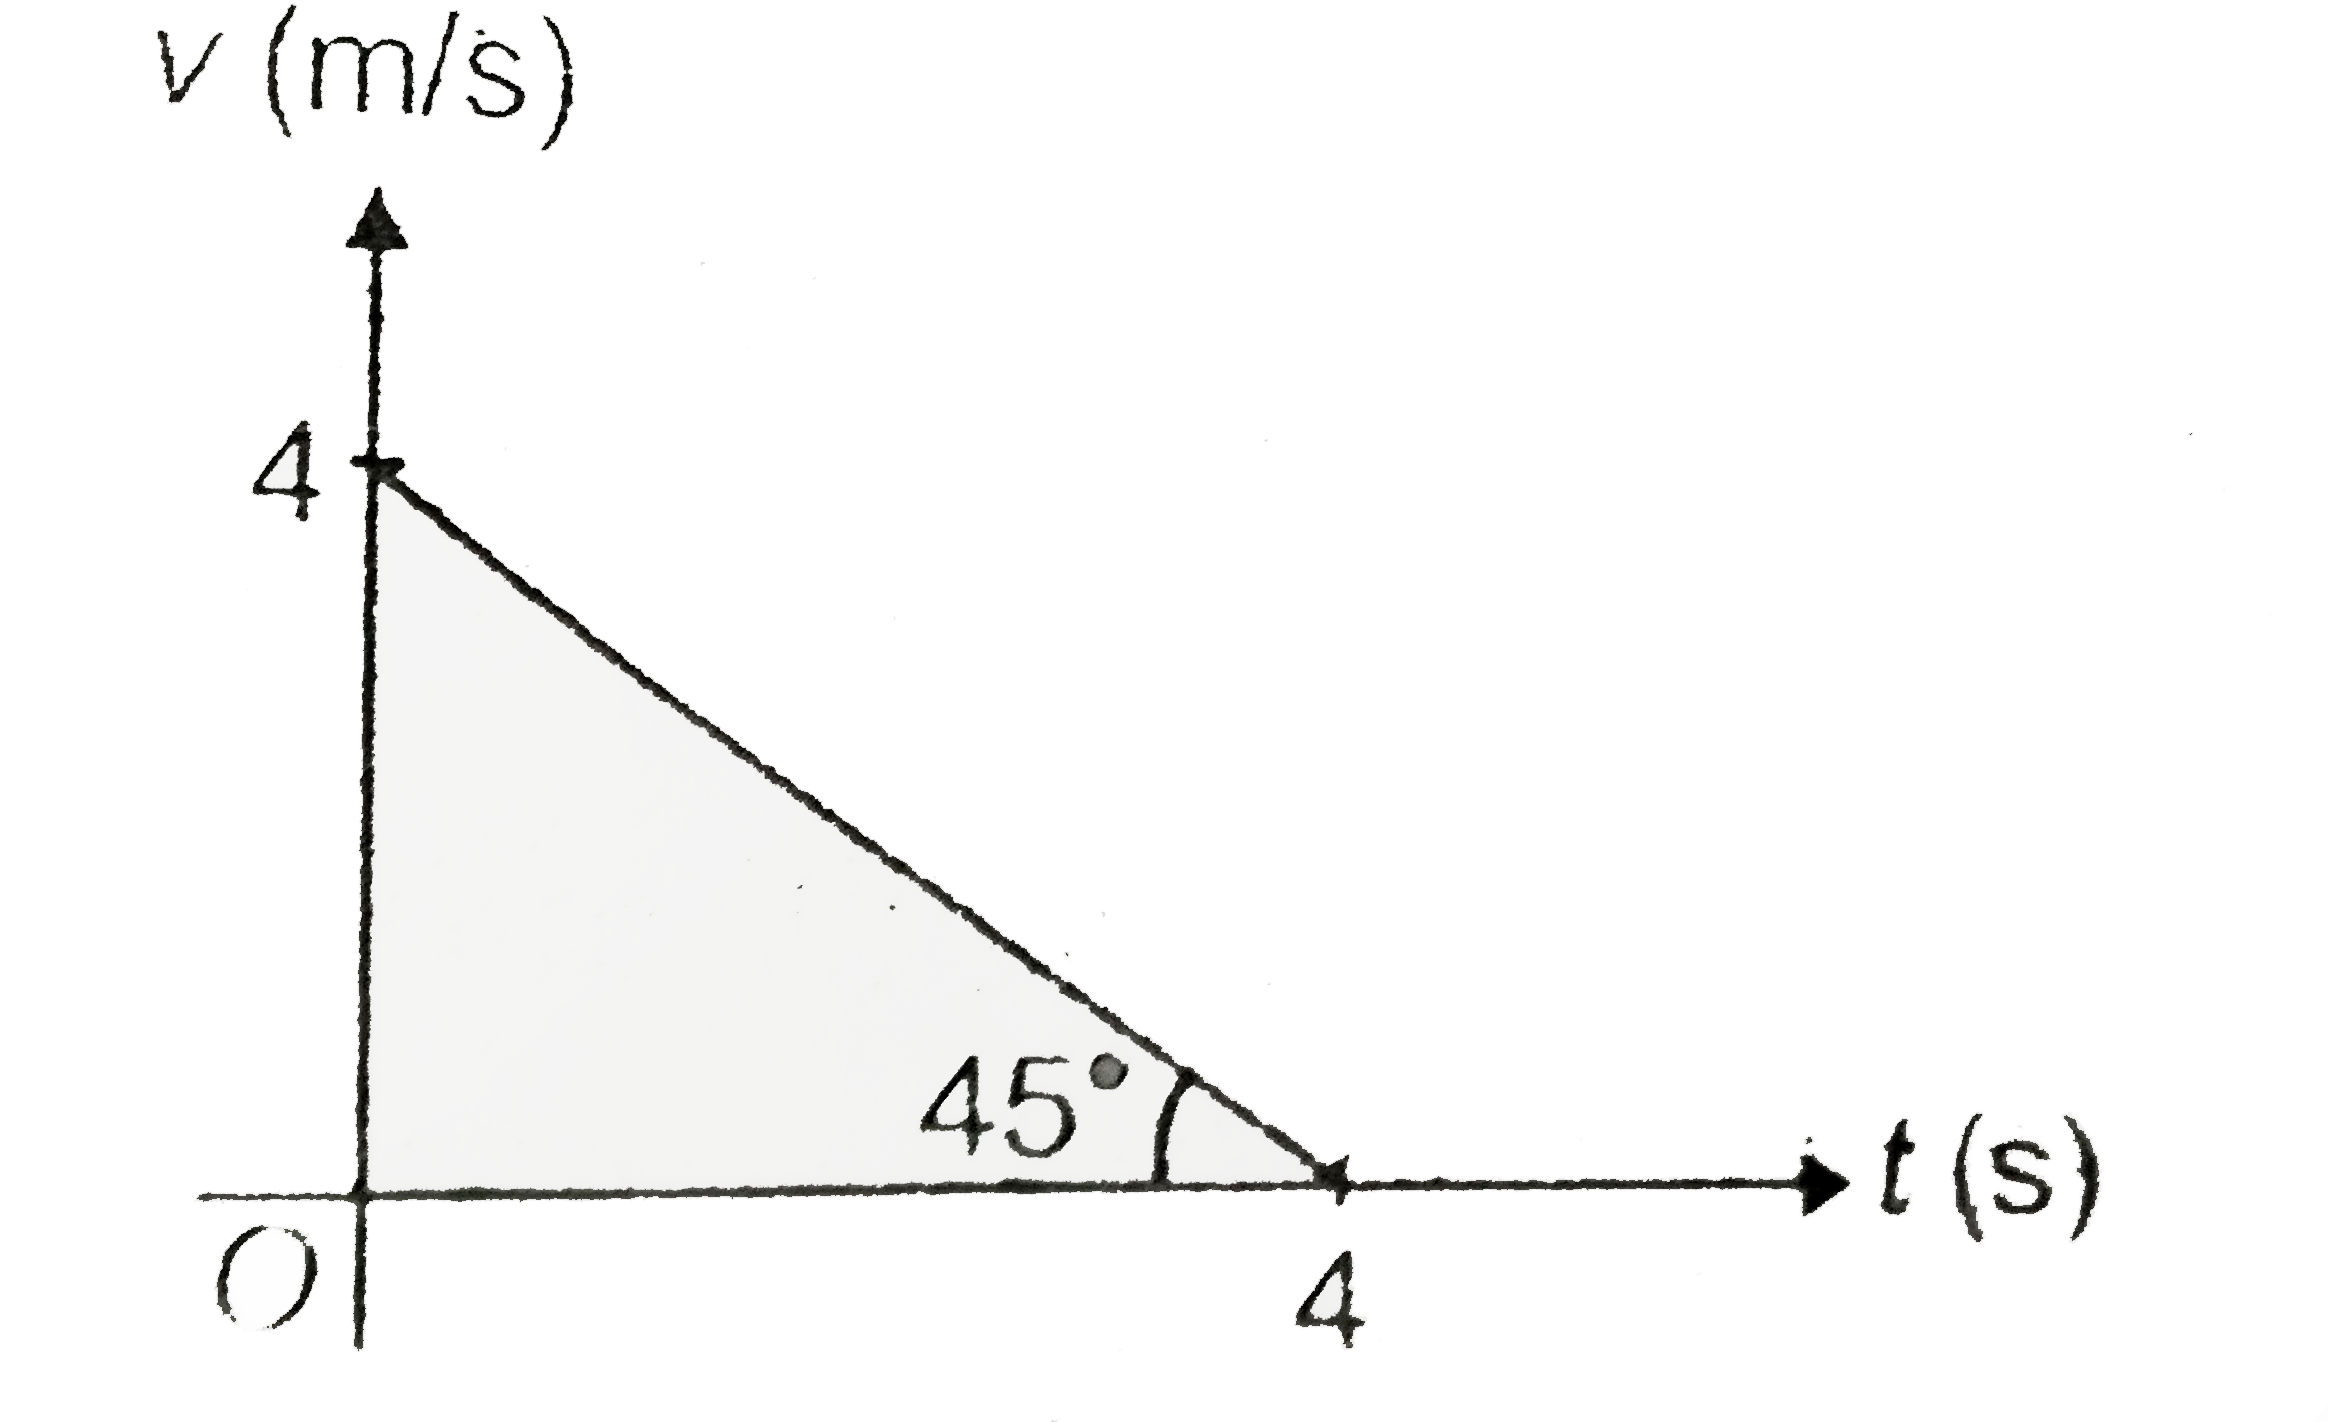
Draw the acceleration-time graph and position-time graph, given that at t = 0, particle is at origin.
View SolutionDraw the velocity-time graph for uniformly accelerated motion. Show that slope of the velocity-time graph gives acceleration of the object.
View Solution1.The acceleration of a moving body can be found from (A) Area under velocity-time graph (B) Area under distance-time graph (C) Slope of the velocity-time graph (D) Slope of distance-time graph
View SolutionThe velocity - time graph of a body is given in figure below .
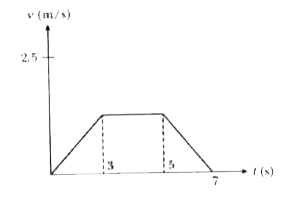
The acceleration-time graph of the motion of the body is
View SolutionFigure shows the acceleration-time graphs of a particle. Which of the following represents the corresponding velocity -time graph?
View Solution


