Study the given diagram and answer the following question.
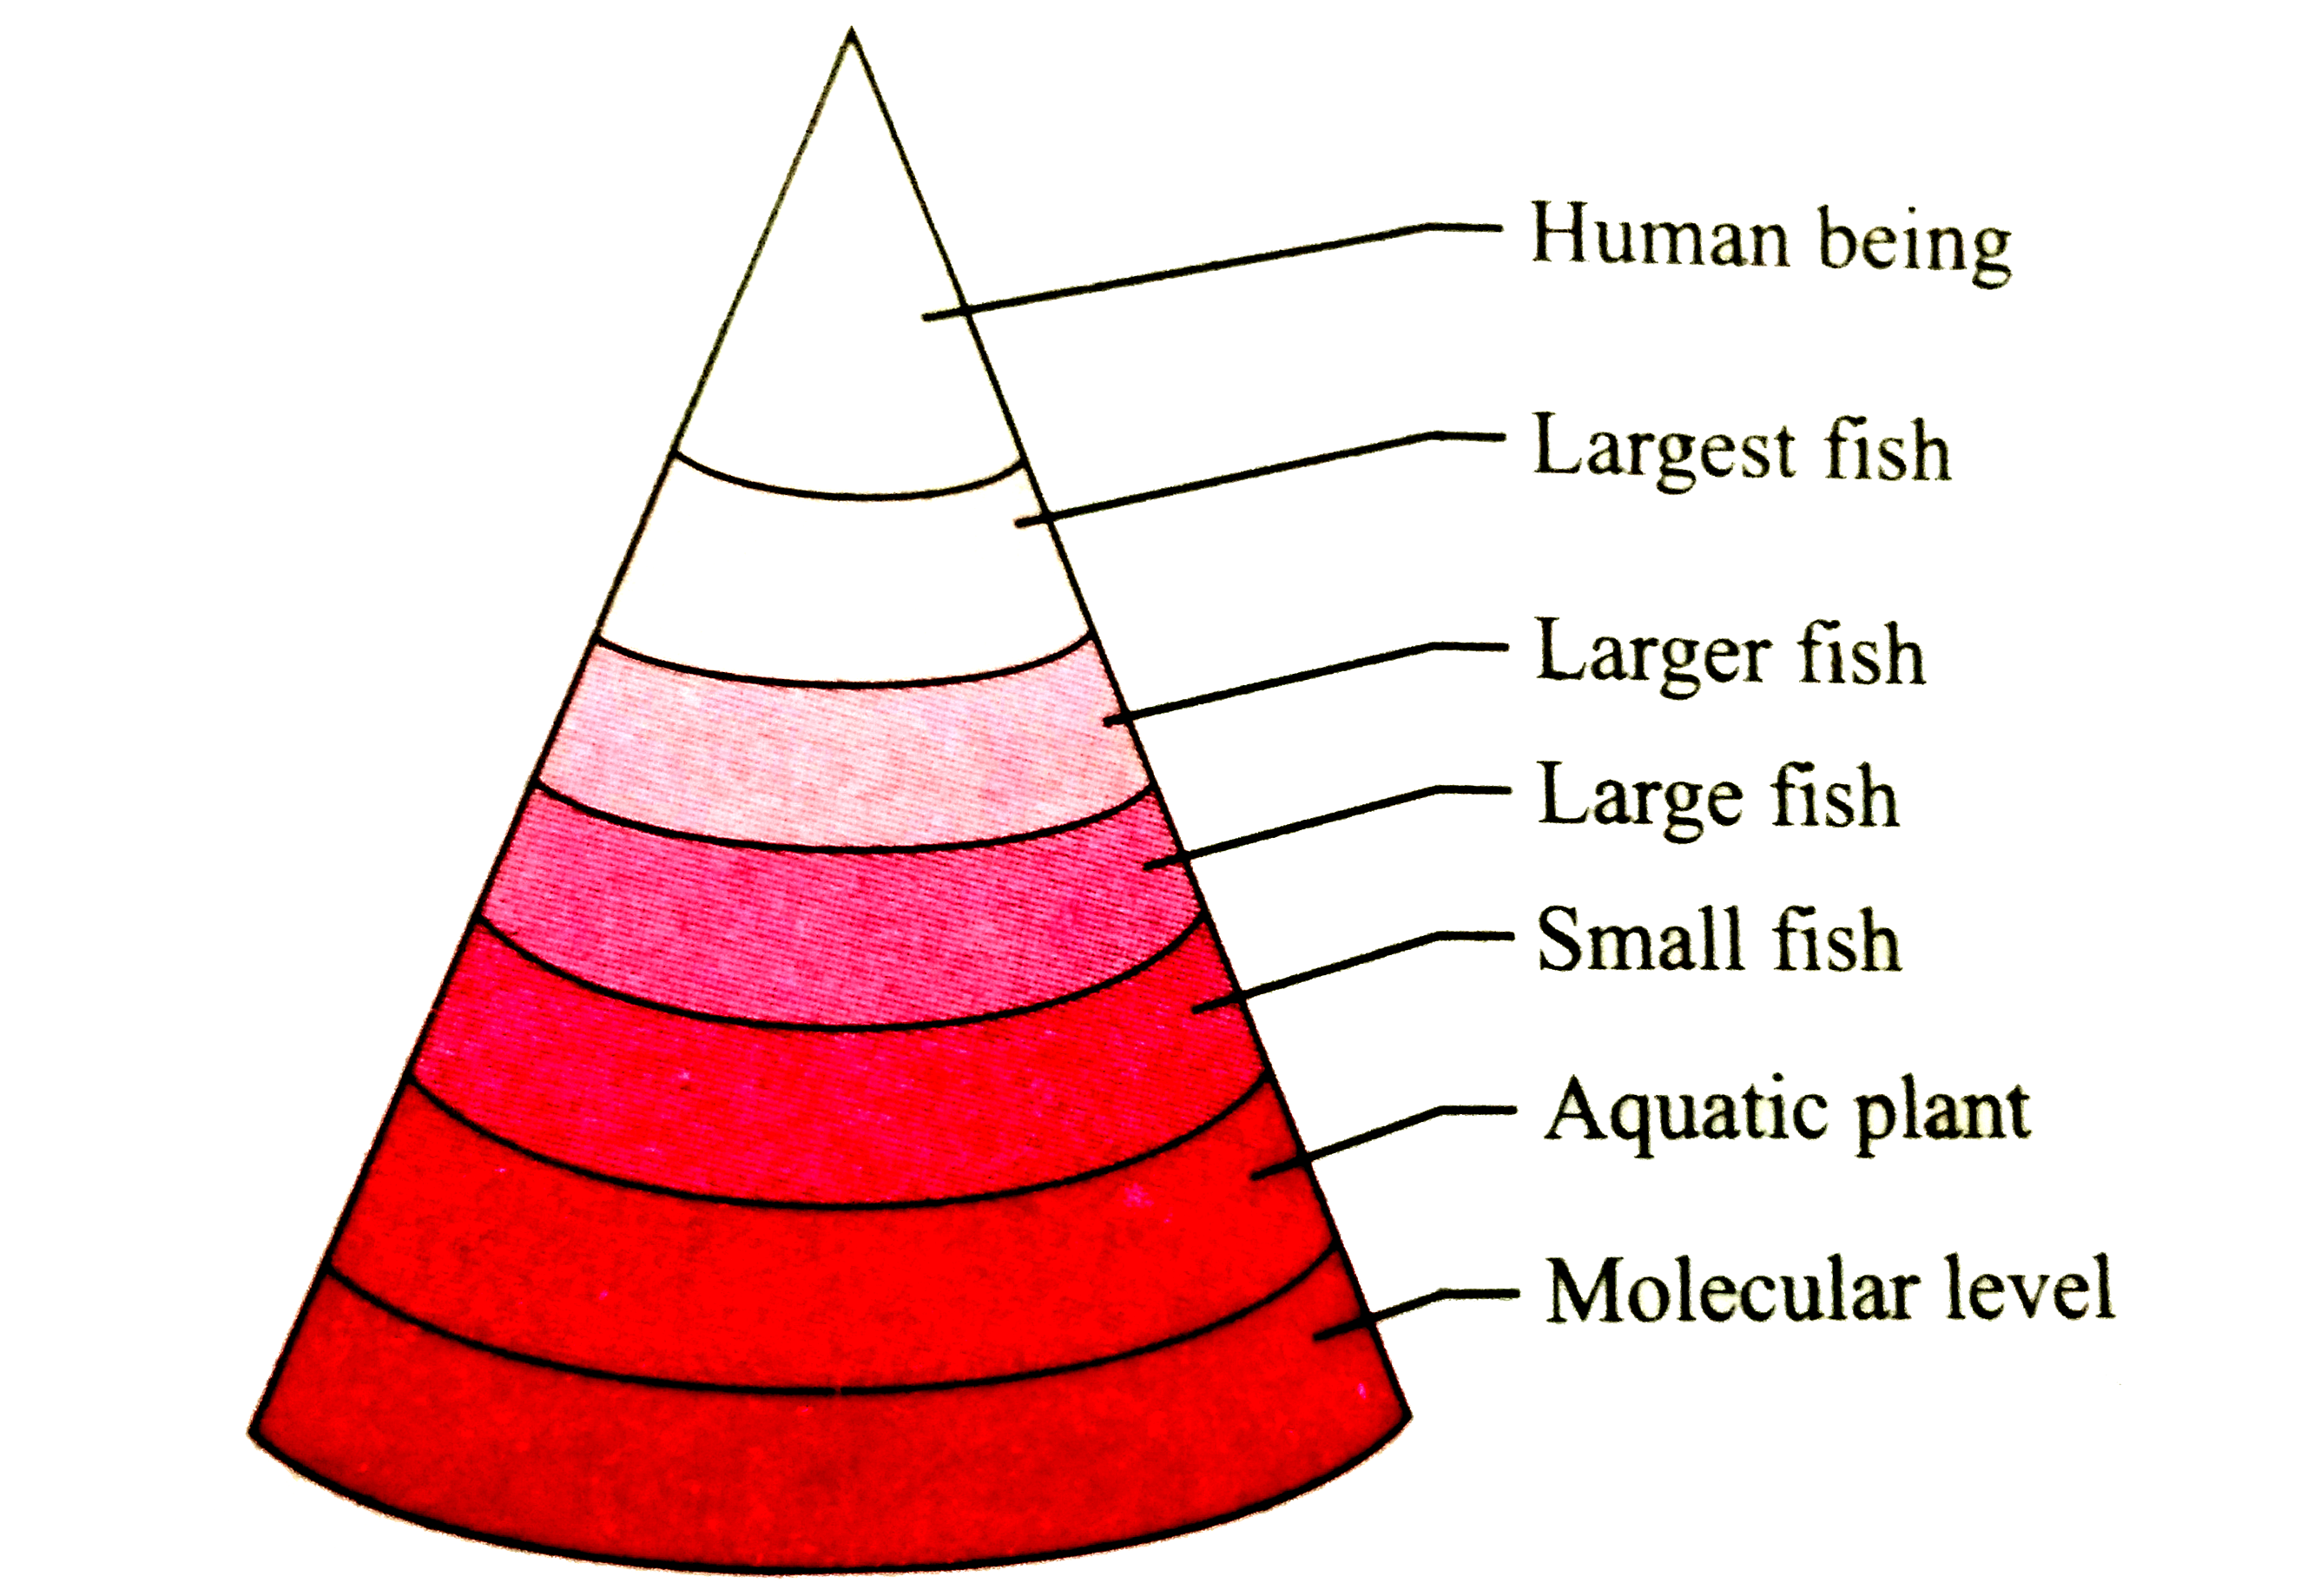
Which is the most appropriate statement about the figure ?
The trophic levels decrease from molecular level to human beings
At each tropic level the pollutants get approximately 10 times concentrated.
The level of pollutants is maximum at molecular level and minimum in human beings
Repeated use of toxins reduces its c oncentration at highest level
The correct Answer is:B
Most of the pesticides and other nonbiodegradable toxins are transferred from lower trophic level to higher trophic level through food chain . At every level the concentration of toxins increases ten times.
Topper's Solved these Questions
- ENVIRONMENTAL CHEMISTRYBOOK - NCERT FINGERTIPSCHAPTER - ENVIRONMENTAL CHEMISTRYEXERCISE - Higher Order Thinking Skills
9 Videos
- ENVIRONMENTAL CHEMISTRYBOOK - NCERT FINGERTIPSCHAPTER - ENVIRONMENTAL CHEMISTRYEXERCISE - NCERT Exemplar
12 Videos
- ENVIRONMENTAL CHEMISTRYBOOK - NCERT FINGERTIPSCHAPTER - ENVIRONMENTAL CHEMISTRYEXERCISE - Strategies To Control Environmental Pollution
2 Videos
- CLASSIFICATION OF ELEMENTS AND PERIODICITY BOOK - NCERT FINGERTIPSCHAPTER - CLASSIFICATION OF ELEMENTS AND PERIODICITY EXERCISE - Assertion And Reason
15 Videos
- EQUILIBRIUM BOOK - NCERT FINGERTIPSCHAPTER - EQUILIBRIUM EXERCISE - Assertion And Reason
15 Videos
Similar Questions
Knowledge Check
Refer to the given figure and answer the following questions
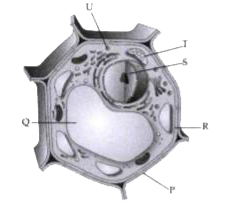
Which of the following statement is correct?APart marked as P is present in all prokaryotes and eukaryotes.BBoth the parts P and Q are present in animal cells.CPlant cells lack the part marked as S.DPart marked as R is selectively permeable in both prokaryotes and eukaryotes.Study the graph carefully and answer the following questions.
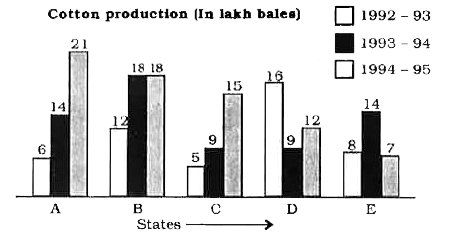
Which of the following statement is false ?AState A and E showed the same production in 1993-94.BThere was no improvement in the production of cotton in state B during 1994-95.CState A has produced maximum cotton during the given period.DProduction of state C and D together is equal to that of state B dring 1993-94.The pie chart shows the result of an online survey which asked people about their favourite game. Study the diagram and answer the following questions.
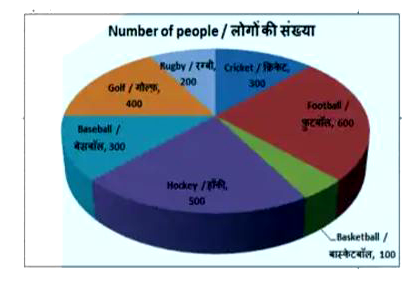
Which game is the favourite of most people surveyed?ABasketballBFootballCHockeyDGolf
Study the diagram given below and answer the following questions.
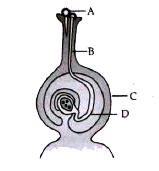
View SolutionStudy the diagram and answer the following questions
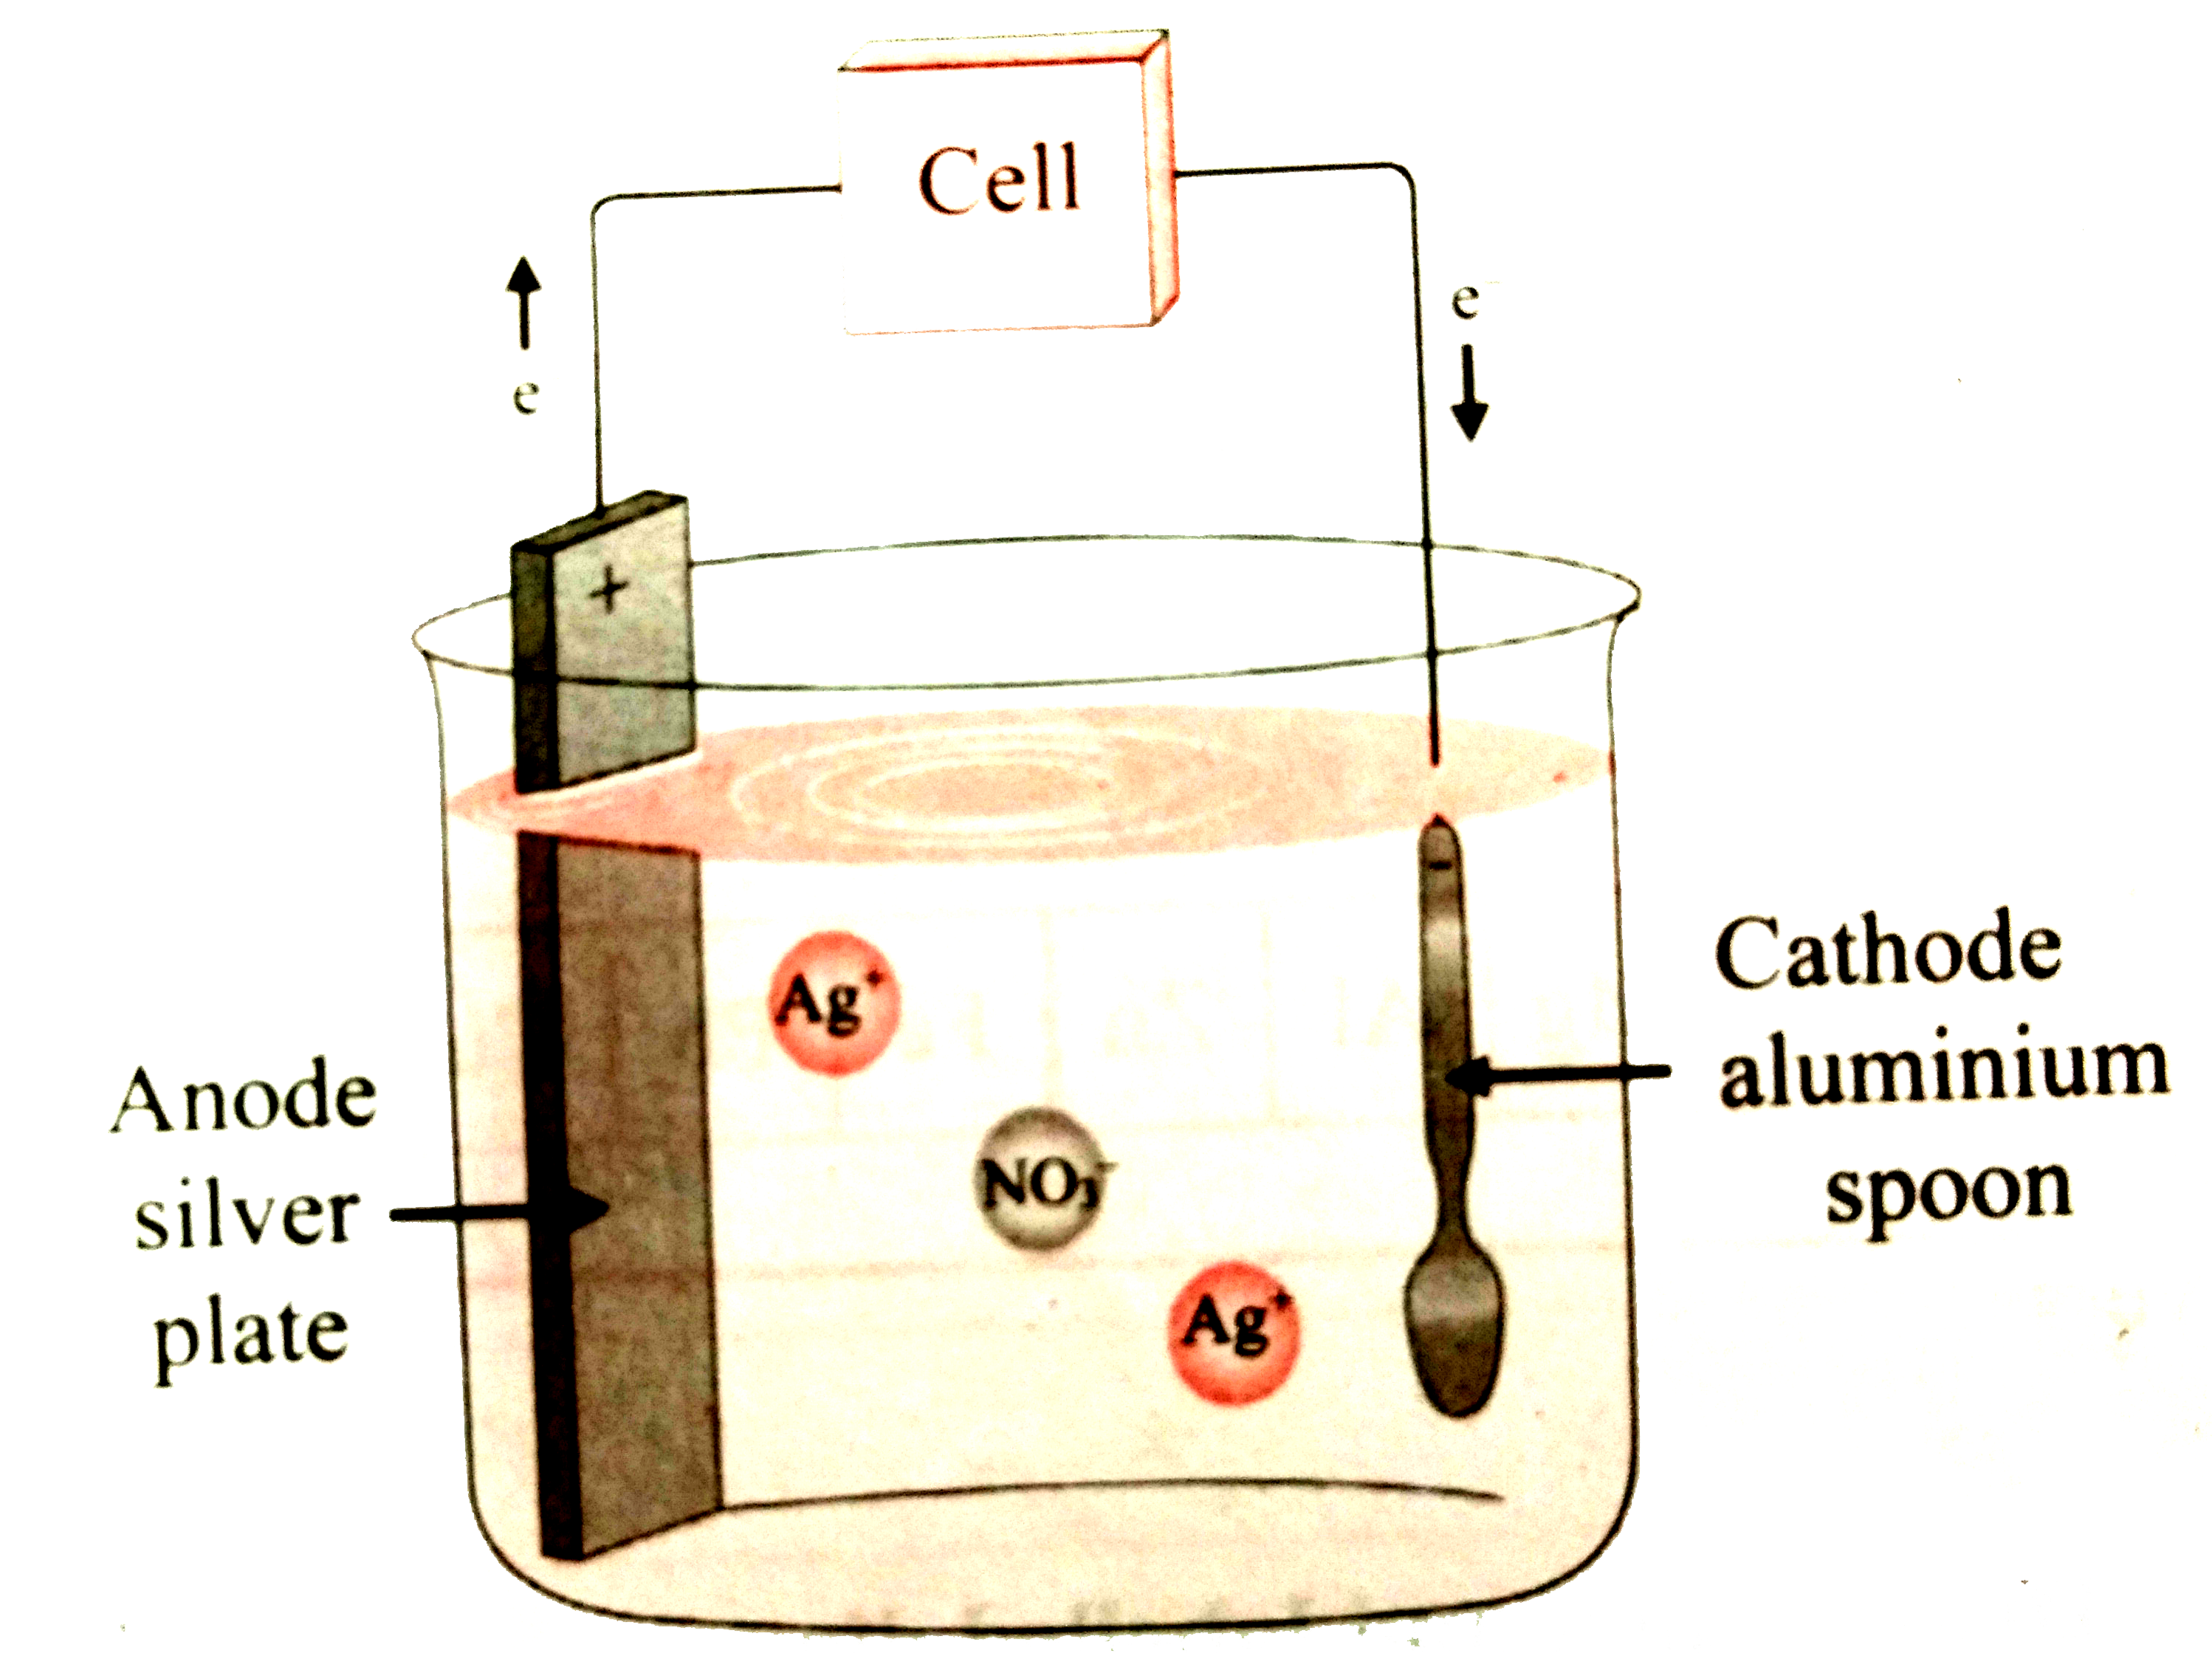
What does the diagram represent?
View SolutionStudy the diagram given below and answer the following question.
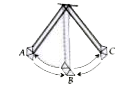
Which is the mean position of the swing?
View SolutionThe pie chart shows the results of an online survey which asked people about their favourite game. Study the diagram and answer the following questions.
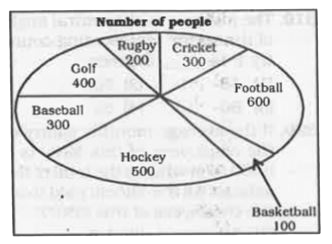
Which game is the favourite of most people surveyed?
View SolutionAnswer the following questions by selecting the most appropriate option
Which of the following is correct?
View Solution

