The graphs representing distribution of molecular speeds at 300 K for gases CI2 and N2 are as show in figure :
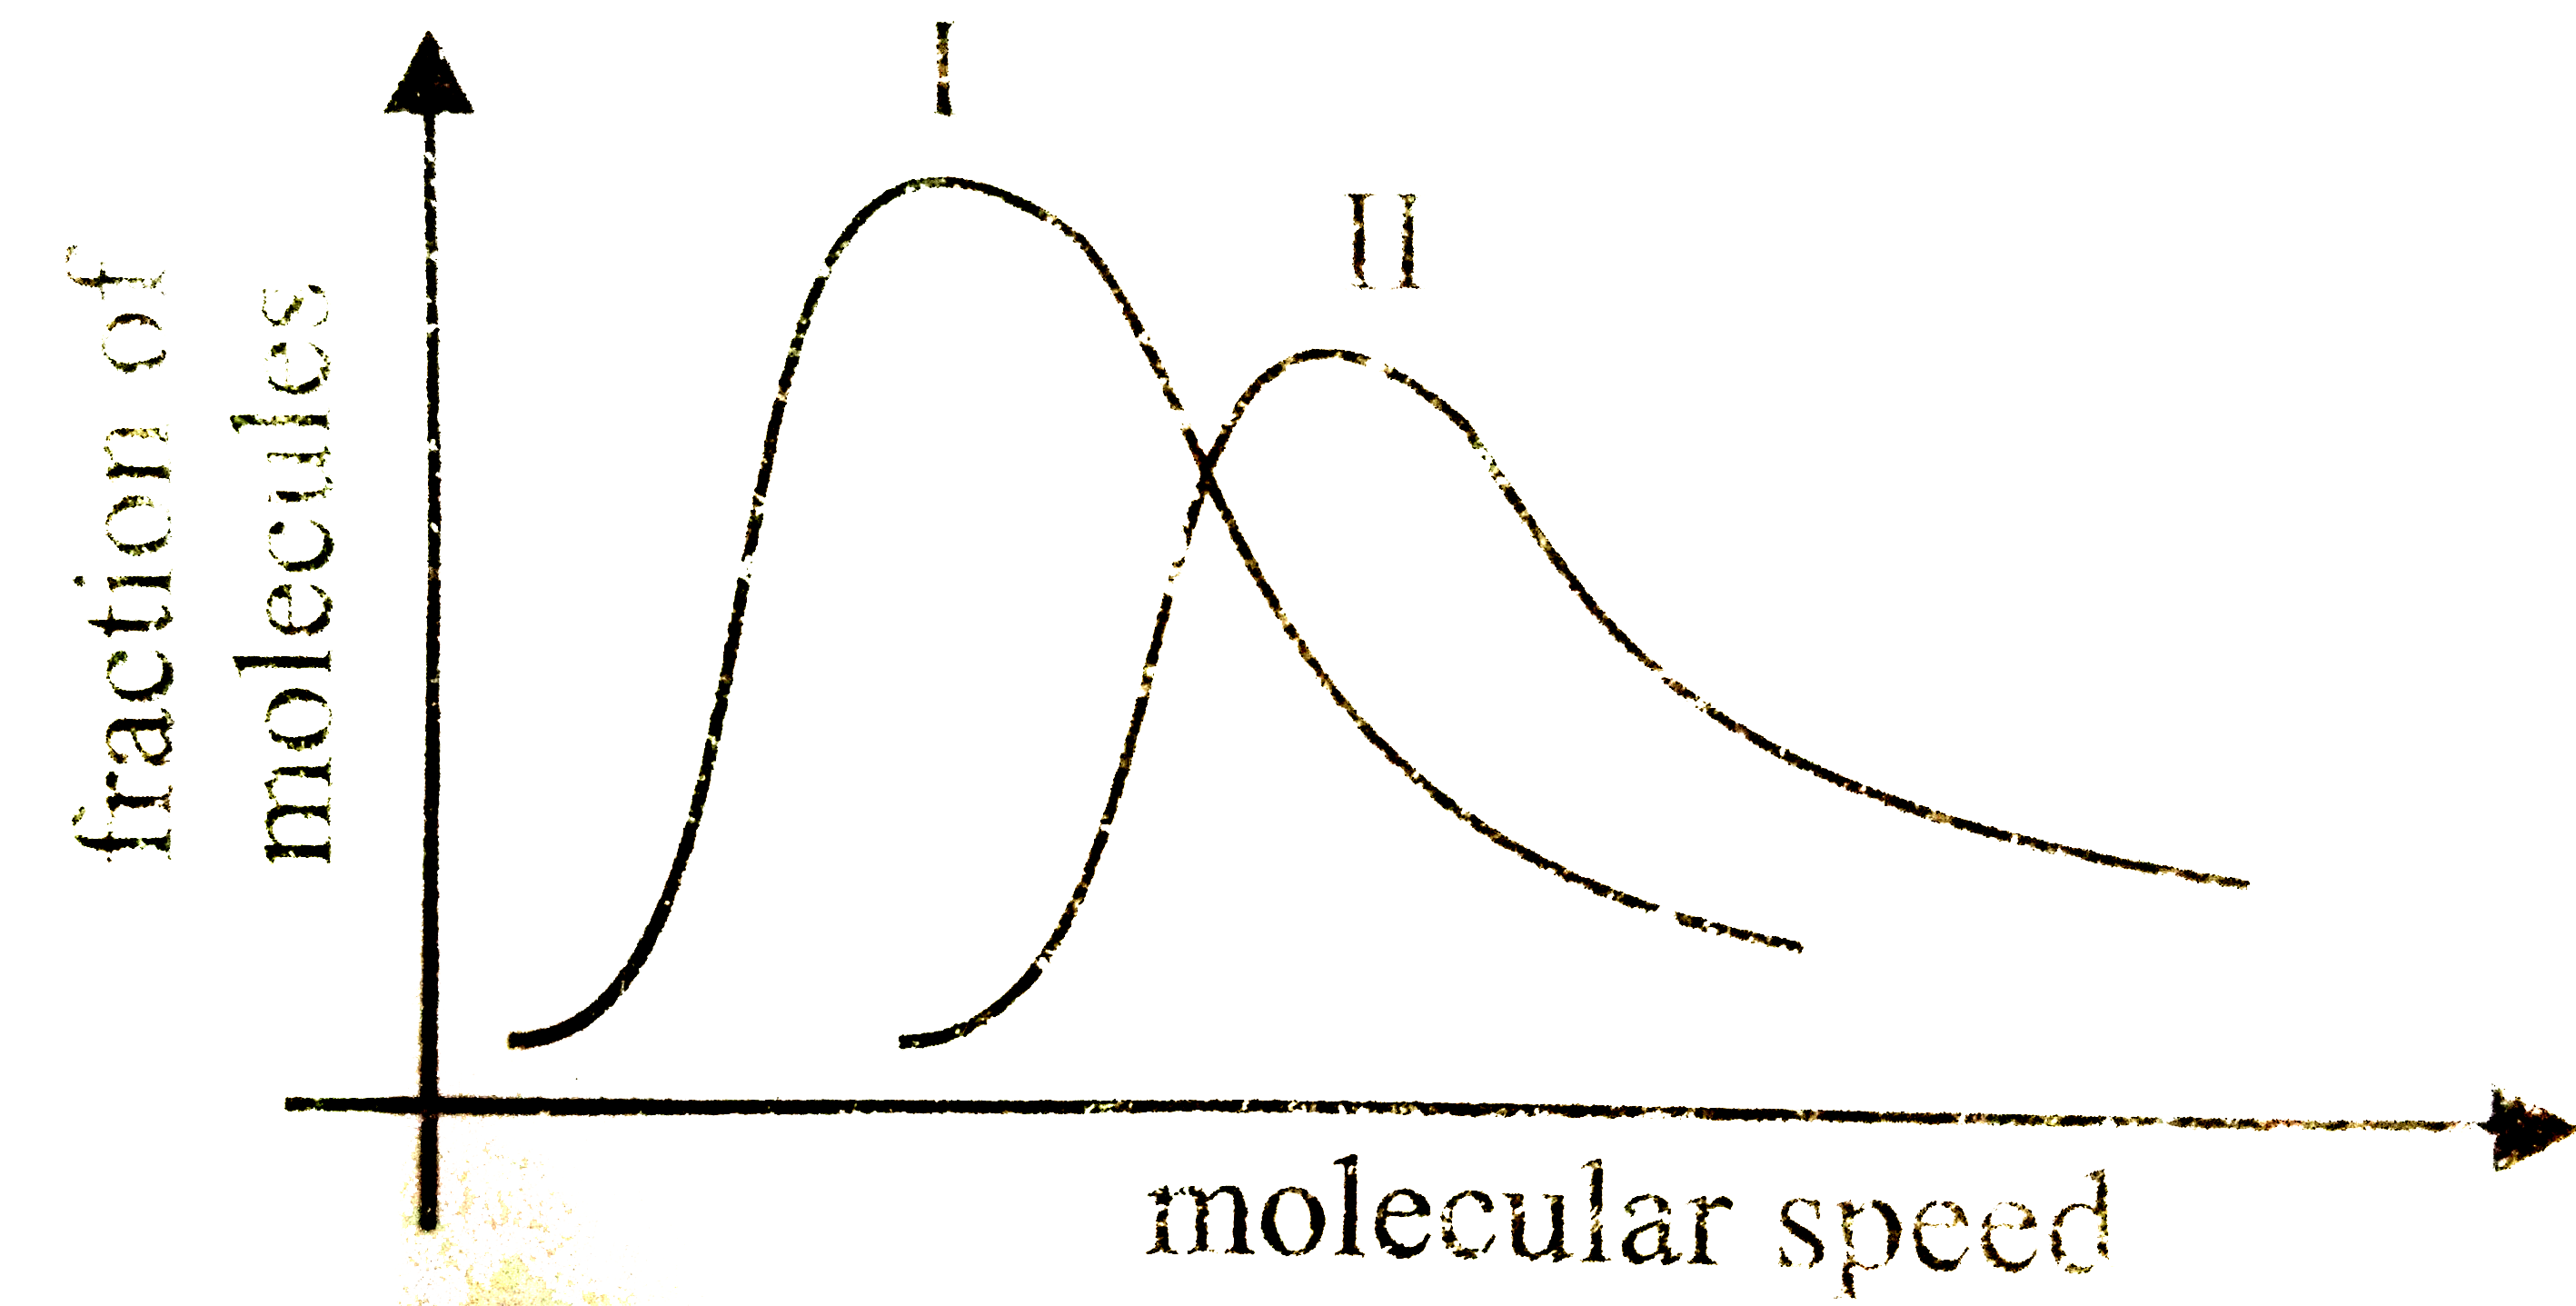
Select the correct option .
A
I graph is for N2 and II is for Cl2
B
II graph is for N2 and I is for Cl2
C
Either graph can be taken for N2 or Cl2
D
Information is not sufficient .
Video Solution
Text Solution
The correct Answer is:B
Molecular weight of Cl2 is more than molecular weight of N2.
|
Topper's Solved these Questions
- STATES OF MATTER Book:NCERT FINGERTIPSChapter:STATES OF MATTER Exercise:Kinetic Molecular Theory Of Gases
Explore 4 Videos
- STATES OF MATTER Book:NCERT FINGERTIPSChapter:STATES OF MATTER Exercise:Behaviour Of Real Gases
Explore 15 Videos
- STATES OF MATTER Book:NCERT FINGERTIPSChapter:STATES OF MATTER Exercise:Ideal Gas Equation
Explore 33 Videos
- SOME BASIC CONCEPTS OF CHEMISTRY Book:NCERT FINGERTIPSChapter:SOME BASIC CONCEPTS OF CHEMISTRY Exercise:Assertion And Reason
Explore 10 Videos
- STRUCTURE OF ATOM Book:NCERT FINGERTIPSChapter:STRUCTURE OF ATOM Exercise:Assertion And Reason
Explore 15 Videos
Similar Questions
Knowledge Check
The graphs representing distribution of molecular speeds at 300 K for gases CI2 and N2 are as shown below (Atomic mass N=14,CI=35.5):
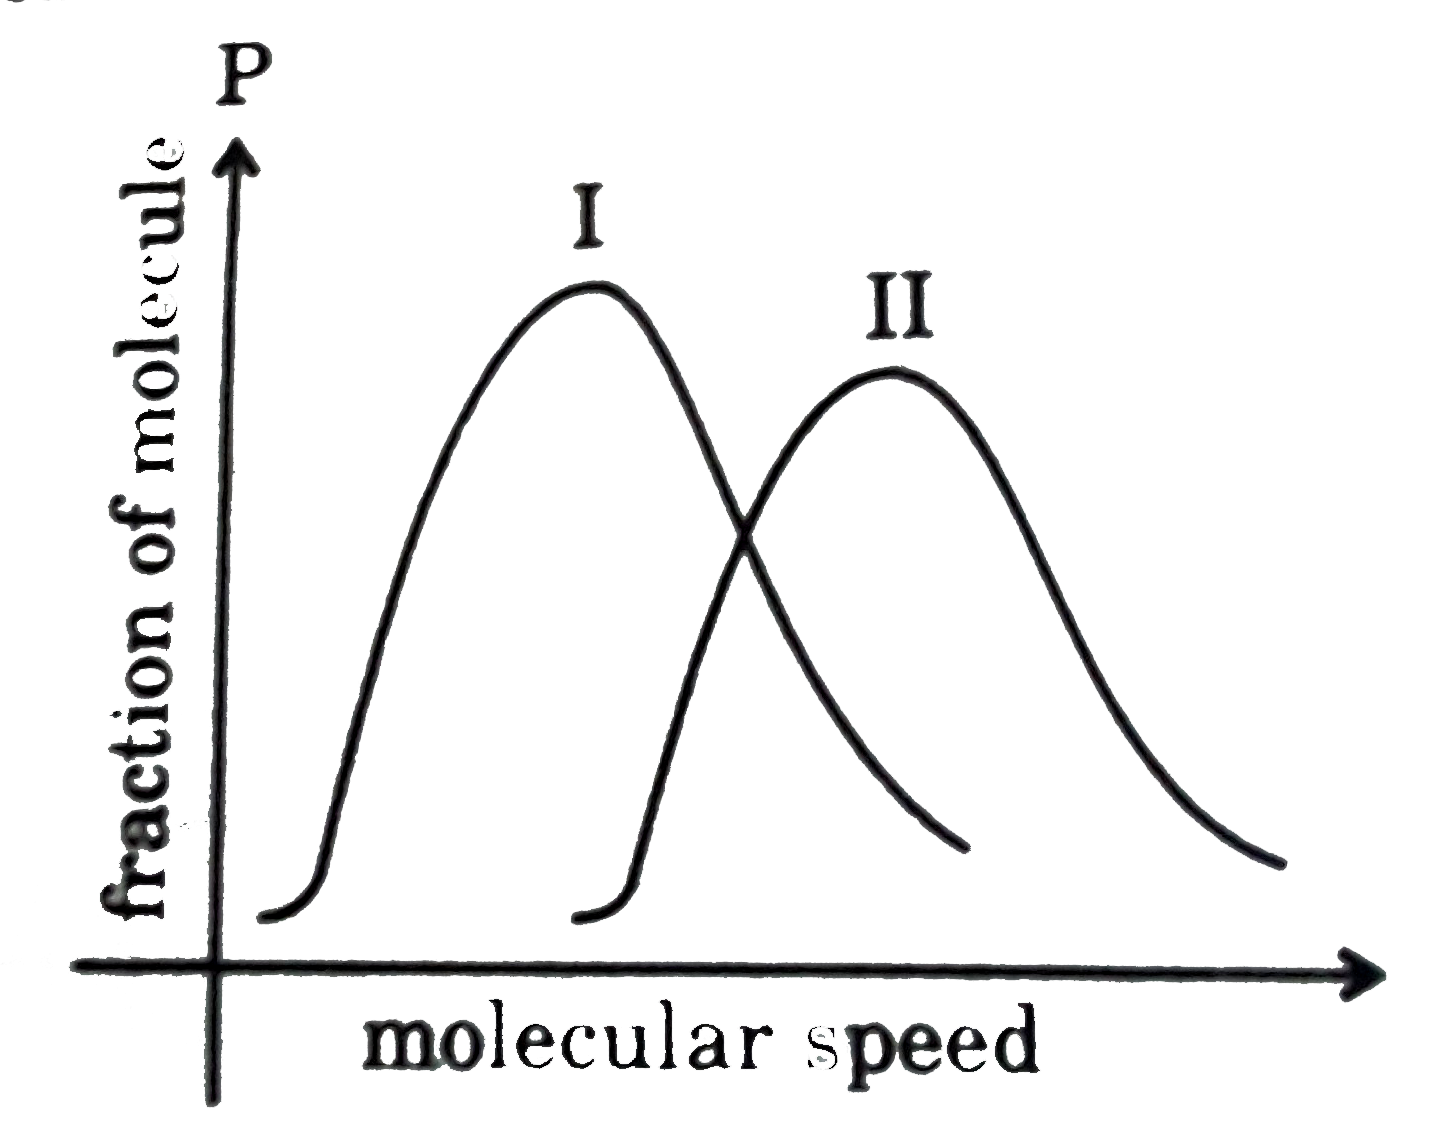 AI graph is for N2 and II is for CI2BII graph is for N2 and I is for CI2Ceither graph can be taken for N2 or CI2Dinformation is not sufficient
Identify the stage shows in the figure and select the correct option
 AA-Late prophase , B-Anaphase , C-Telophase , D-ProphaseBA-Late prophase, B - Metaphase of mitosis, C- Prophase I of meiosis, D-metaphase I of meiosisCA-Late prophase, B - Metaphase of mitosis, C- Metaphase I of meiosis, D-Prophase I of meiosisDA - Metaphase , B - Anaphase, C - Telophase, D - Prophase I of meisos
The graph below shows the distribution of molecular speeds of two ideal gases X and Y at 200 K . On the basis of the below graph, identify the correct statements .
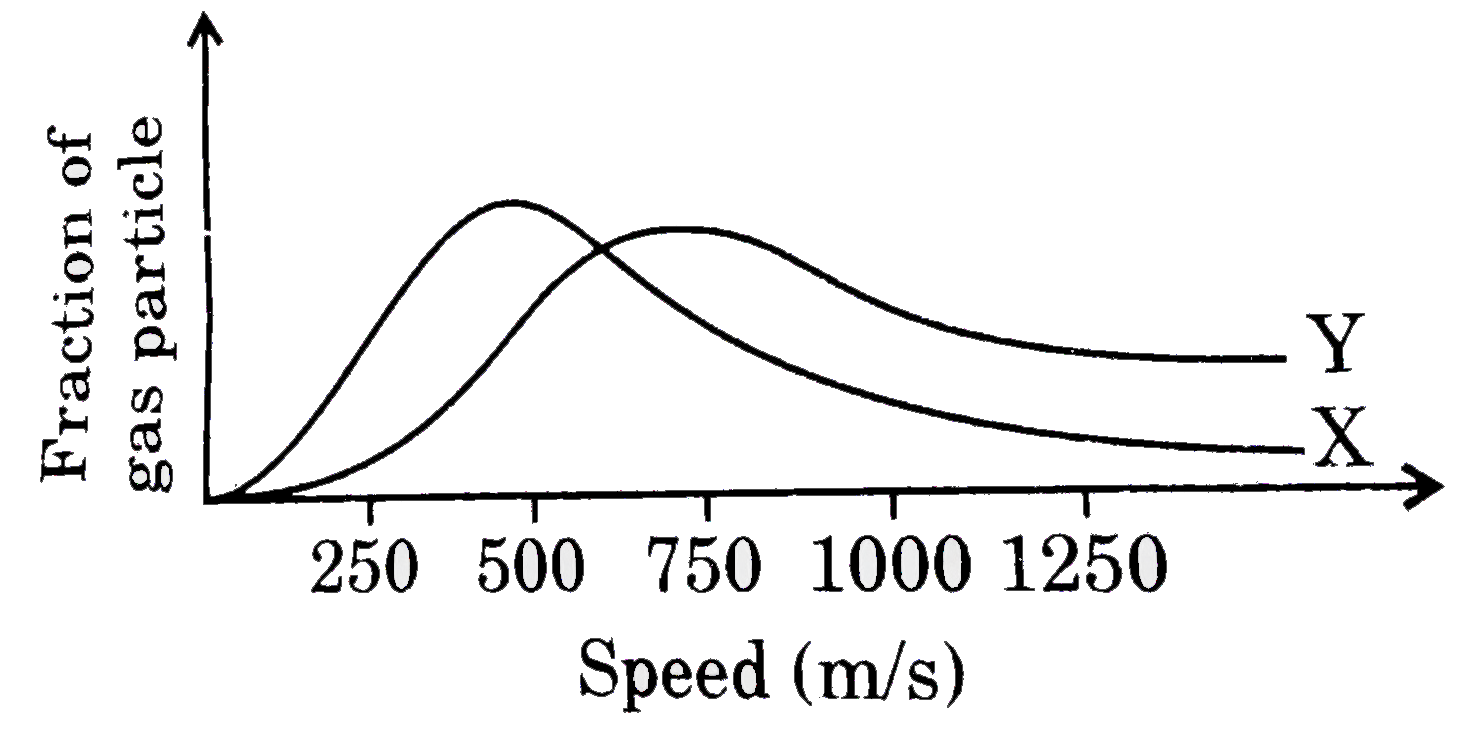 AIf gas X is methane, then gas Y can be CO2BFraction of molecules of X must be grater then Y in a particular range of speed a 200KCUnder identical conditions rate of effusion of Y is greater than that of XDThe molar kinetic energy of gas X at 200K is equa to the molar kinetic energy of Y at 200 K
The root mean square speeds at STP for the gases H2+,N2+,O2 and HBr are in the order :
View SolutionThe root mean square speeds at STP for the gases H2,N2,O2 and HBr are in the order :
View Solution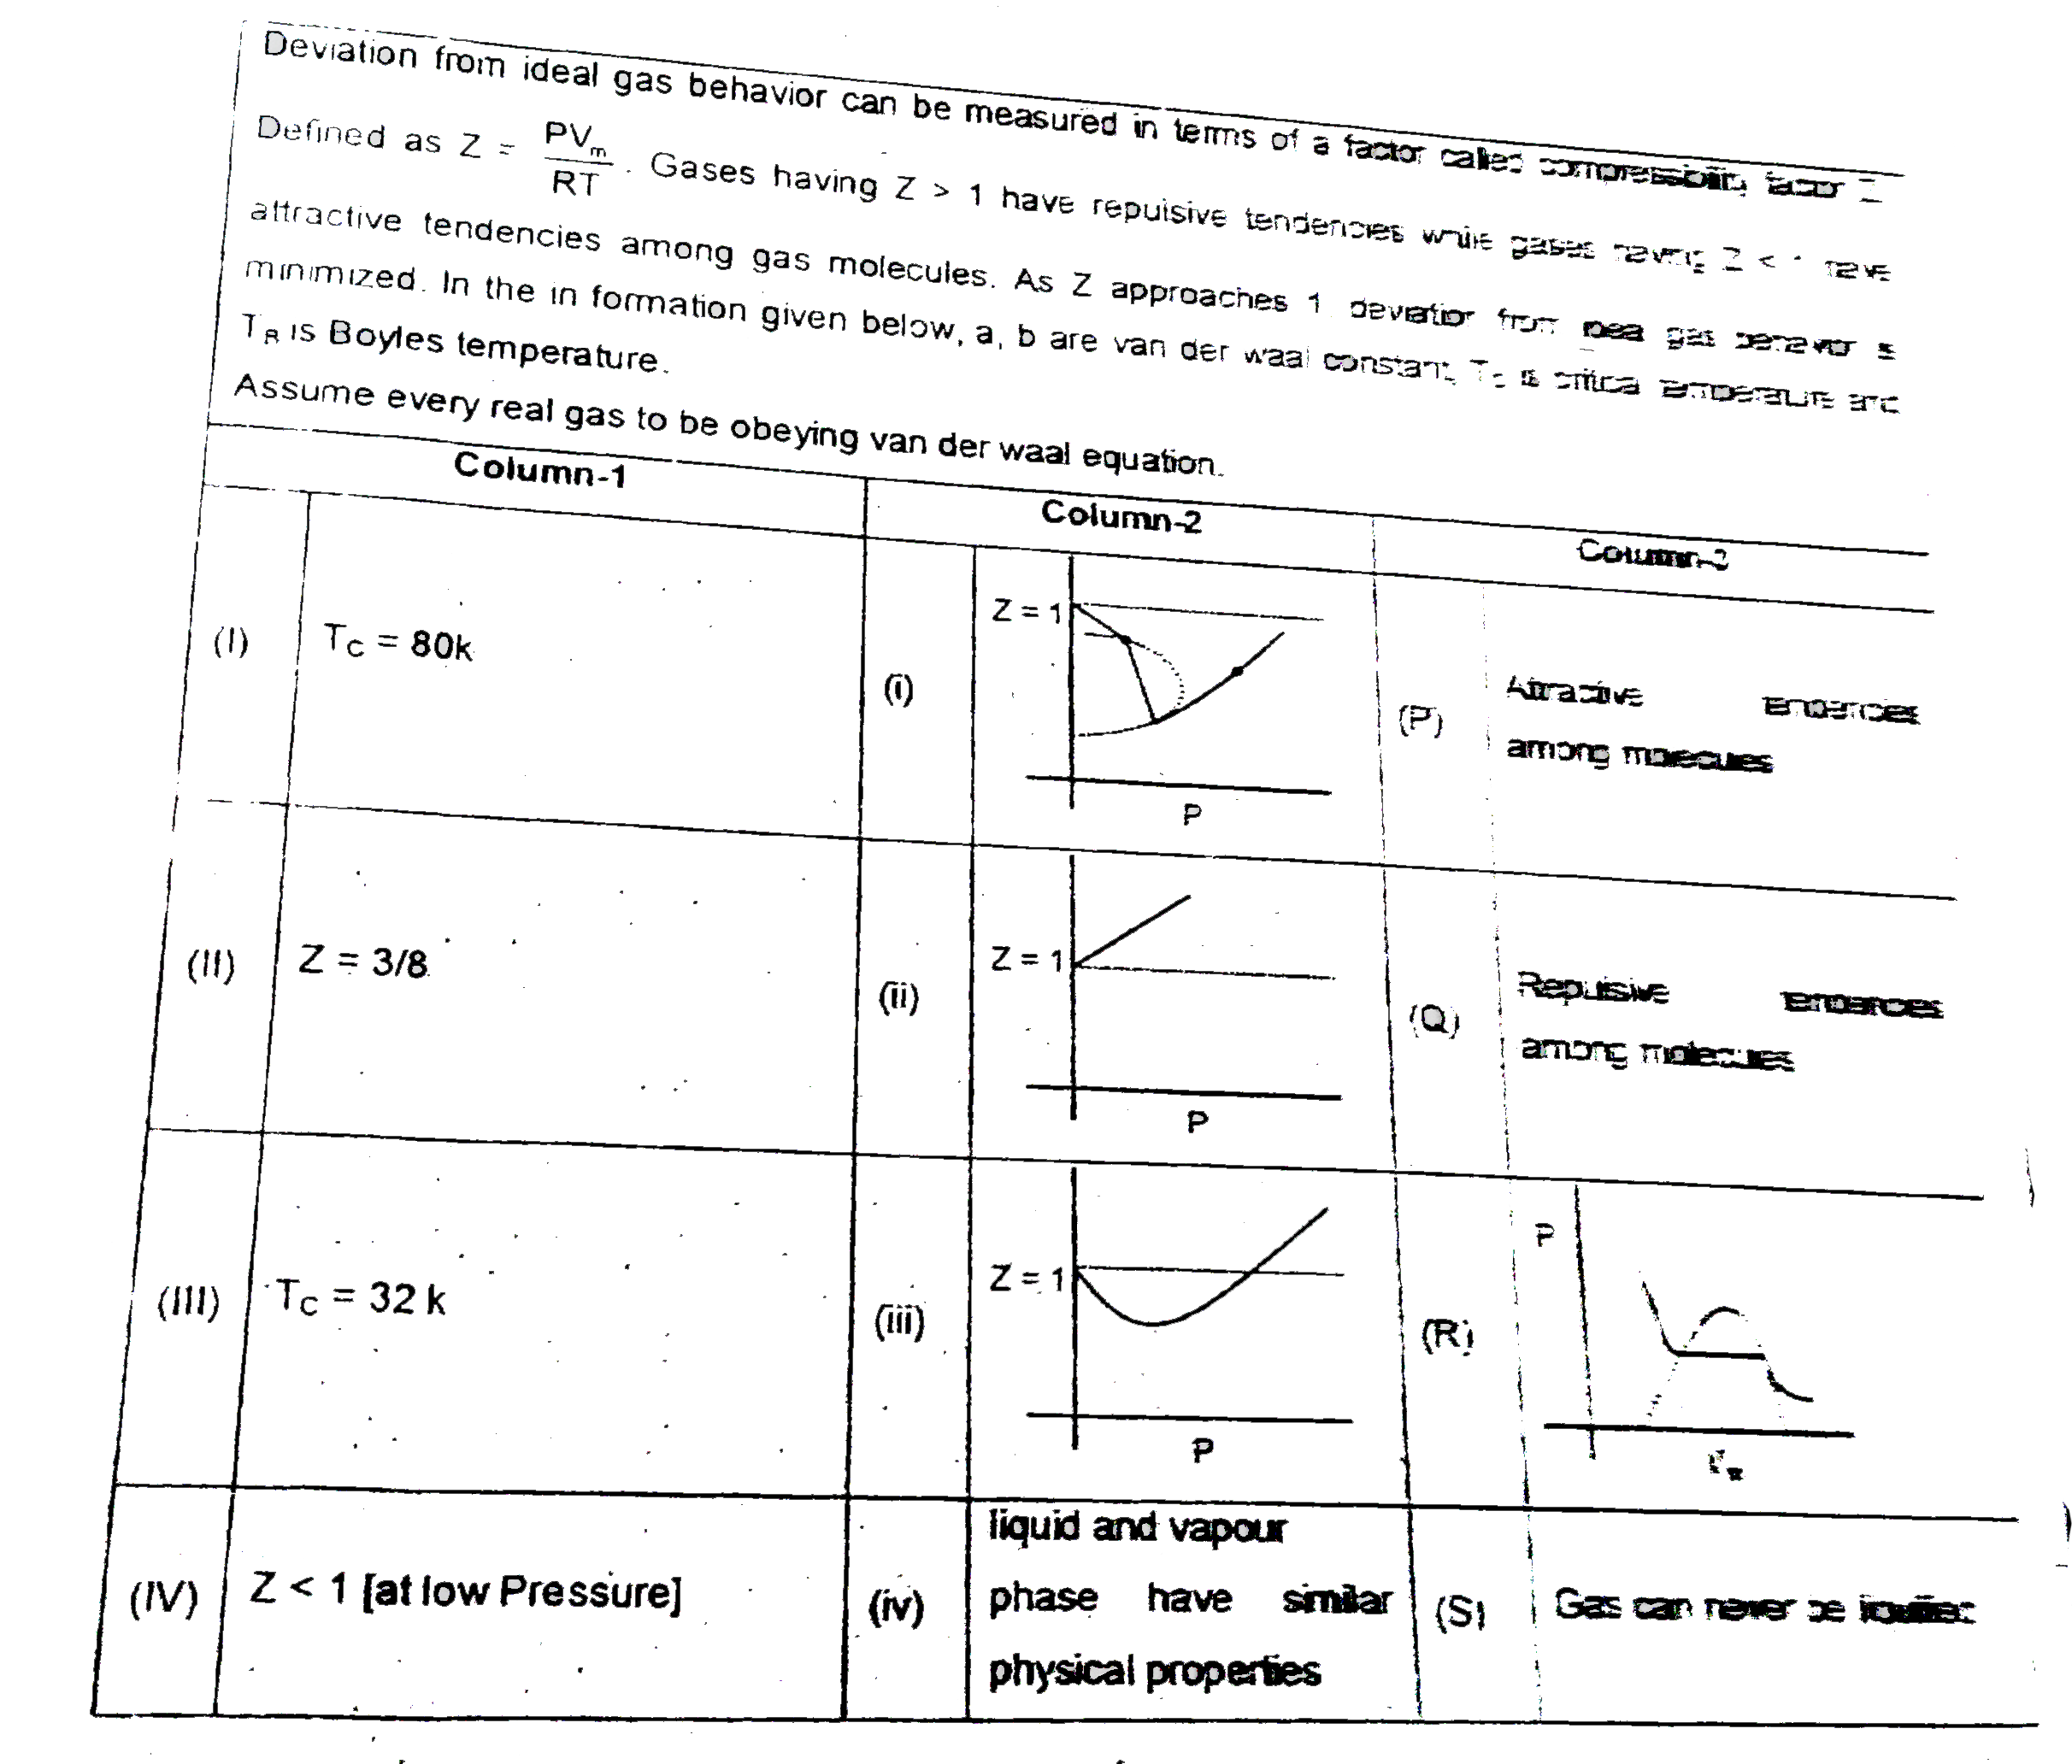
For a H2 like gas (at 298 K) having TB=108k, select the only correct option-
View SolutionWhich of the following graphs regarding Maxwell distribution of speed are correct for ideal gases ?
View SolutionIdentify the figures A,B,C showing different types of muscle and select the correct option

View Solution


