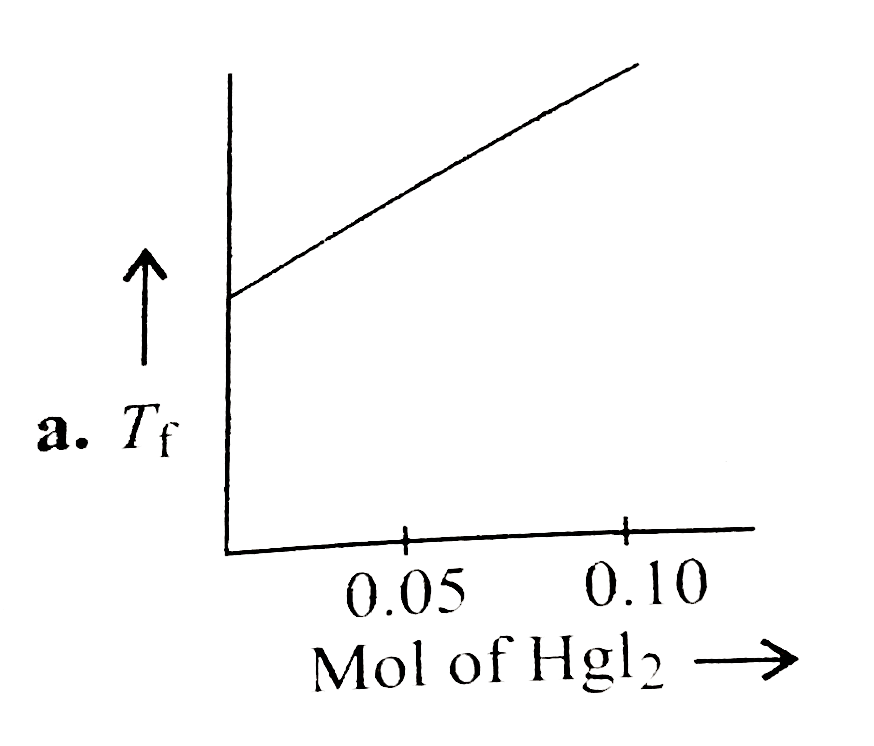
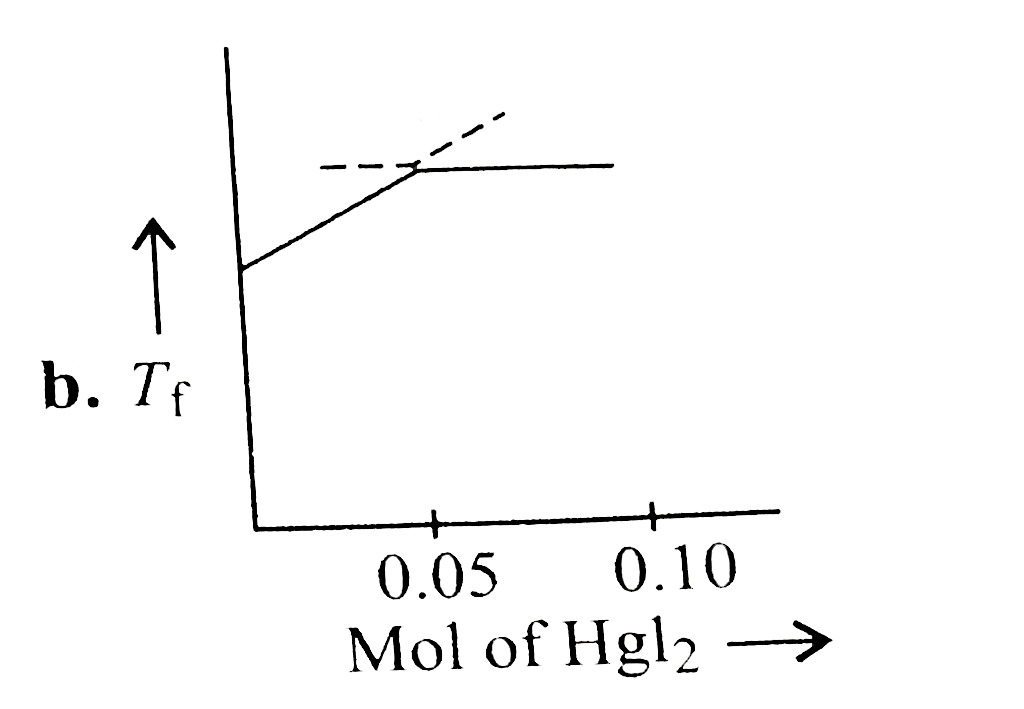
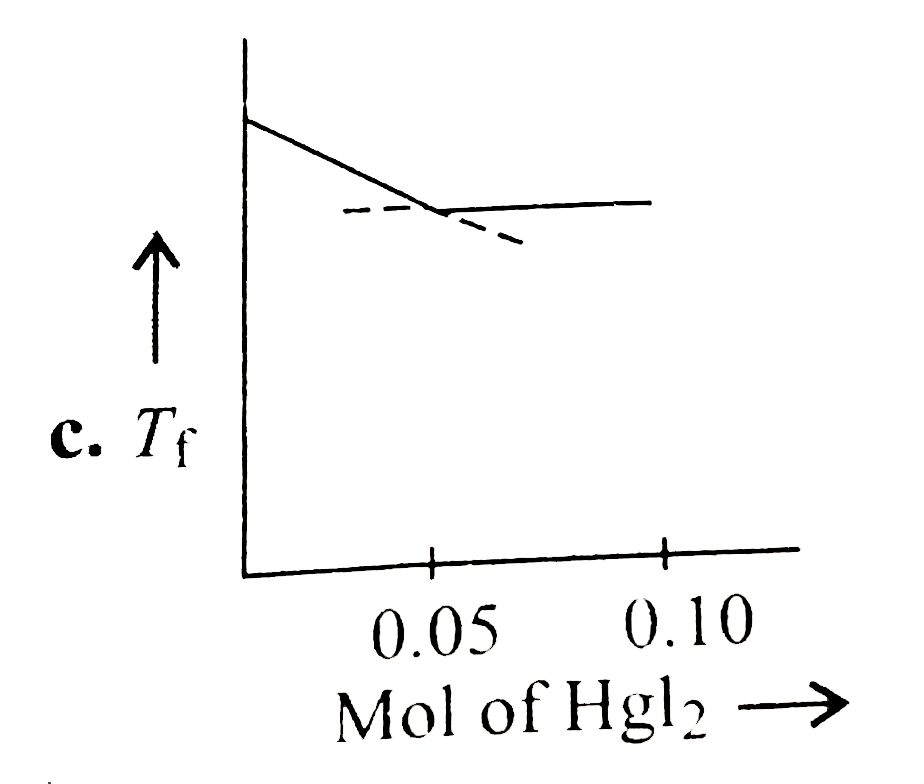
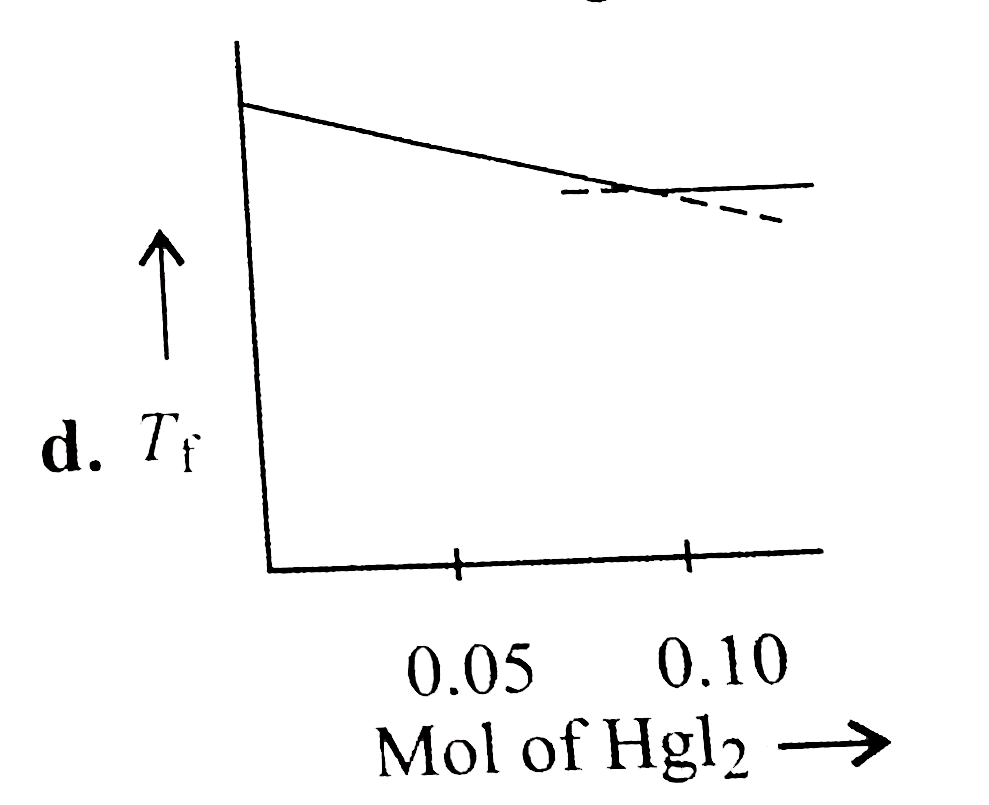
Increasing amount of solid Hgl2 is added to 1L of an aqueous solution containing 0.1molKI. Which fo the following graphs do represent the variation of freezing point of the resulting with the amount of Hgi2 added?
A
B
C
D
Video Solution
Text Solution
The correct Answer is:B
When Hgl2 is added to KI:
HgI2+2KI→K2HgI4
Moles0.050.1−−0.05
⇒ 0.05 moles of HgI2 are required for its complex reaction with KI.
Thus, as HgI2 is being added, the number of solute molecules will decrease causing ΔTf to decrease ⇒ (Causing Tf to increase).When whole of KI has been converted to K2HgI4, further addition of HgI2 does not change Tf since it is a sparingly soluble salt.
|
Topper's Solved these Questions
Similar Questions
Knowledge Check
Increasing amount of solid Hgl2 is added to 1L of an aqueous solution containing 0.1molKI. Which fo the following graphs do represent the variation of freezing point of the resulting with the amount of Hgi2 added?
A B
B C
C D
D
Which of the following graph represents the variation of amount of chemisorption of a gas by a solid with temperature under constant pressure?
A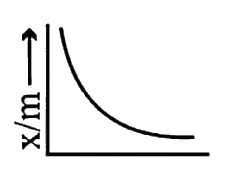 B
B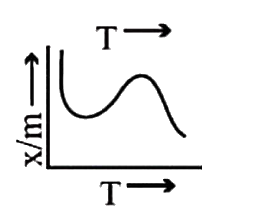 C
C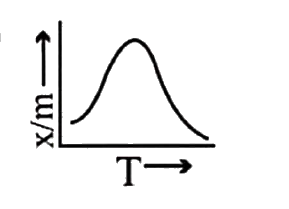 D
D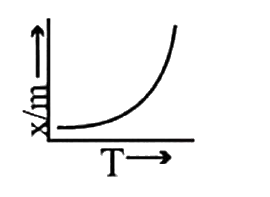
Which of the following options are correctly representing the increasing order of freezing points of aqueous solutions ?
A0.01mAl2(SO4)3>0.01mBaCl2>0.01mNaCl>0.01m glucoseB0.01mBaCl2>0.01mNaCl>0.01mCH3COOHC0.01mglucose>0.01mCH3COOH>0.01mKClD0.01mBaCl2=0.01mKCl=0.01m glucose
Which of the following 0.1M aqueous solution will have lowest freezing point ?
View SolutionWhen HgI2 is added to aqueous solution of KI, which of the following are not correct statements
View SolutionWhich of the following 0.1M aqueous solutions will have the lowest freezing point?
View SolutionAn aqueous solution of KI is 1.0 molal in KI. Which change will cause the vapour pressure of the solution to increases ?
View SolutionA small amount of sodium hydroxide solution is added to a small pieces of granulated zinc metal in a test tube. Which of the following represent correct equation?
View Solution
