Actual graph for the given parameters in (Q.25) will be

I, III
I, II
II
I
As P increases, PV also increases, hence graph II.
Topper's Solved these Questions
- STATES OF MATTERBOOK - CENGAGE CHEMISTRYCHAPTER - STATES OF MATTEREXERCISE - Exercises (Assertion-Reasoning)
24 Videos
- STATES OF MATTERBOOK - CENGAGE CHEMISTRYCHAPTER - STATES OF MATTEREXERCISE - Exercises (Integer)
10 Videos
- STATES OF MATTERBOOK - CENGAGE CHEMISTRYCHAPTER - STATES OF MATTEREXERCISE - Exercises (Multiple Correcttype)
32 Videos
- SOME BASIC CONCEPTS AND MOLE CONCEPTBOOK - CENGAGE CHEMISTRYCHAPTER - SOME BASIC CONCEPTS AND MOLE CONCEPTEXERCISE - Archives Subjective
11 Videos
- STOICHIOMETRYBOOK - CENGAGE CHEMISTRYCHAPTER - STOICHIOMETRYEXERCISE - Archives Subjective
33 Videos
Similar Questions
Knowledge Check
The given graph indicates :
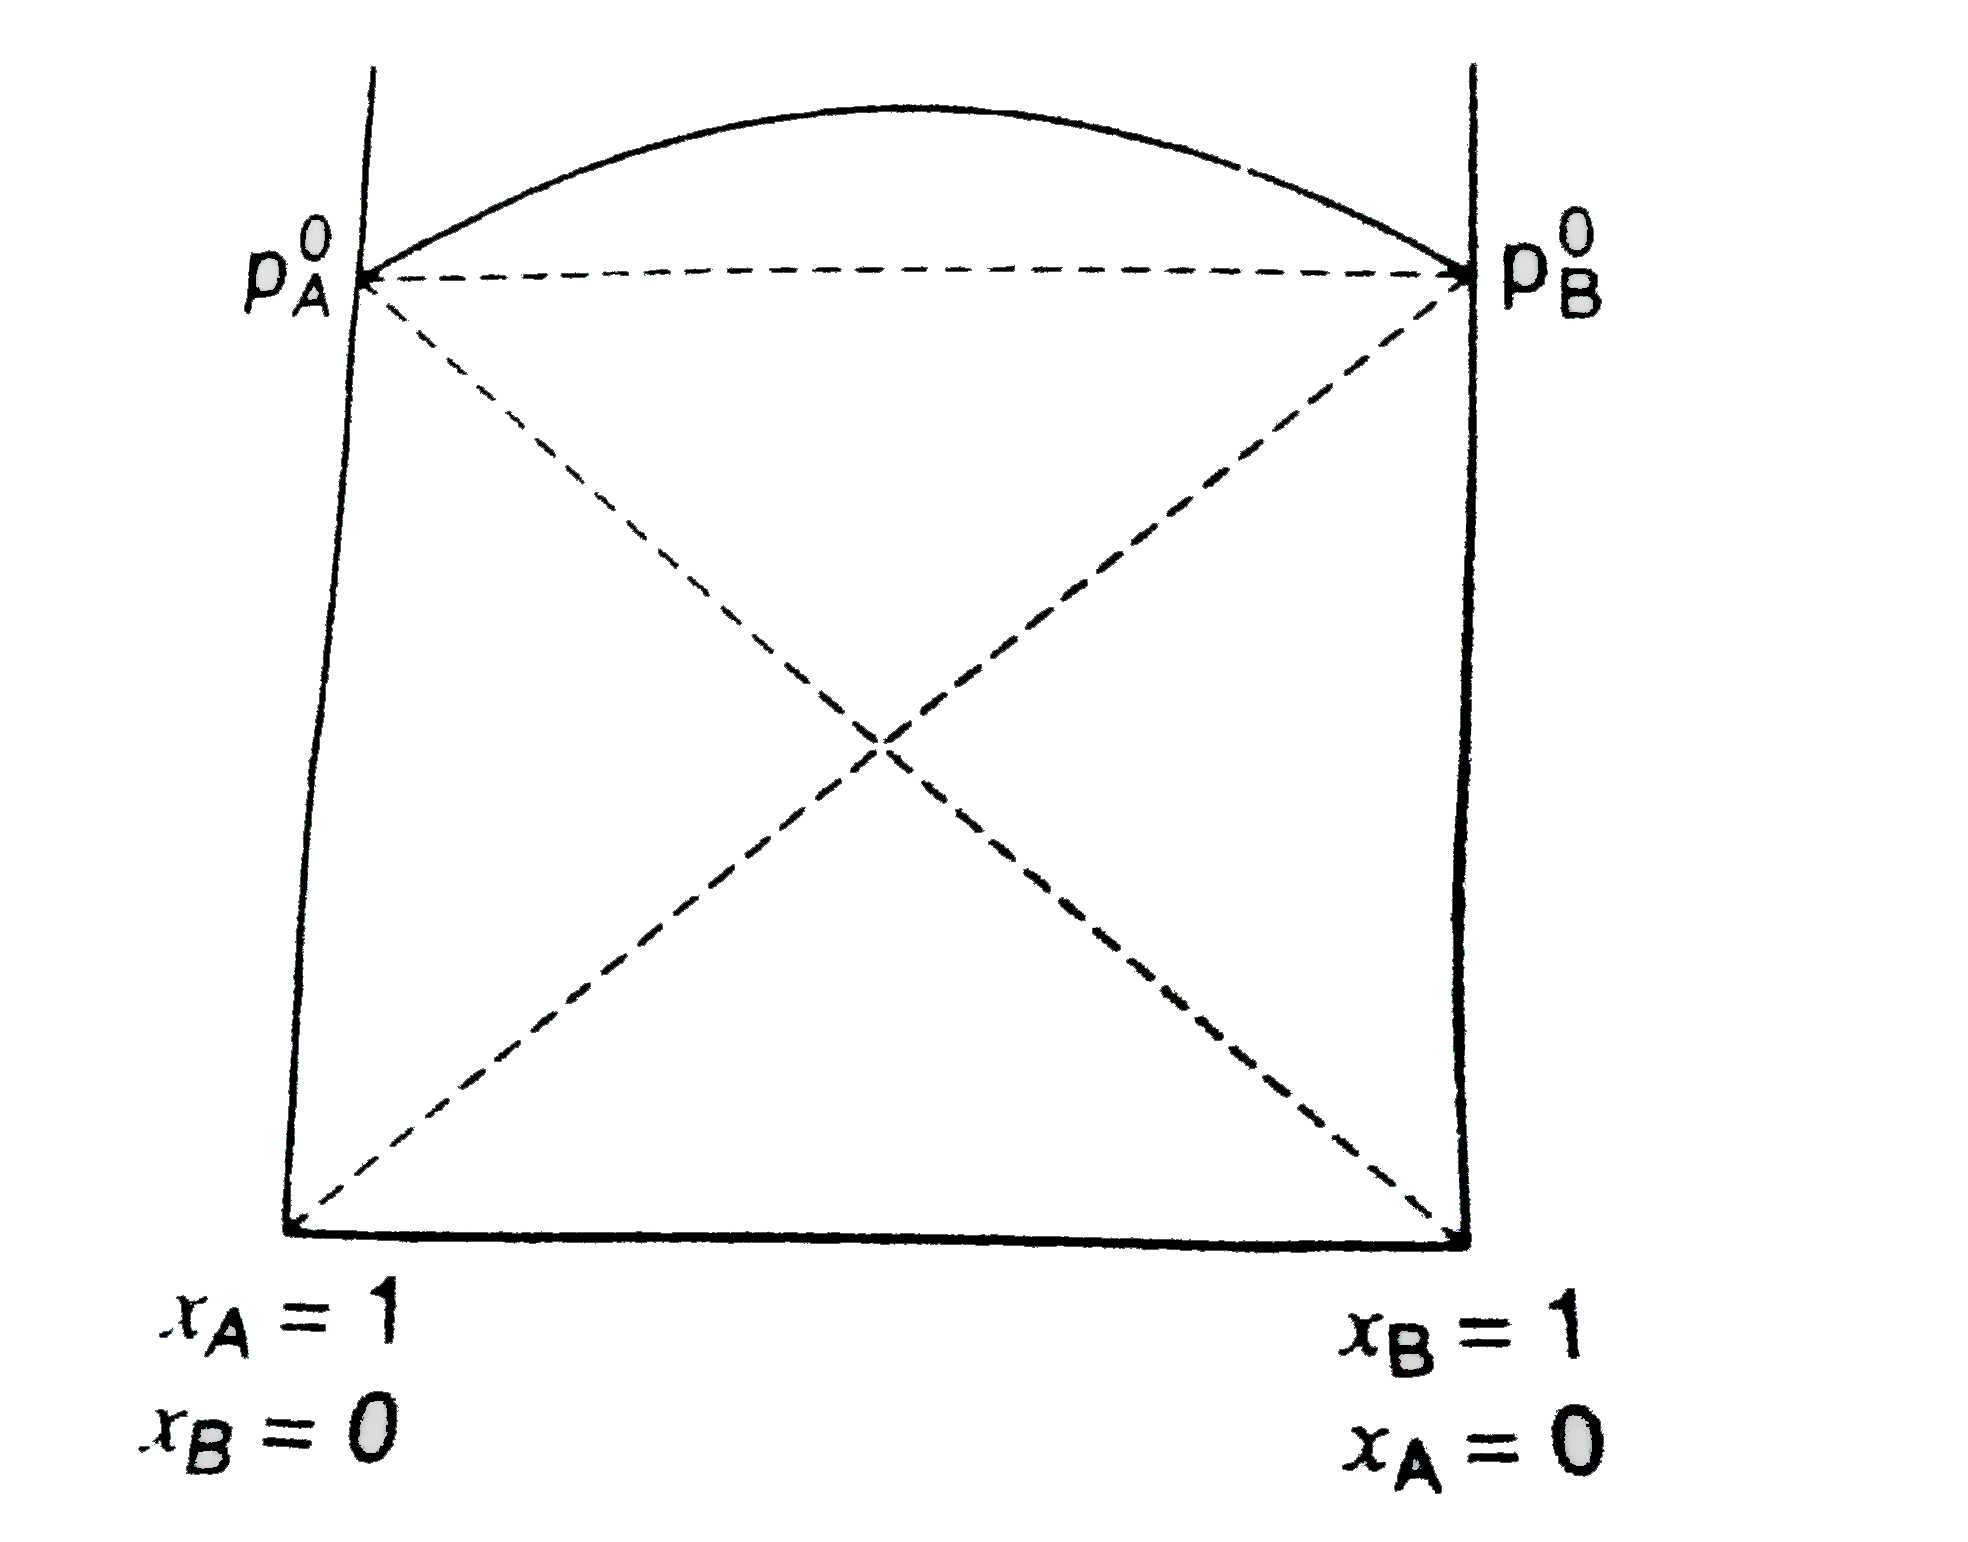 A(+) deviationB(-) deviationCno deviationDnone of these
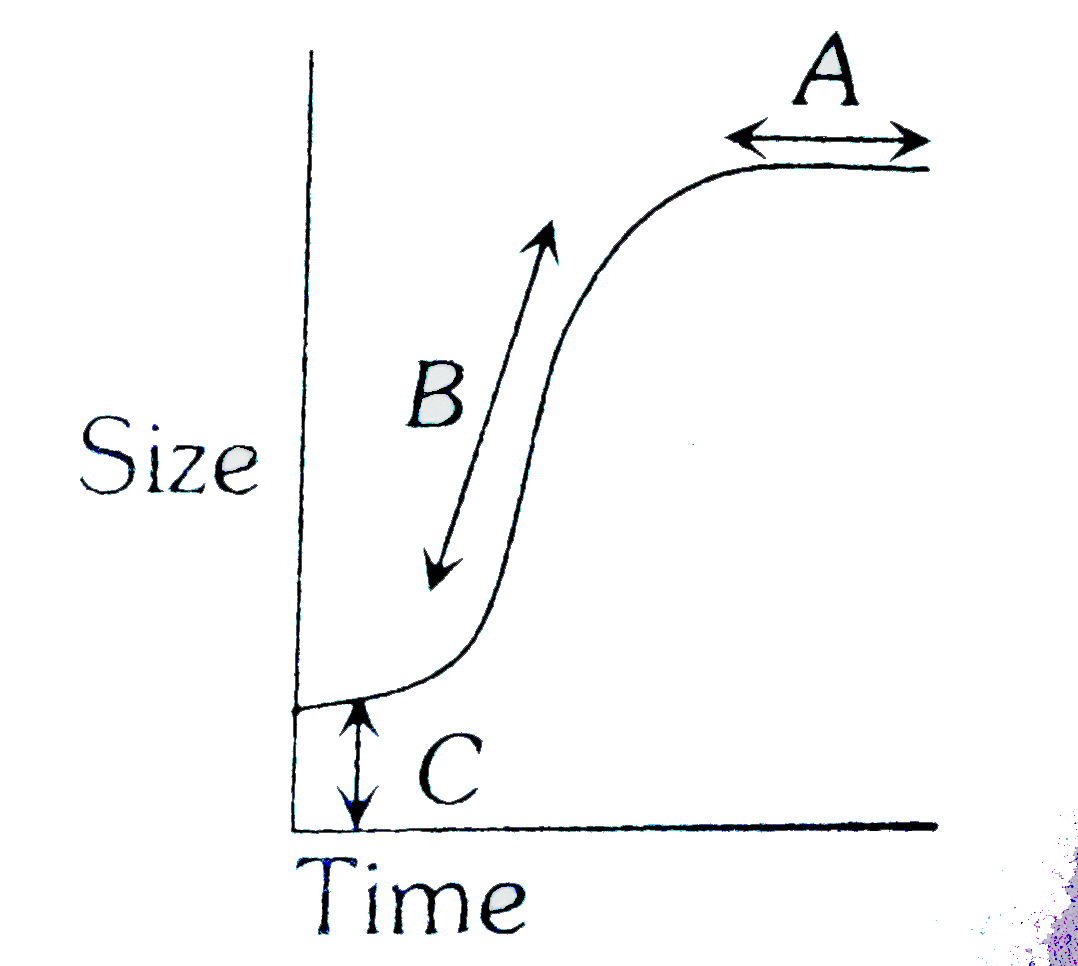
Given below is a graph drawn on the parameters of growth versus time A,B and C respectively represent.
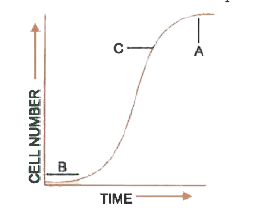 AExponential phase, lag phase nd steady state phaseBSteady state phase, lag phase and log phaseCSlow growing phase, lag phase and steady state phaseDLag phase, steady state phase and log phase
Given below is a graph drawn on the parameters of growth versus time A,B and C respectively represent.
 AExponential phase, log phase and steady state phaseBSteady state phase, lag phase and log phaseCLog phase, steady state phase and logarithmic phaseDLog phase, lag phase and steady state phase
Column I gives a list of possible set of parameters measured in some expreriments. The variations of the parameers in the form of graphs are shown in Column II. Match the set of parameters given in Column I with the graphs given in Column II.
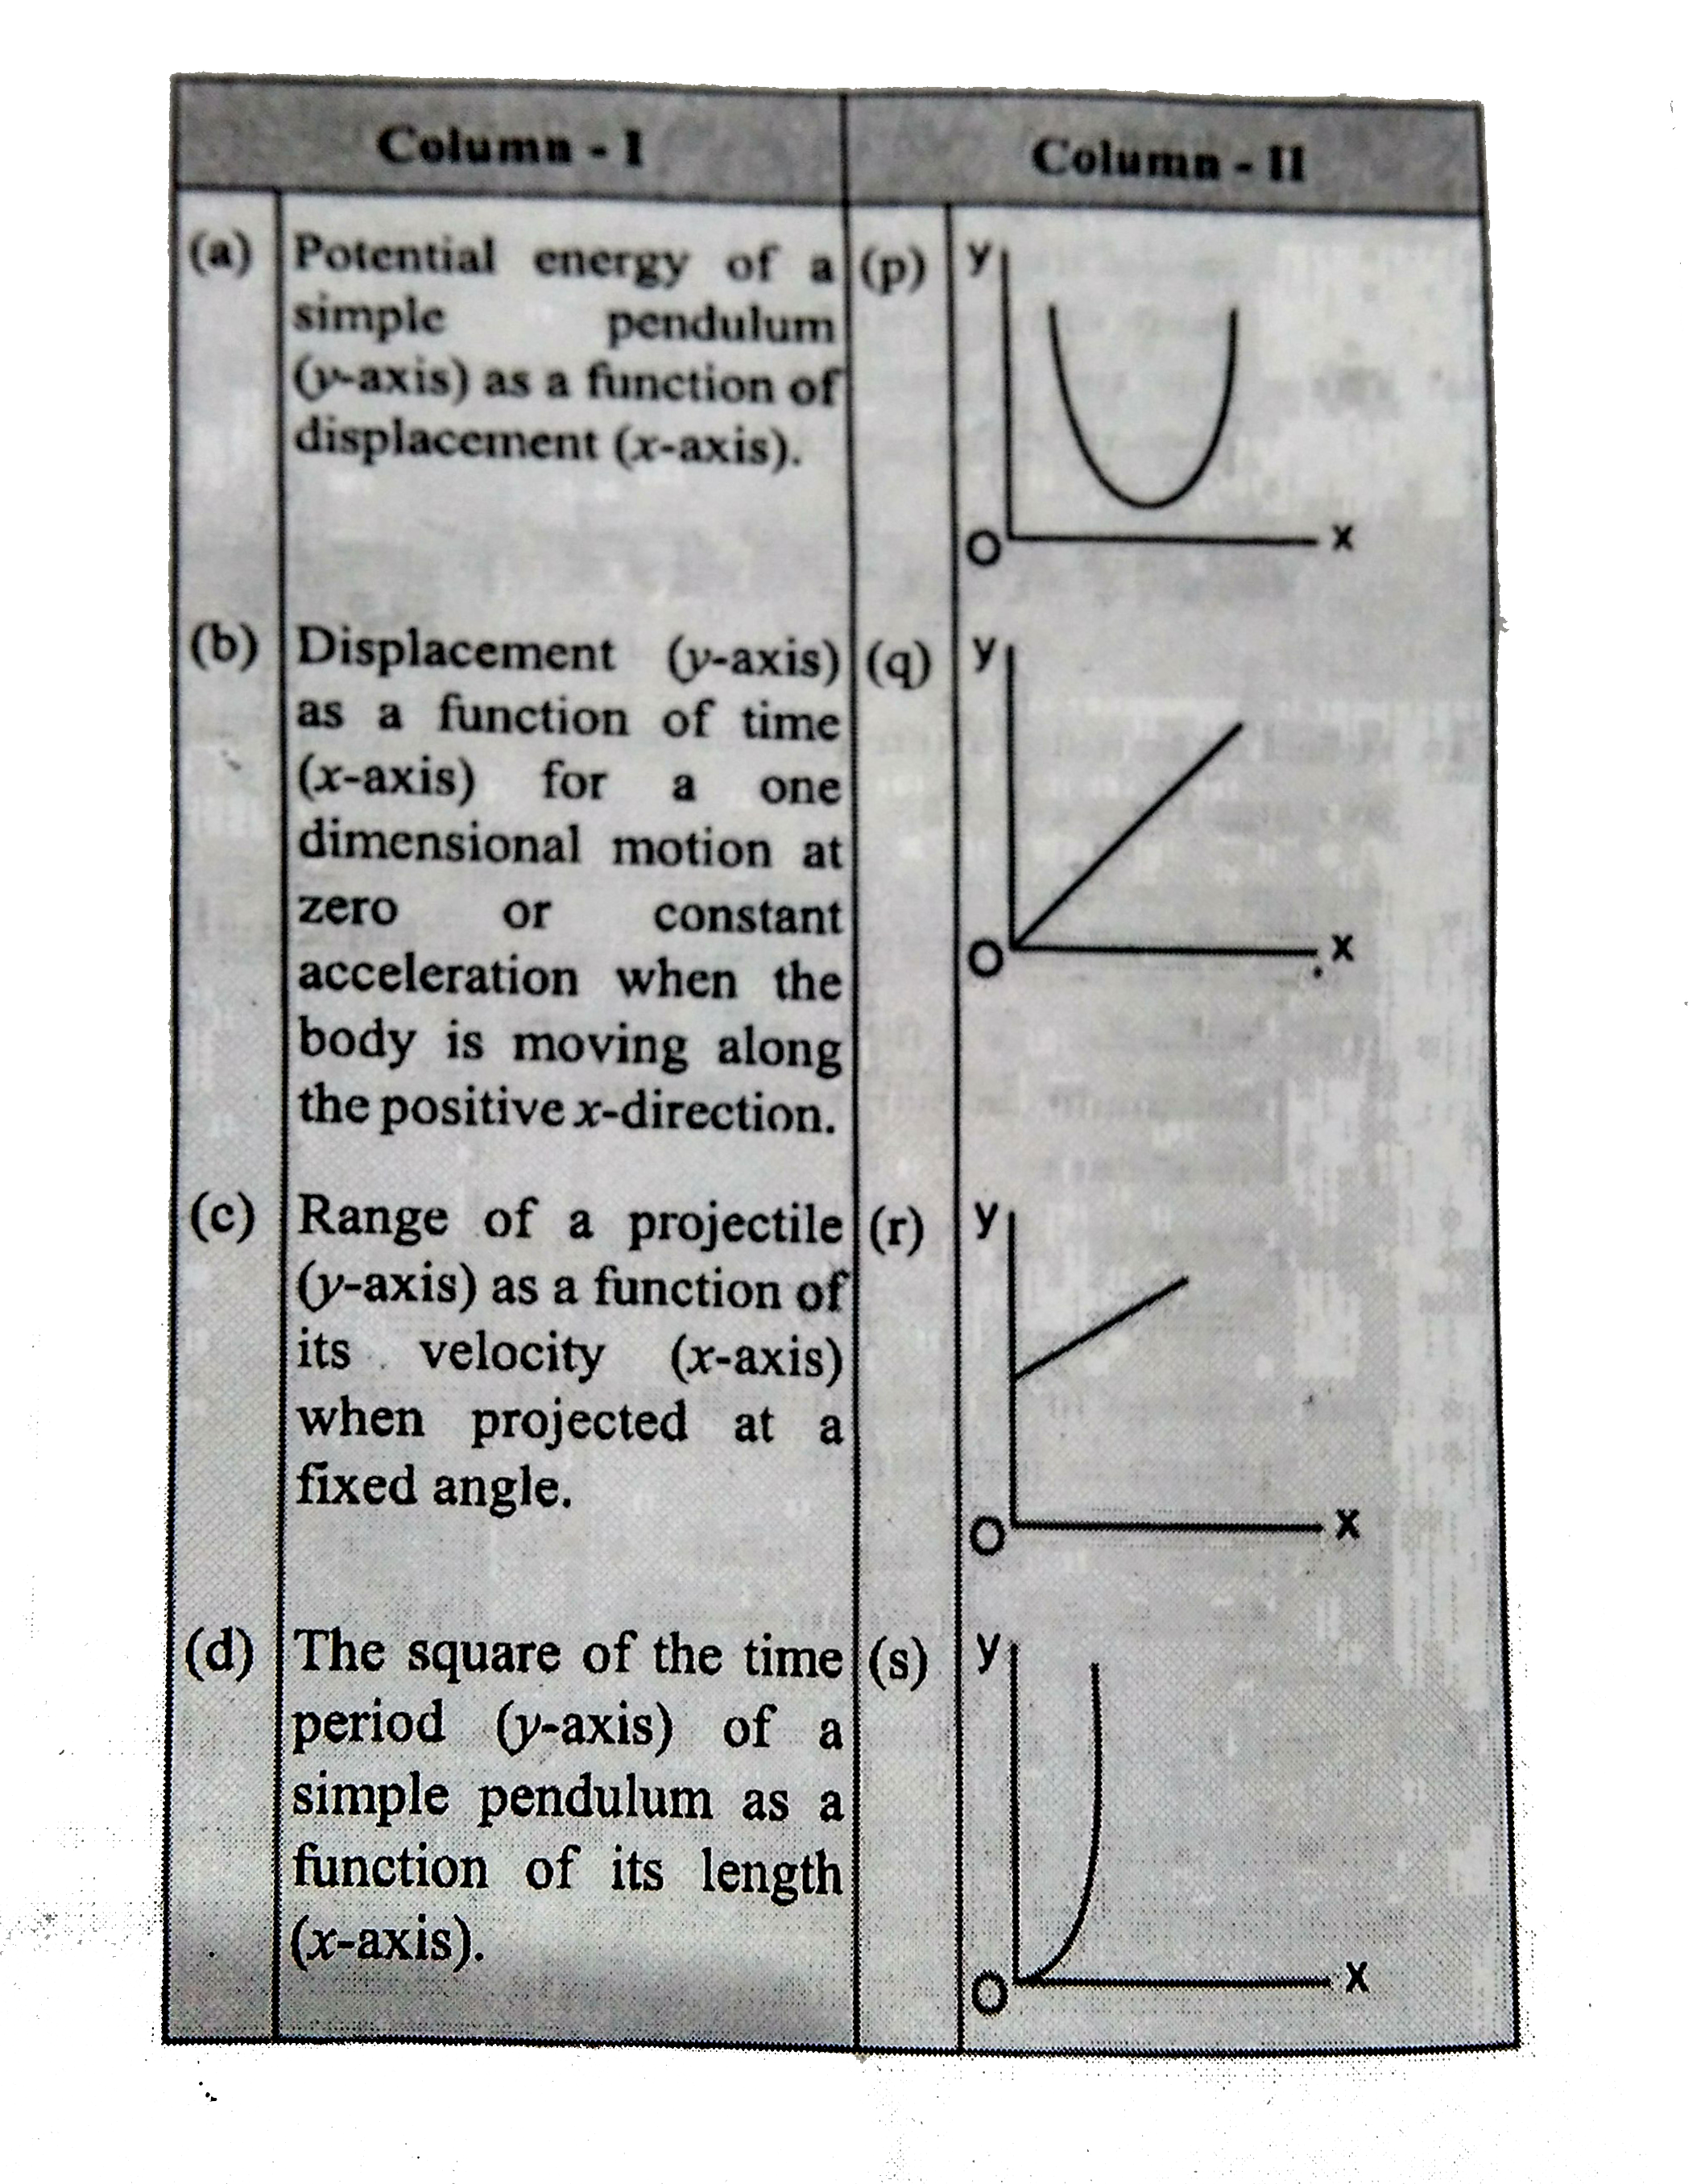
View SolutionColumn I gives a list of possible set of parameters measured in some expermients. The varitions of the parameters in the form of graphs ar shown in Column II. Match the set of parameters given Column I with the graph given in Column II. Indicate your answer by darking the appropriate bubbles of the 4×4 matrix given in the ORS.
_E01_169_Q01.png)
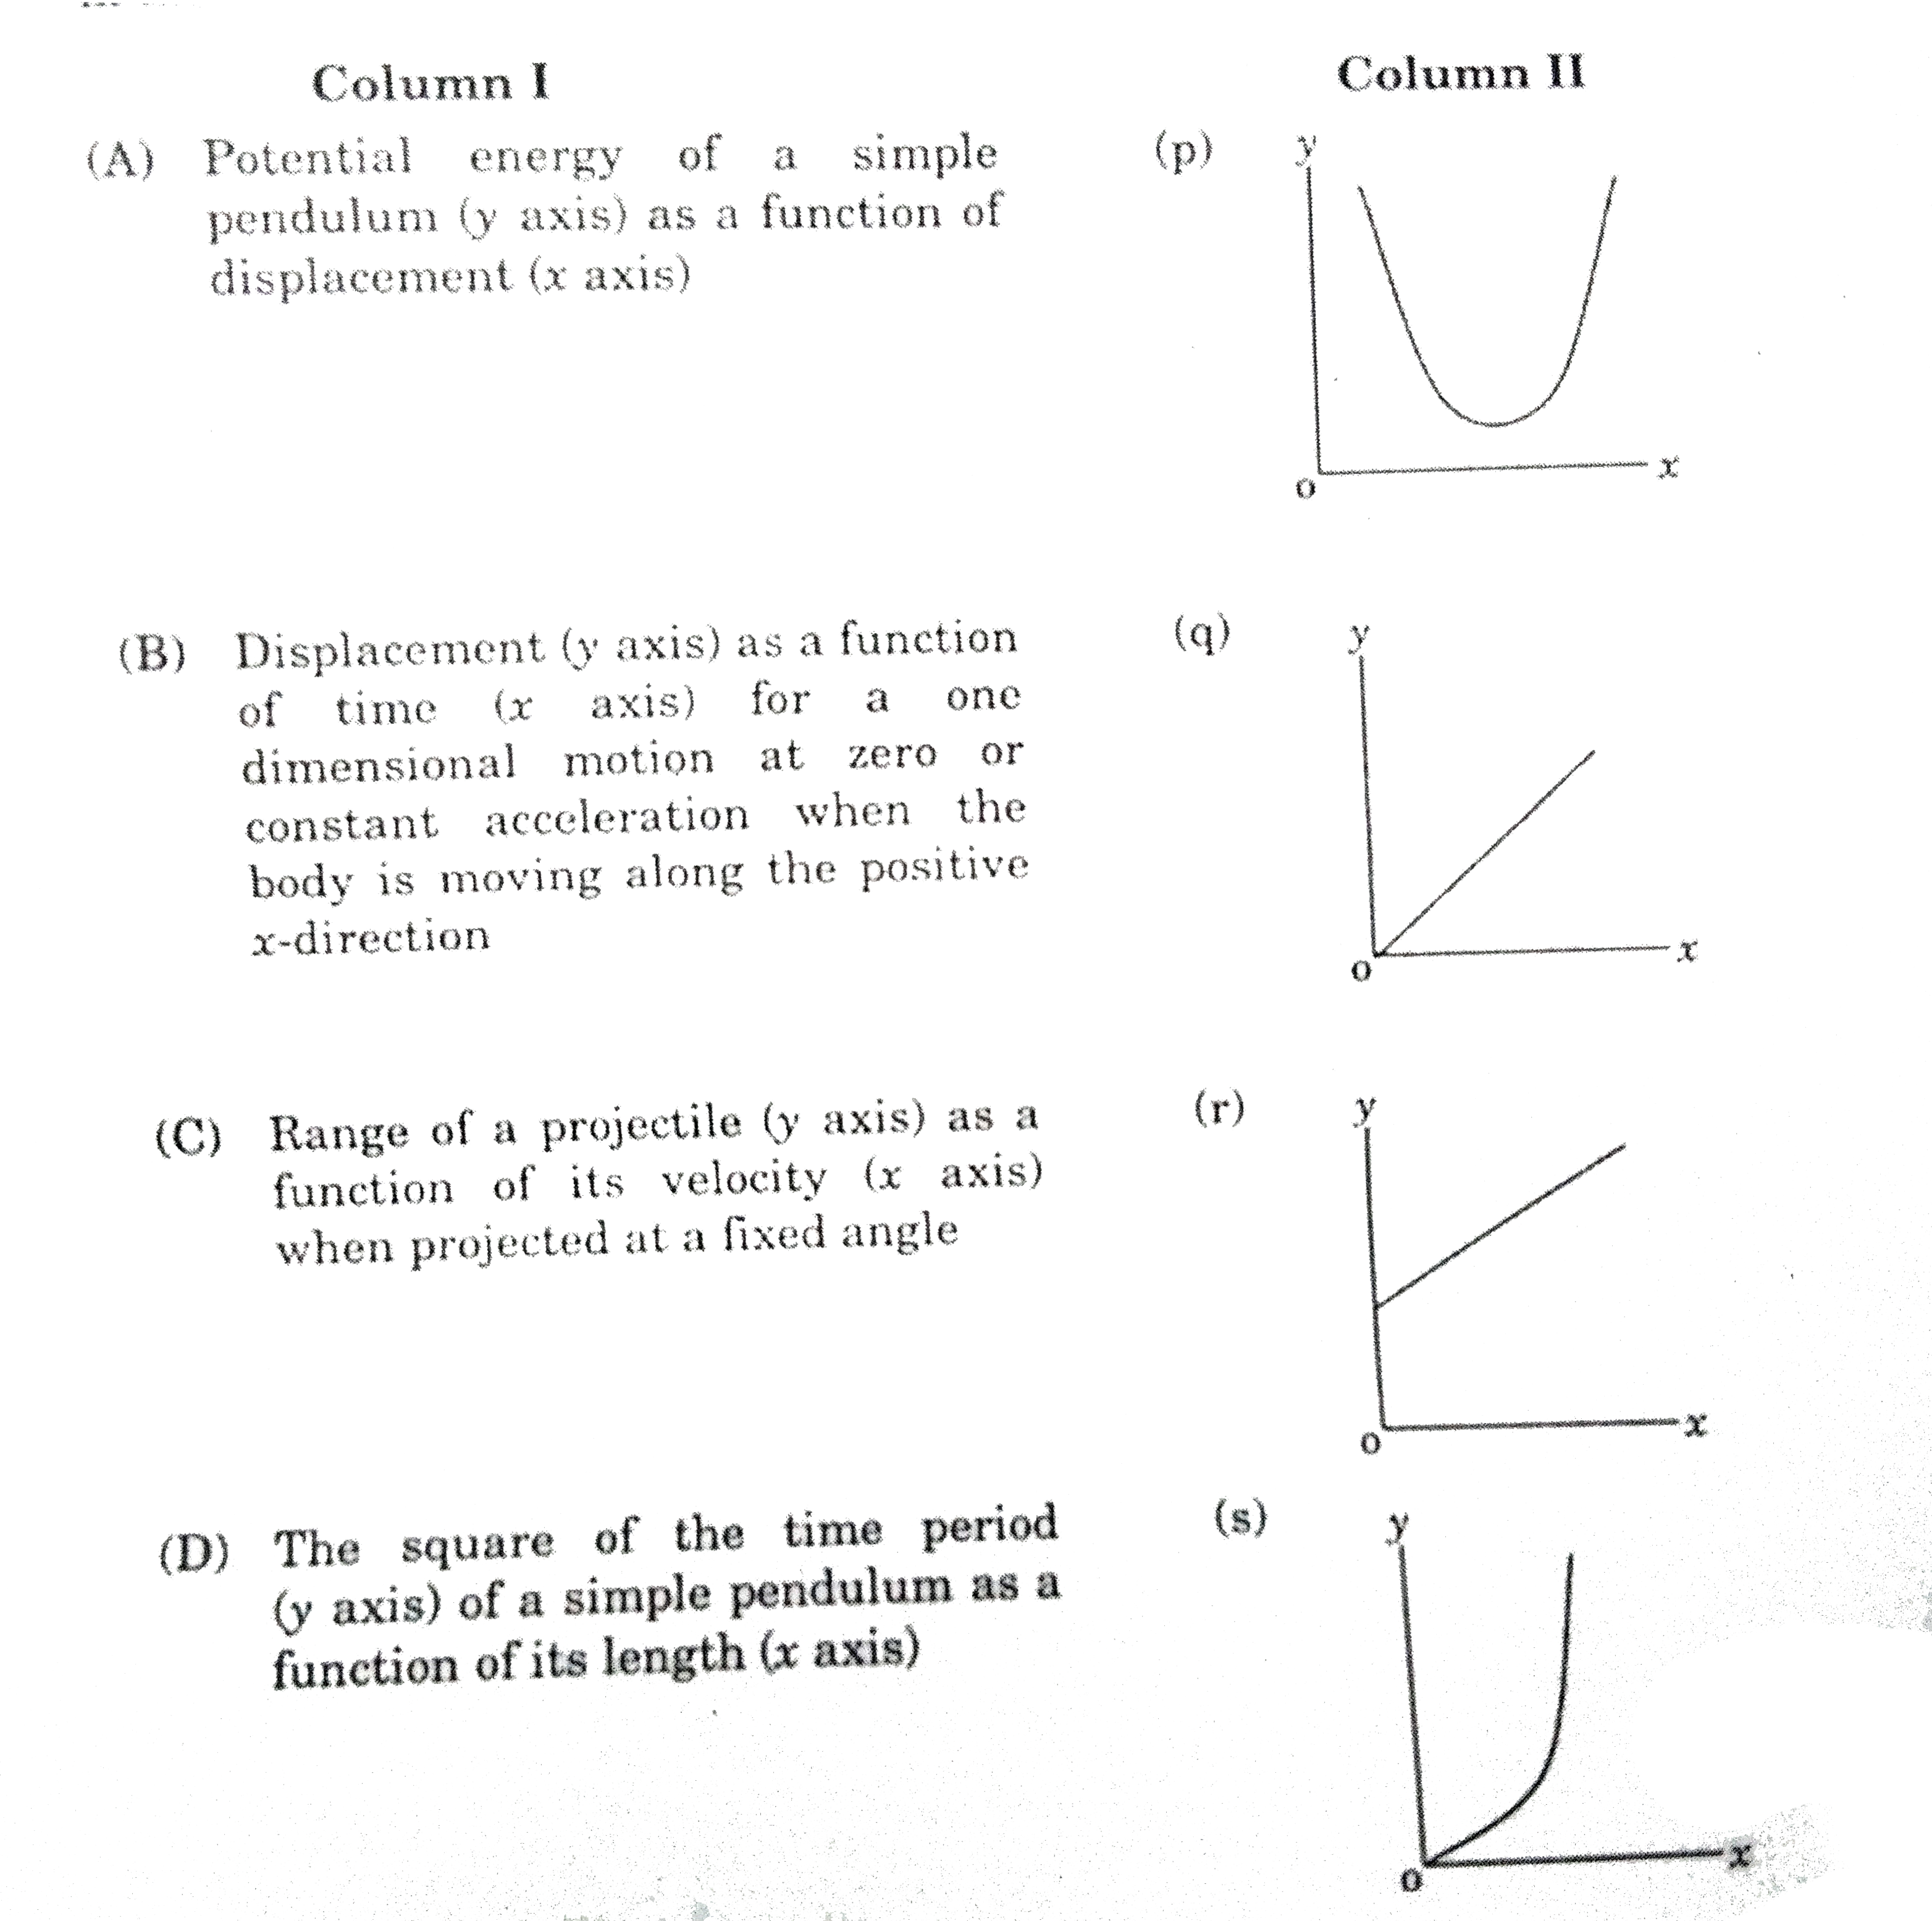
View SolutionColumn I gives a listof possible set of parameters measured in some experiments. The variations of the parameters in the form of graphs are shown in Column II. Match the set of parameters given in Column I with the graphs even in Column II. Indicate your answer by darkening the appropriate bubbles of the 4×4 matrix given in the ORS.
View SolutionMake a line graph for the area of a square as per the given table.

Is it a linear graph?
View SolutionGiven below is a graph on the parametes of growth versus time A,B , C respectively represent
View Solution


 .
.