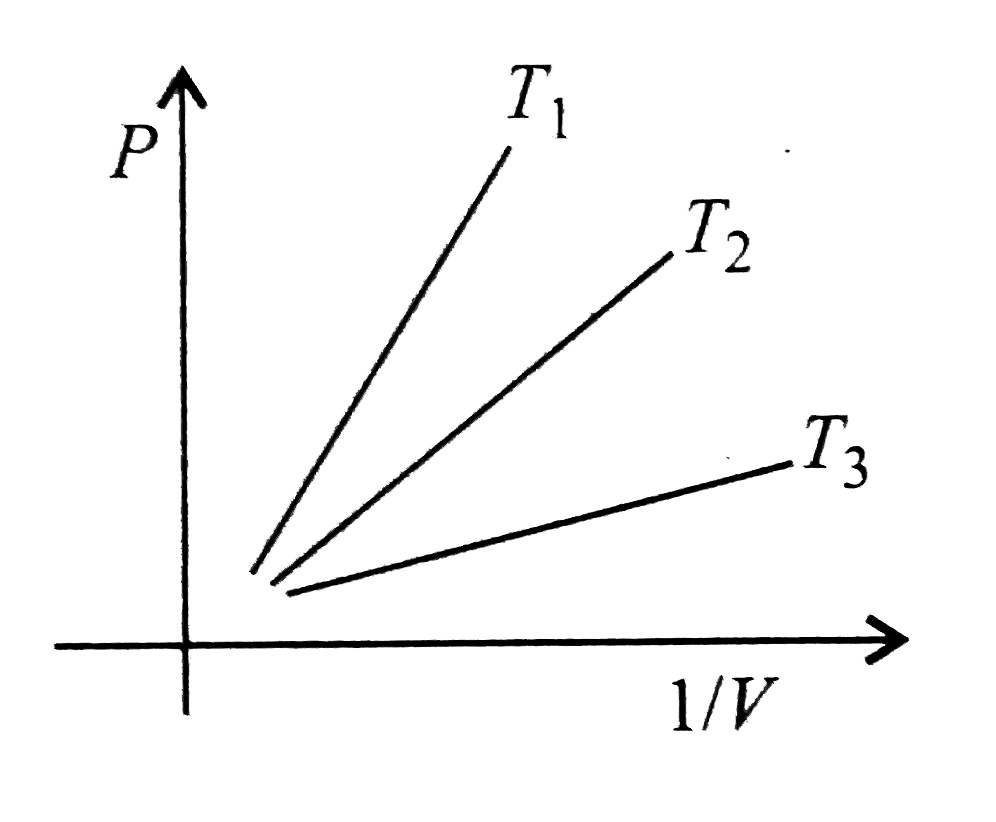
The curve drawn below shows the variations of P as a function of 1/V for a fixed mass and temperature of an ideal gas. It follows from the curve that:
A
T3>T2>T1
B
T1>T2>T3
C
T1=T2=T3
D
Nothing can be predicted about temperatures
Video Solution
Text Solution
For ideal gas PV=nRT
or P=nRTV
Therefore, the slope increases with temperature.
|
Topper's Solved these Questions
- STATES OF MATTERBOOK - CENGAGE CHEMISTRYCHAPTER - STATES OF MATTEREXERCISE - Exercises
21 Videos
- STATES OF MATTERBOOK - CENGAGE CHEMISTRYCHAPTER - STATES OF MATTEREXERCISE - Exercises (Linked Comprehensive)
48 Videos
- SOME BASIC CONCEPTS AND MOLE CONCEPTBOOK - CENGAGE CHEMISTRYCHAPTER - SOME BASIC CONCEPTS AND MOLE CONCEPTEXERCISE - Archives Subjective
11 Videos
- STOICHIOMETRYBOOK - CENGAGE CHEMISTRYCHAPTER - STOICHIOMETRYEXERCISE - Archives Subjective
33 Videos
Similar Questions
Knowledge Check
The given curve represents the variation of temperatue as a function of volume for one mole of an ideal gas. Which of the following curves best represents the variation of pressure as a function of volume ?
(##DCP_V03_C20_E01_099_Q01##).A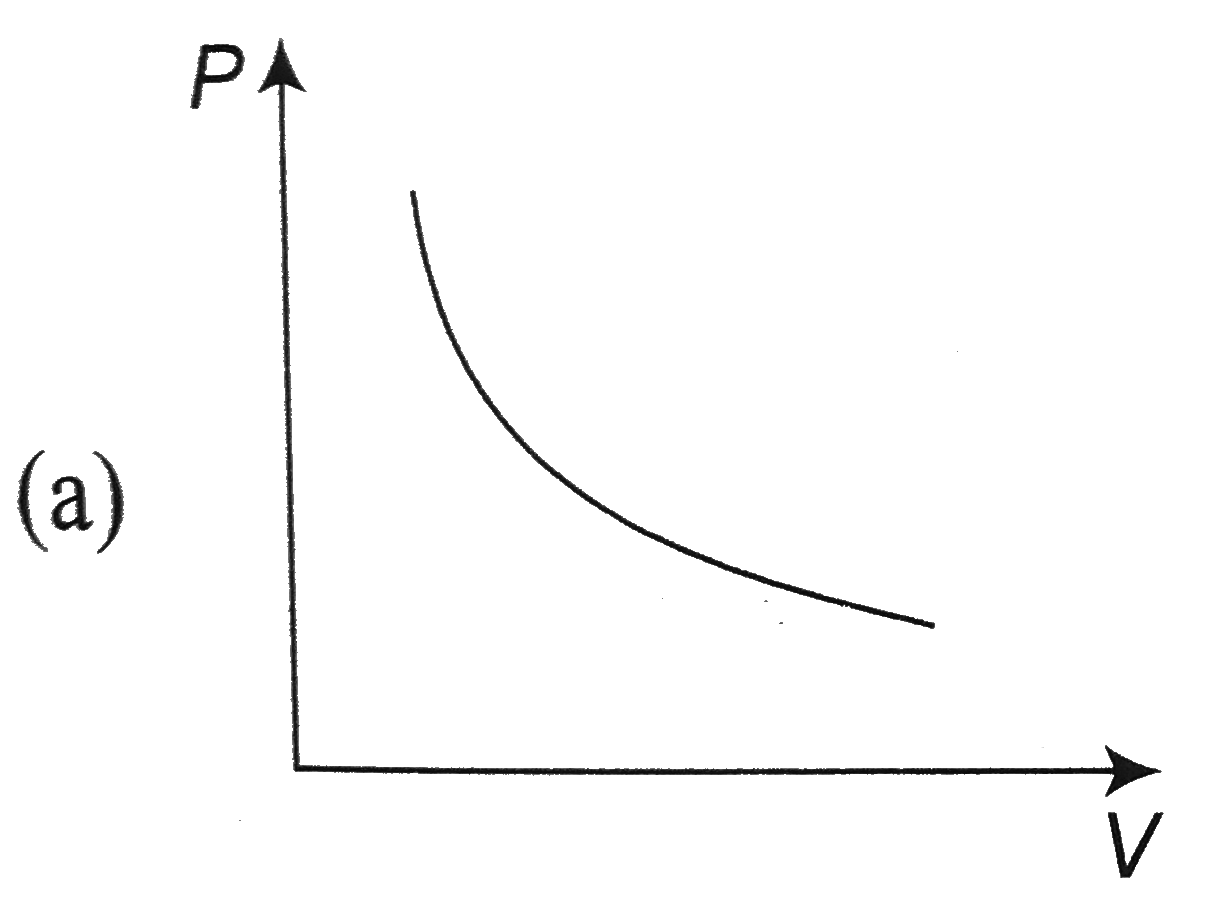 B
B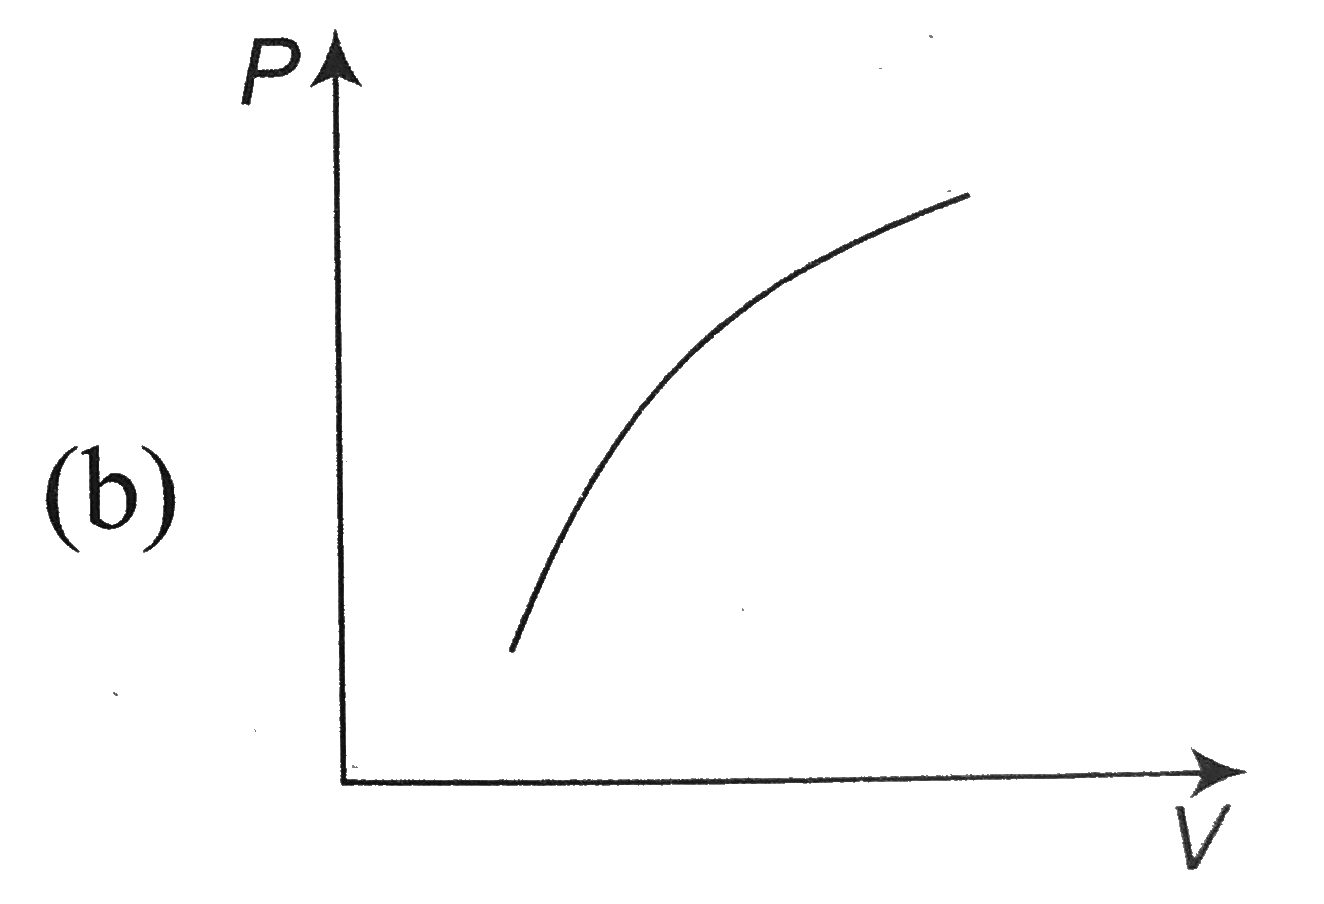 C
C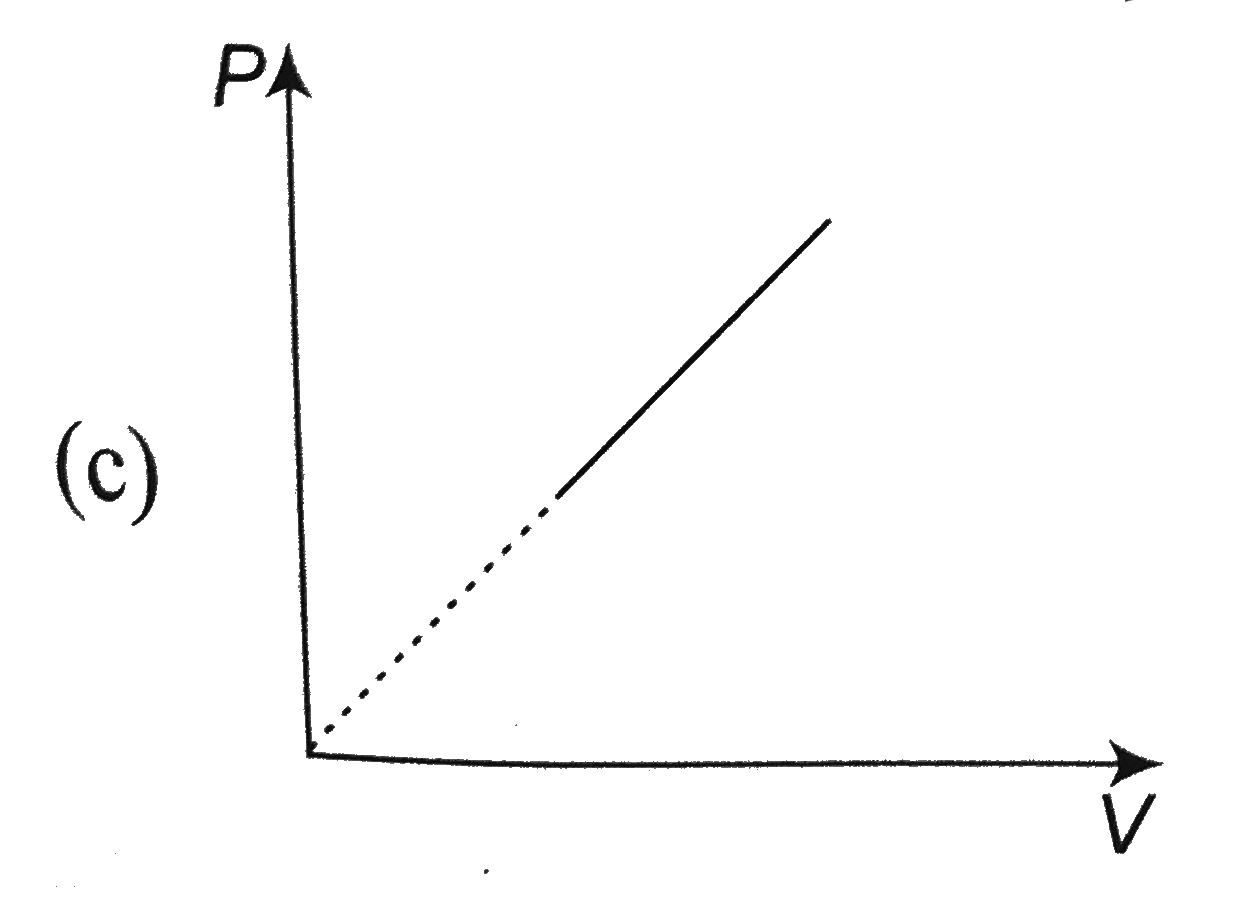 D
D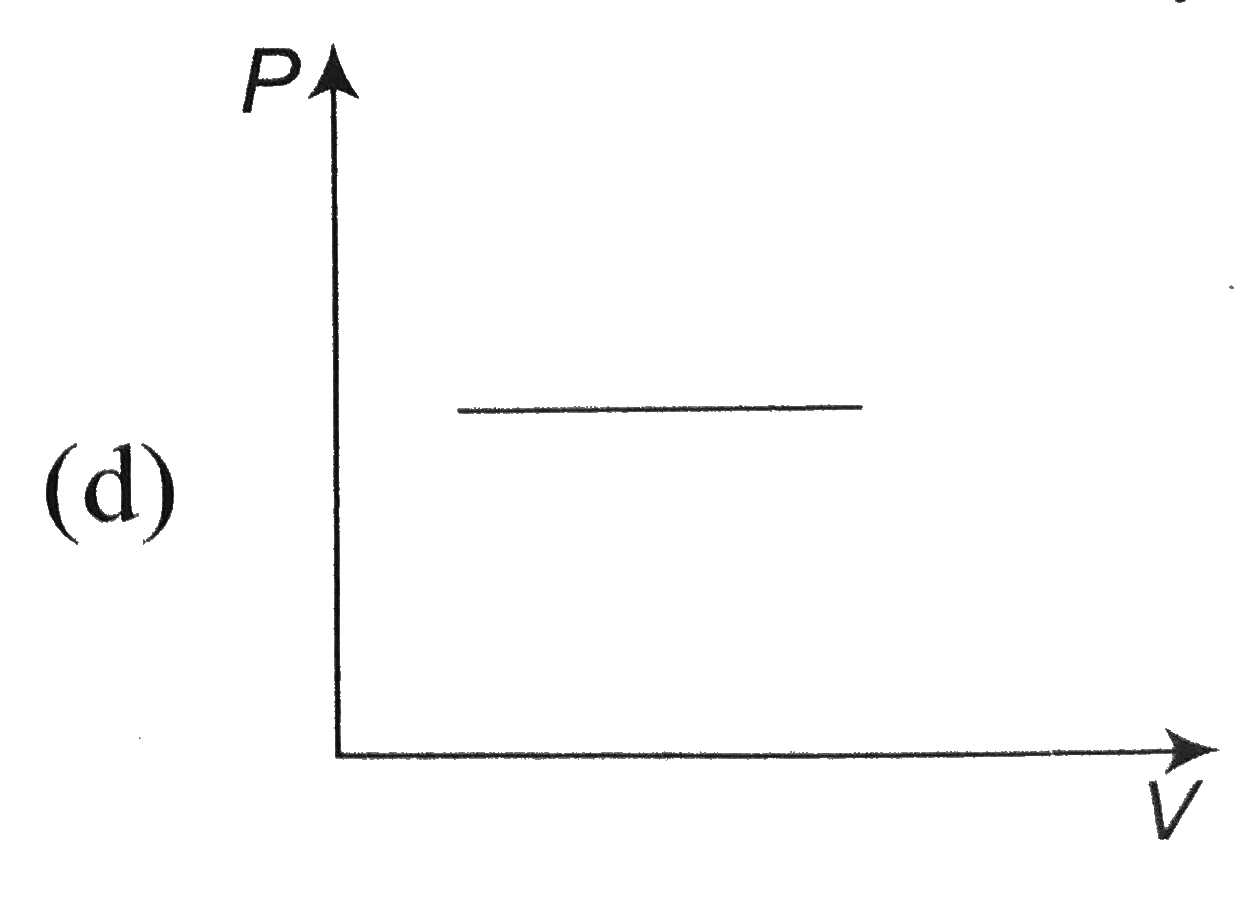
The variation of PV with V of fixed mass of an ideal gas at constant temperature is graphically represented by the curve
A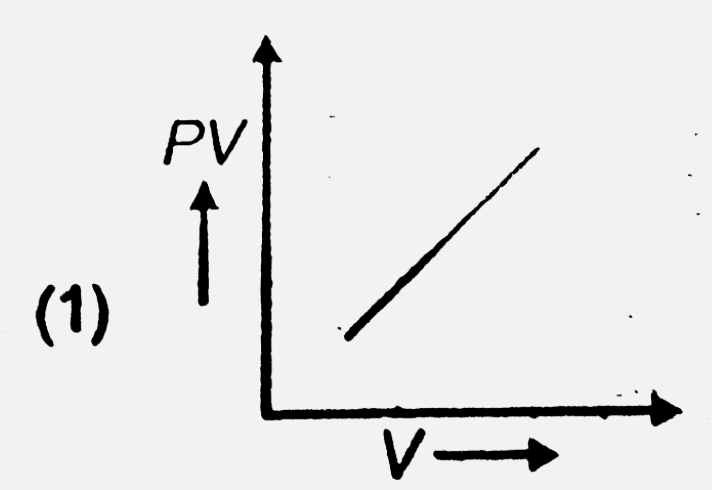 B
B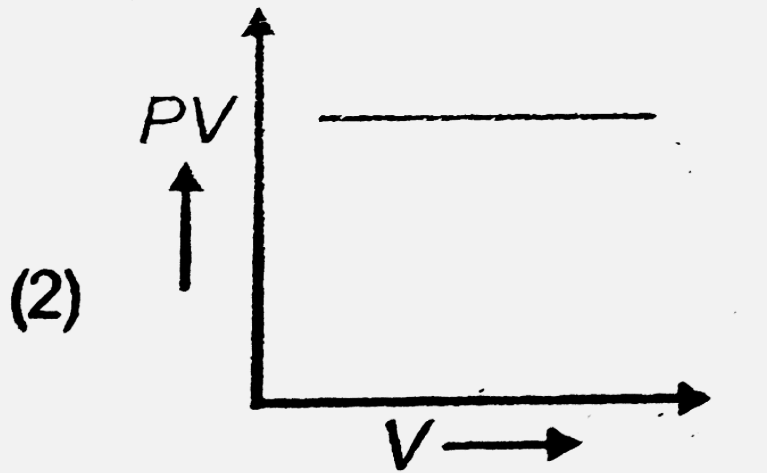 C
C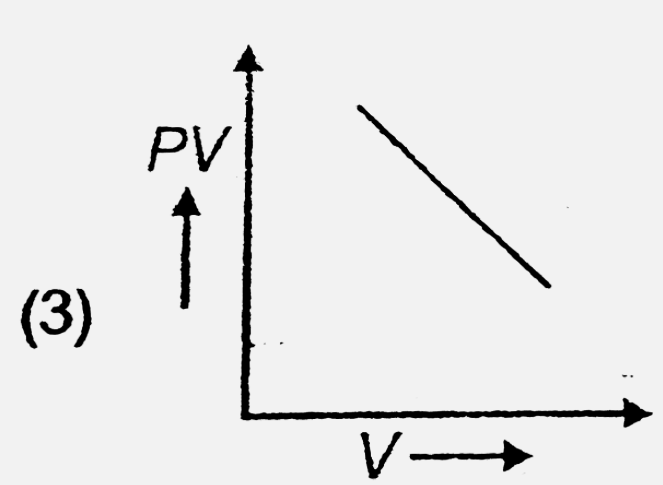 D
D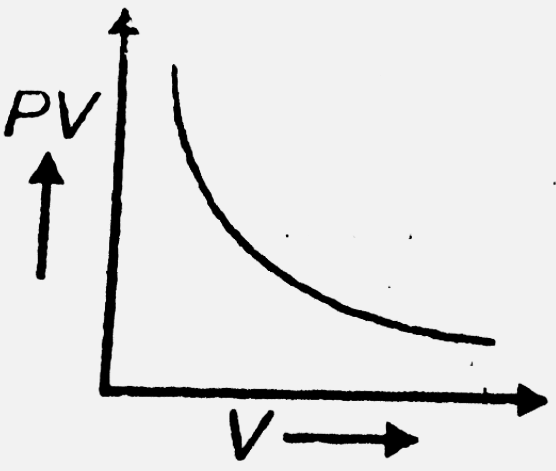
The curve showing the variation of adorpton with pressure at constant temperature is called :
Aan isosthermBadsorpton isothermCabsorption isothermDall of these
For fixed mass of an ideal gas a constant temperature. Which is correct graph ?
View SolutionThe following curve represnets the variation of Gibbs function 'G' with pressure at constant temperature.
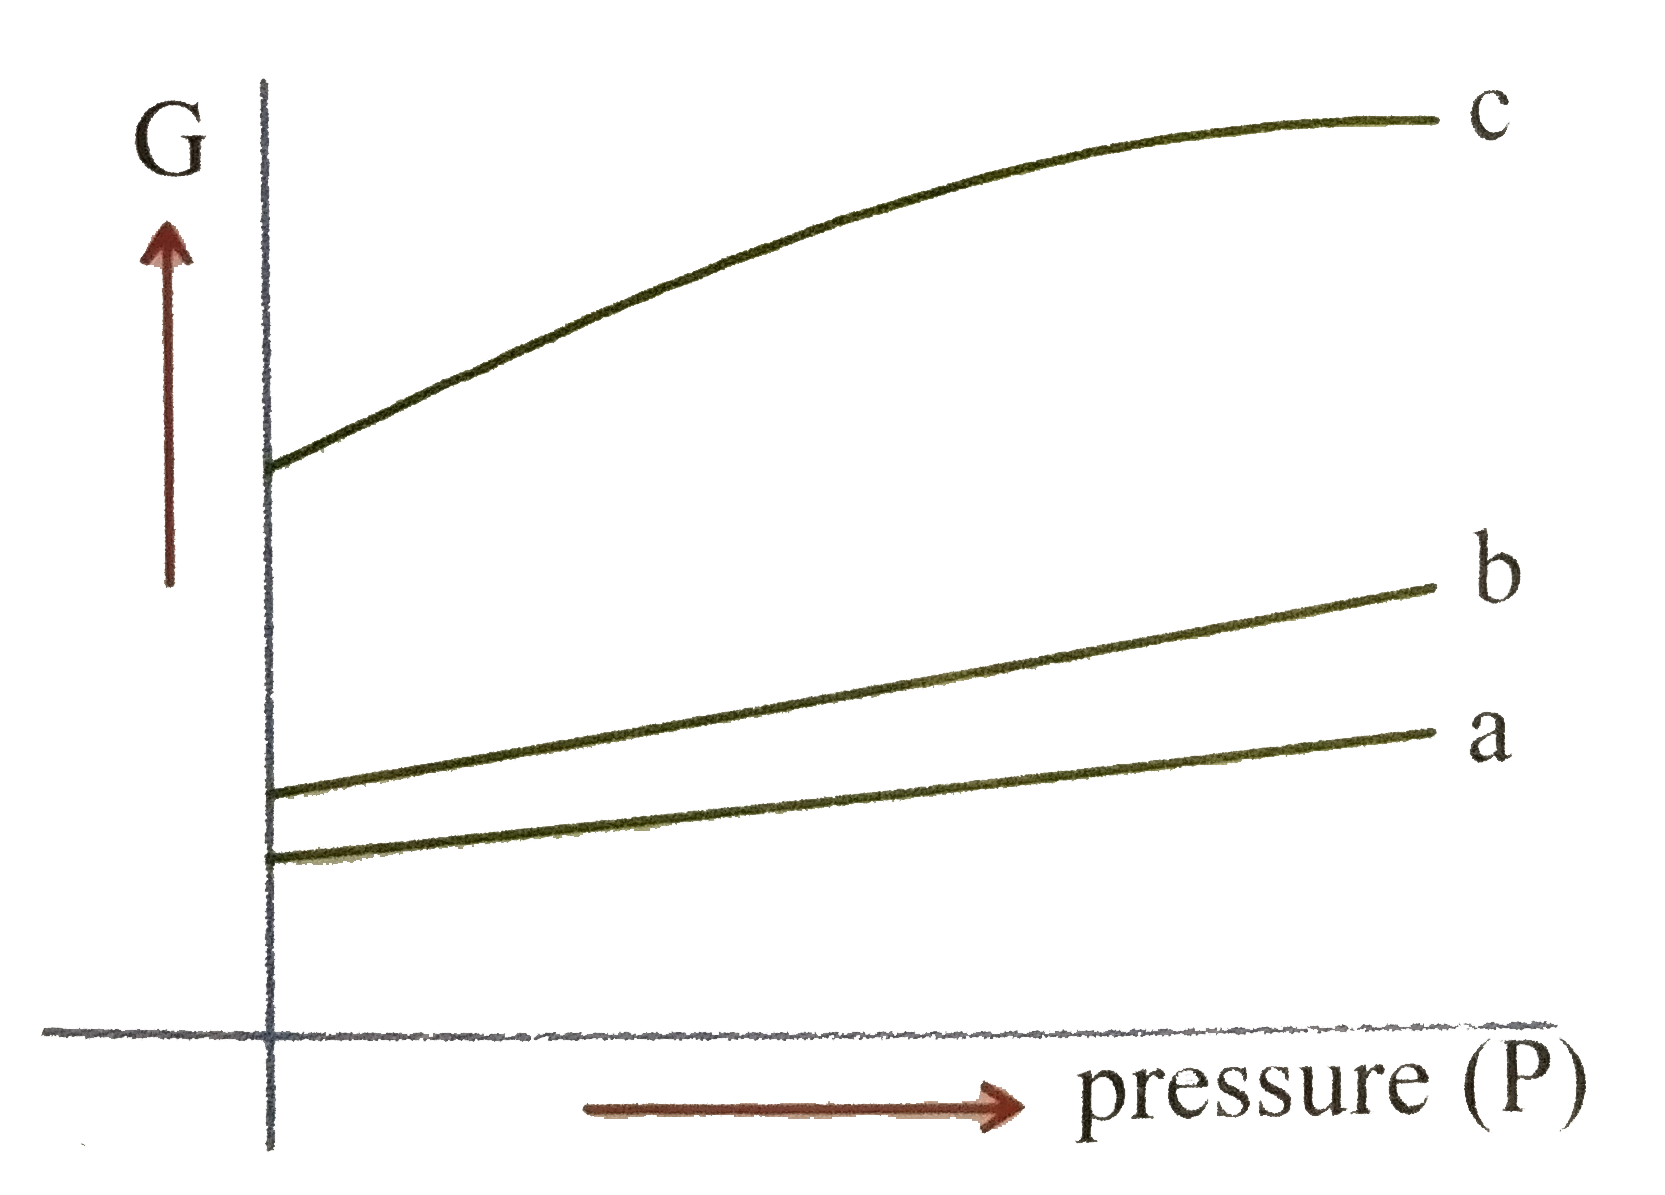
Correct match of given plots with the physical state of a substance is
View SolutionThe curve showing the variation of pressure with temperature for a given amount of adsoption is called
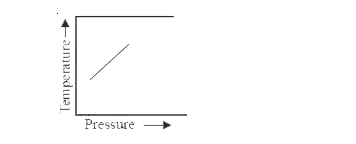
View SolutionThe curve showing the variation of pressure with temperature for a given amount of adsorption is called
View SolutionFor fixed amount of an ideal gas taken at constnat temperature V vs 1p2 is :
View Solution

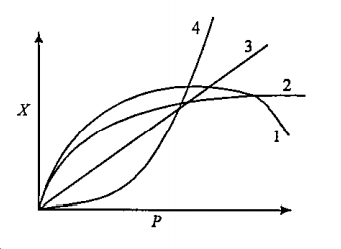 is
is