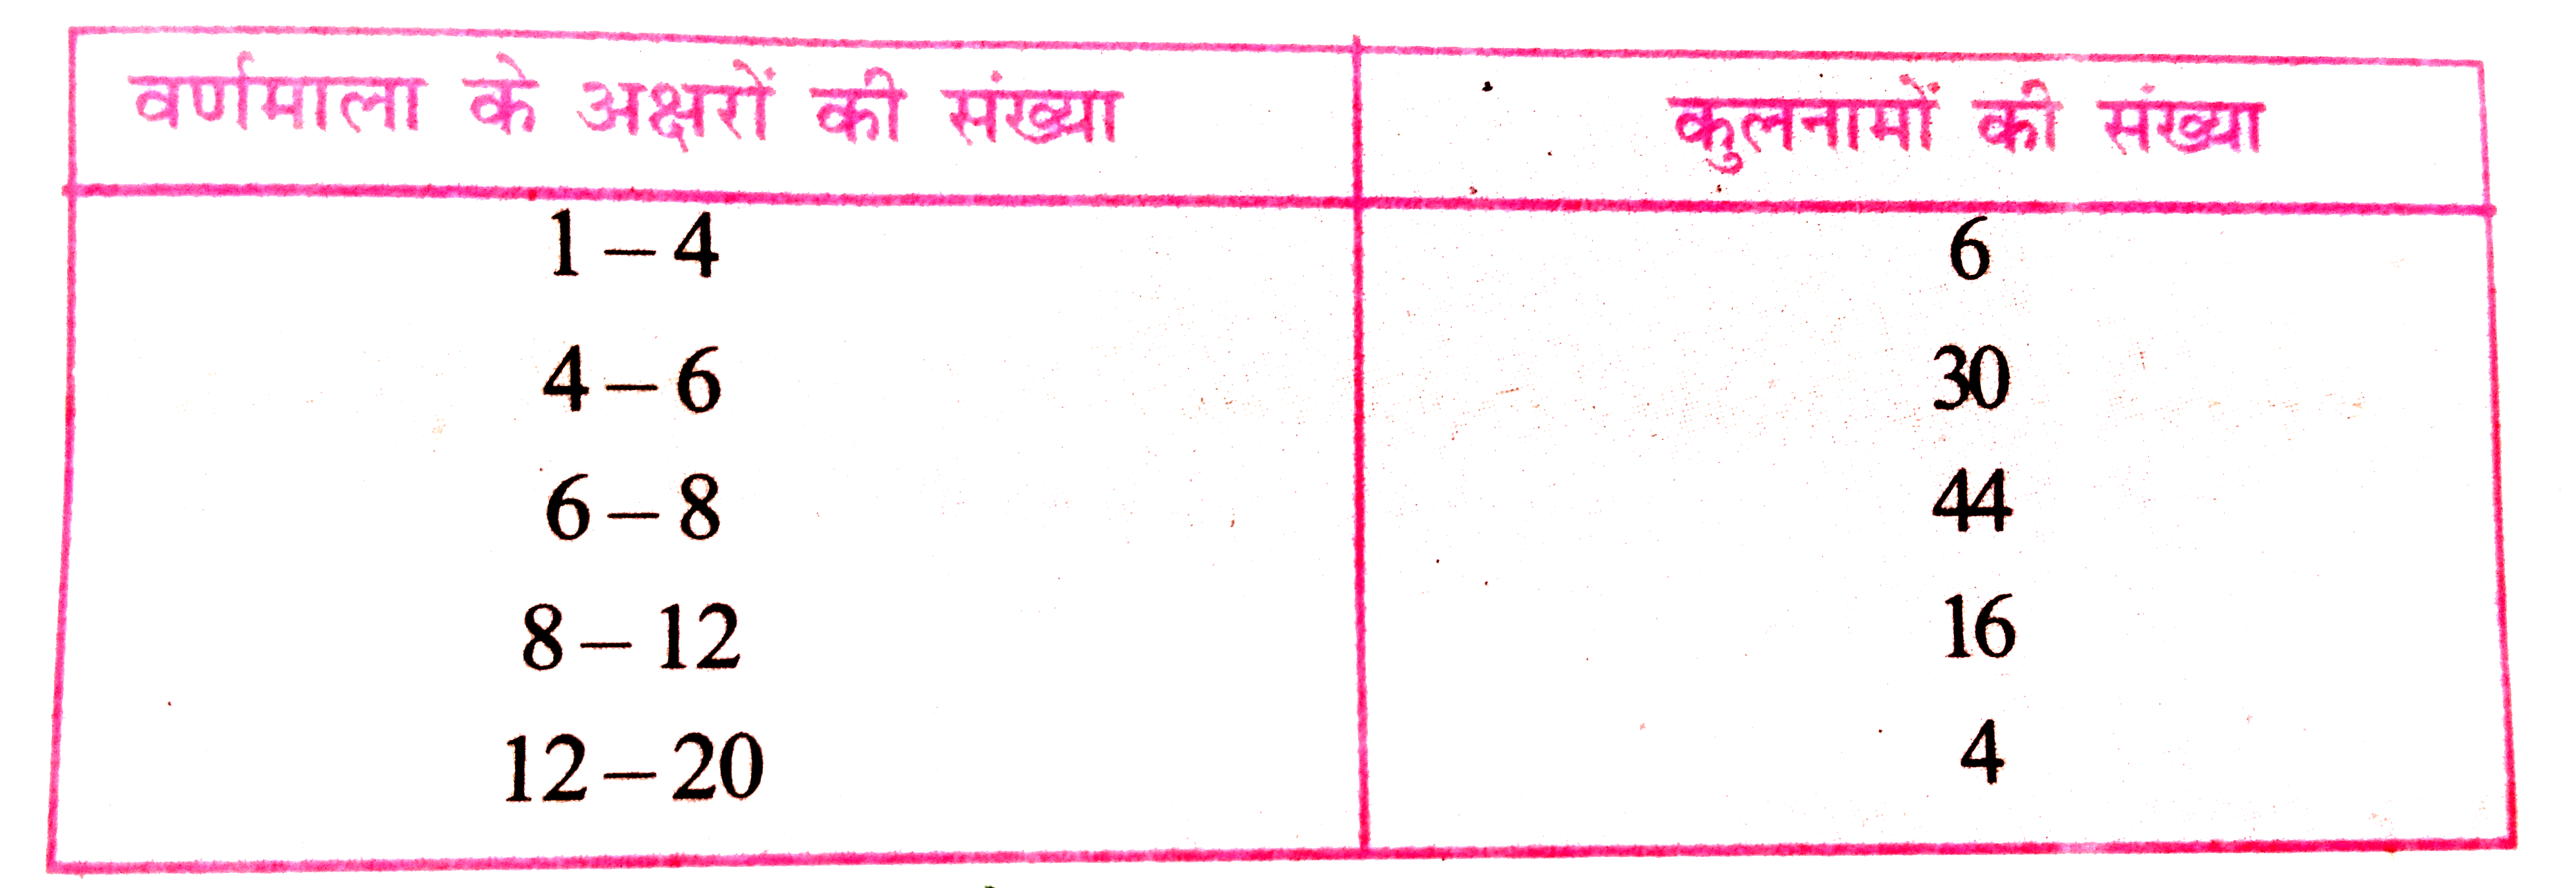
एक स्थानीय टेलीफोन निर्देशांक से कुलनाम () यद्रिछाया लिया गया और उनसे अंग्रेजी वर्णमाला के अक्षरों की संख्या का निम्न बारंबारता बंटन प्राप्त किया गया :

(i) दी हुई सूचनाओं को निरूपित करने वाला एक आयतचित्र खींचिए।
(ii) वह वर्ग अंतराल बताइए जिसम अधिकमत संख्या के कुलनाम है।
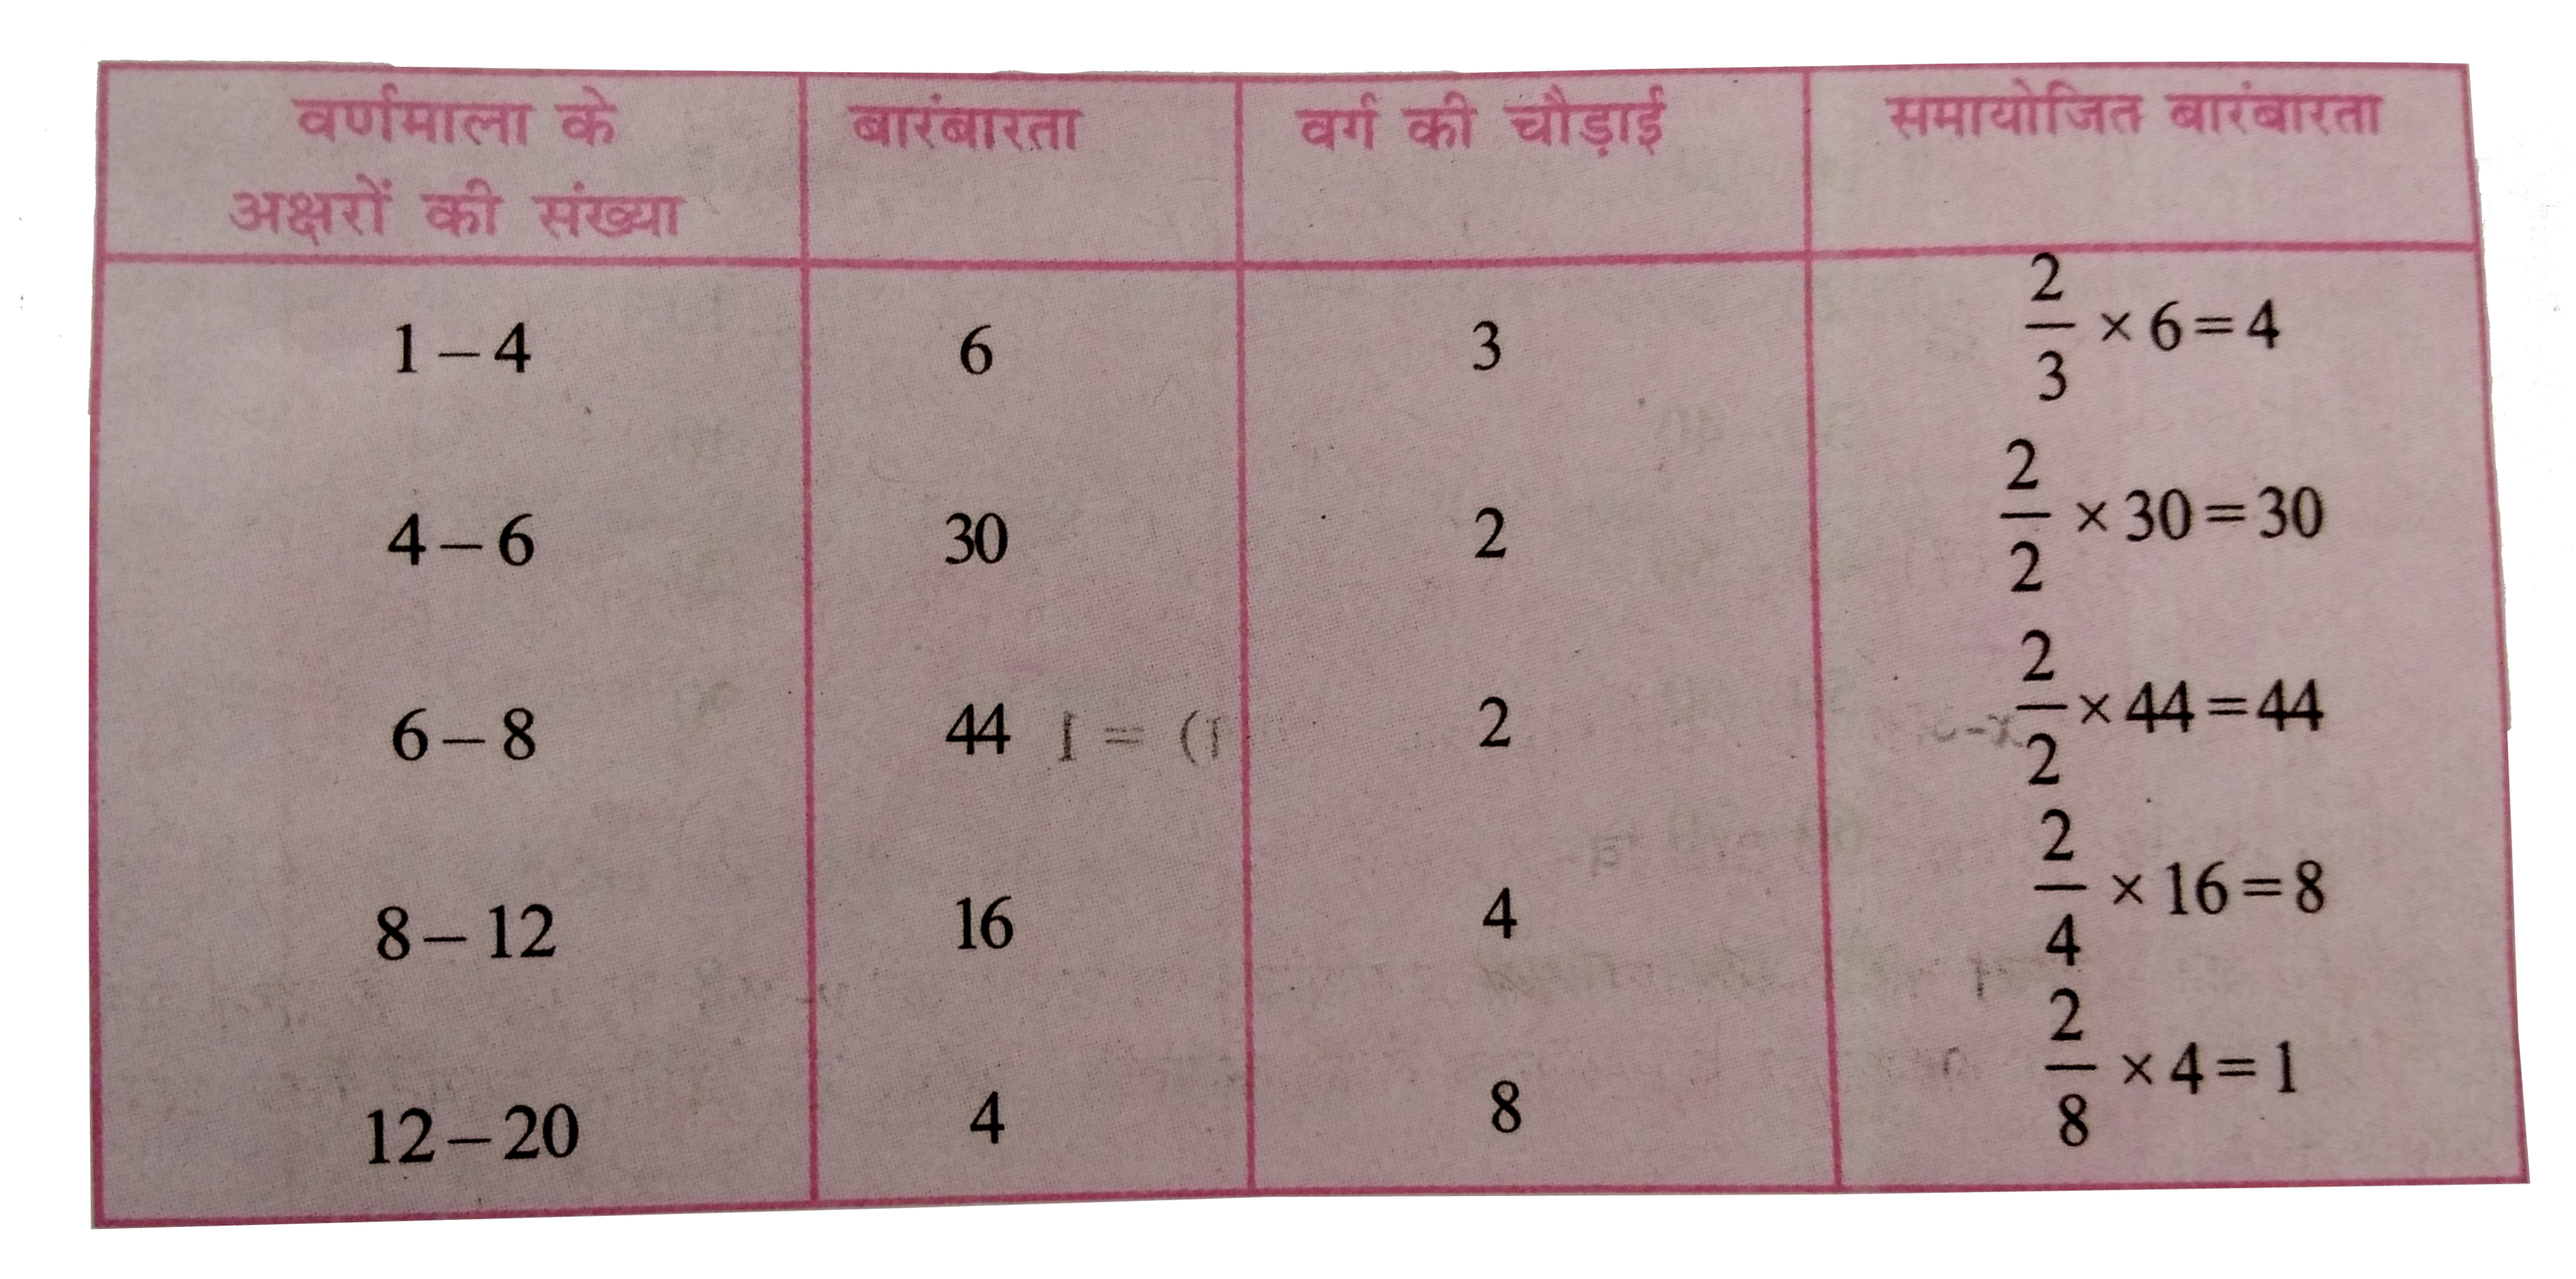
स्पष्तः दिए गए बारंबारता वितरण में वर्ग-आकार (आमाप) अलग-अलग है। अतः सर्वप्रथम हम सूत्र का प्रयोग करके समायोजित बारंबारता की गणना करते है।
किसी वर्ग के समायोजित बांरबारता =न्यूनतम वर्ग- आकारइस वर्ग का वर्ग आकार× इसकी बारंबारता
यहाँ न्यूनतम वर्ग-आकार =6−2=2
∴ हमे समायोजित बारंबारता की निम्न सारणी प्राप्त होती है:

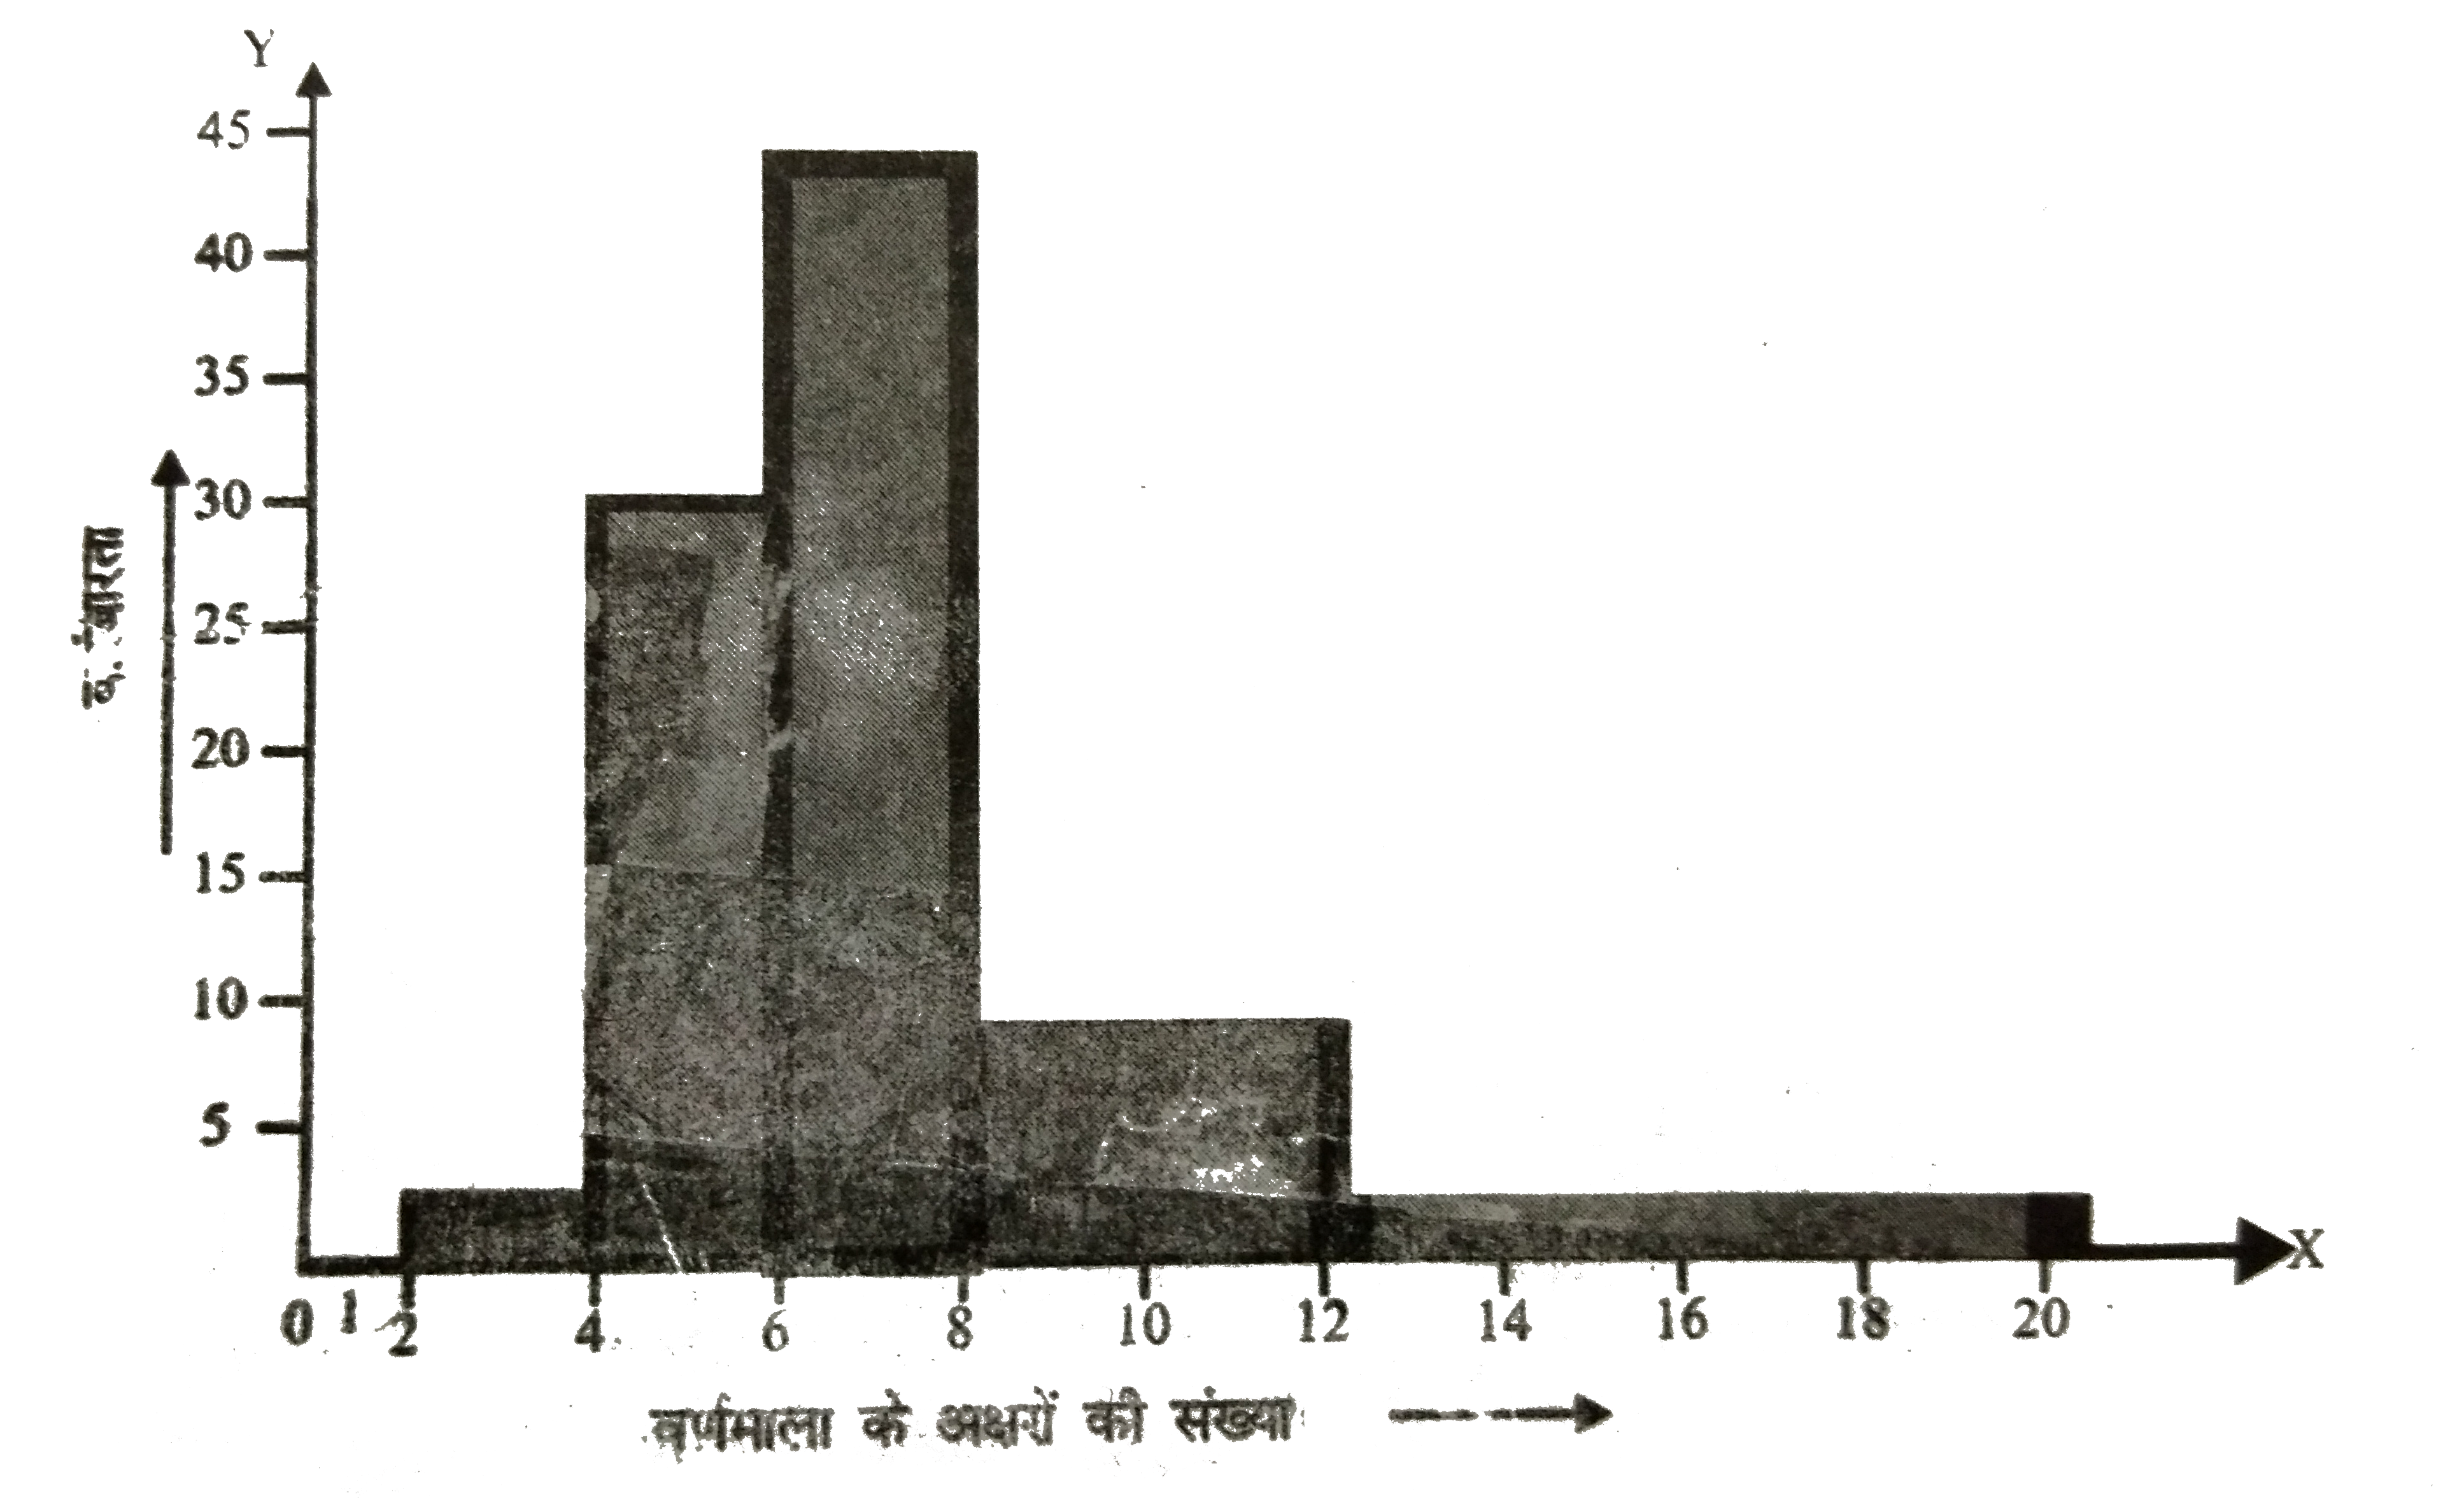
माना की x-अक्ष पर 1 cm ( 10 छोटा विभाग)=2 ltbrतथा y-अक्ष पर 1 cm (10 छोटा विभाग)
अब हम वर्ग अंतराल को x- पर तथा समायोजित बारंबारता को y-अक्ष पर लेकर तथा वर्ग अंतराल को आधार मानकर तथा समायोजित बारंबारता को ऊँचाई मानकर आयत खींचते है। अभीष्ट आयतचित्र नीचे गया गया है।

(ii) अधिकतम कुलनाम वर्ग अंतराल 6−8 में पड़ते है।
Topper's Solved these Questions
- आँकड़ों का आलेखीय निरूपण BOOK - KC SINHACHAPTER - आँकड़ों का आलेखीय निरूपण EXERCISE - अभ्यास
8 Videos
- आँकड़ों का आलेखीय निरूपण BOOK - KC SINHACHAPTER - आँकड़ों का आलेखीय निरूपण EXERCISE - वस्तुनिष्ठ प्रश्न
10 Videos
- आँकड़ों का संग्रह, वर्गीकरण एवं बारम्बारता बंटनBOOK - KC SINHACHAPTER - आँकड़ों का संग्रह, वर्गीकरण एवं बारम्बारता बंटनEXERCISE - वस्तुनिष्ट प्रश्न
13 Videos
Similar Questions
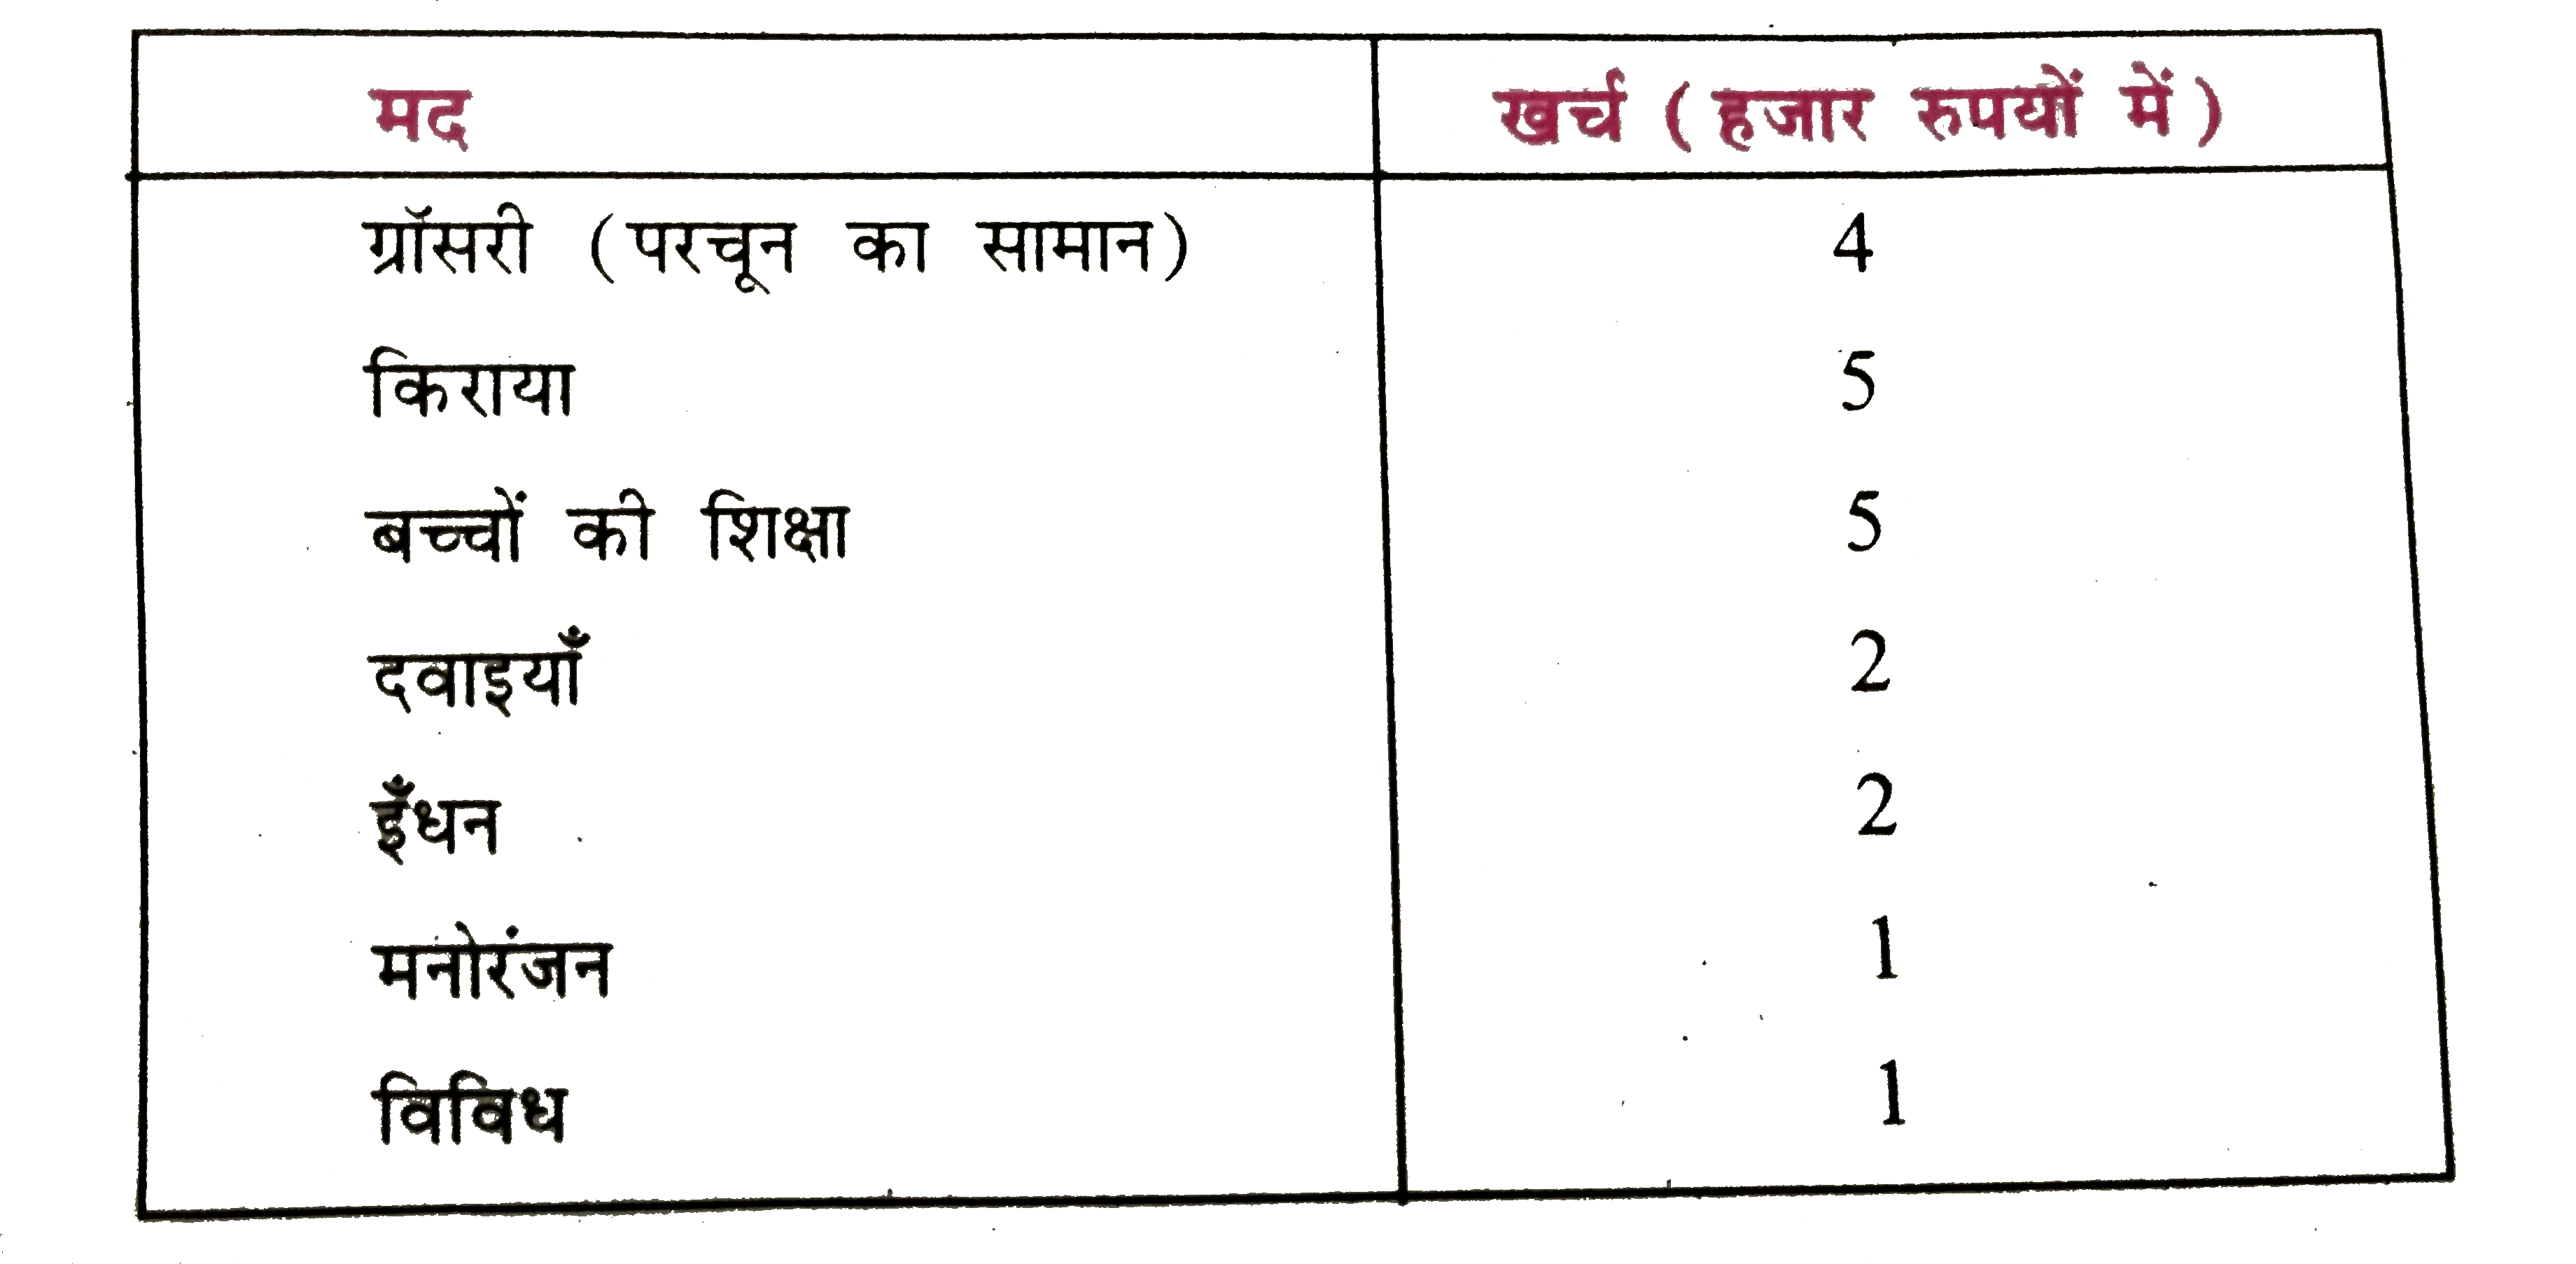
एक परिवार ने जिसकी मासिक आय 20000 रु है, विभिन्न पदो के अंतर्गत हर महीने होने वाले खर्च की योजना बनाई थी :

ऊपर दिए गए आँकड़ो का एक दंड आलेख बनाइए।
View Solutionआँकड़ो के दंड आलेख में दड़ो के निर्माण में किसका महत्व होता है ?
View Solutionसंग्रहीत आंकड़े में किसी पद की पुनरावृत्तियों की संख्या उस पद की क्या कहलाती है :-
View SolutionWhich of the following are correct chain isomers of butane ? (i)
View SolutionDetermine the point of symmetry of a regular hexagon.
View SolutionDtermine the images of the following figure about the given line :
View SolutionMatch the following Column A to Column B

View SolutionMatch the following Column A to Column B

View SolutionMatch the following Column A to Column B

View SolutionThe inequation represented by the graph given below is :
View SolutionThe inequation that best describes the graph given below is _________
View SolutionThe inequation that best describes the following graph is _________
View SolutionWhich inequations represent the shaded region in the given figure
View SolutionMatch the followings (column I with column II)
ltimg src="https://d10lpgp6xz60nq.cloudfront.net/physics_images/NCERT_BIO_XI_C03_E01_011_Q01.png" width="80%"gt
View SolutionMatch column I with column II
ltimg src="https://d10lpgp6xz60nq.cloudfront.net/physics_images/NCERT_BIO_XI_C16_E01_002_Q01.png" width="80%"gt
View SolutionMatch column I with column II:
ltimg src="https://d10lpgp6xz60nq.cloudfront.net/physics_images/NCERT_BIO_XI_C18_E01_003_Q01.png" width="80%"gt
View Solution
