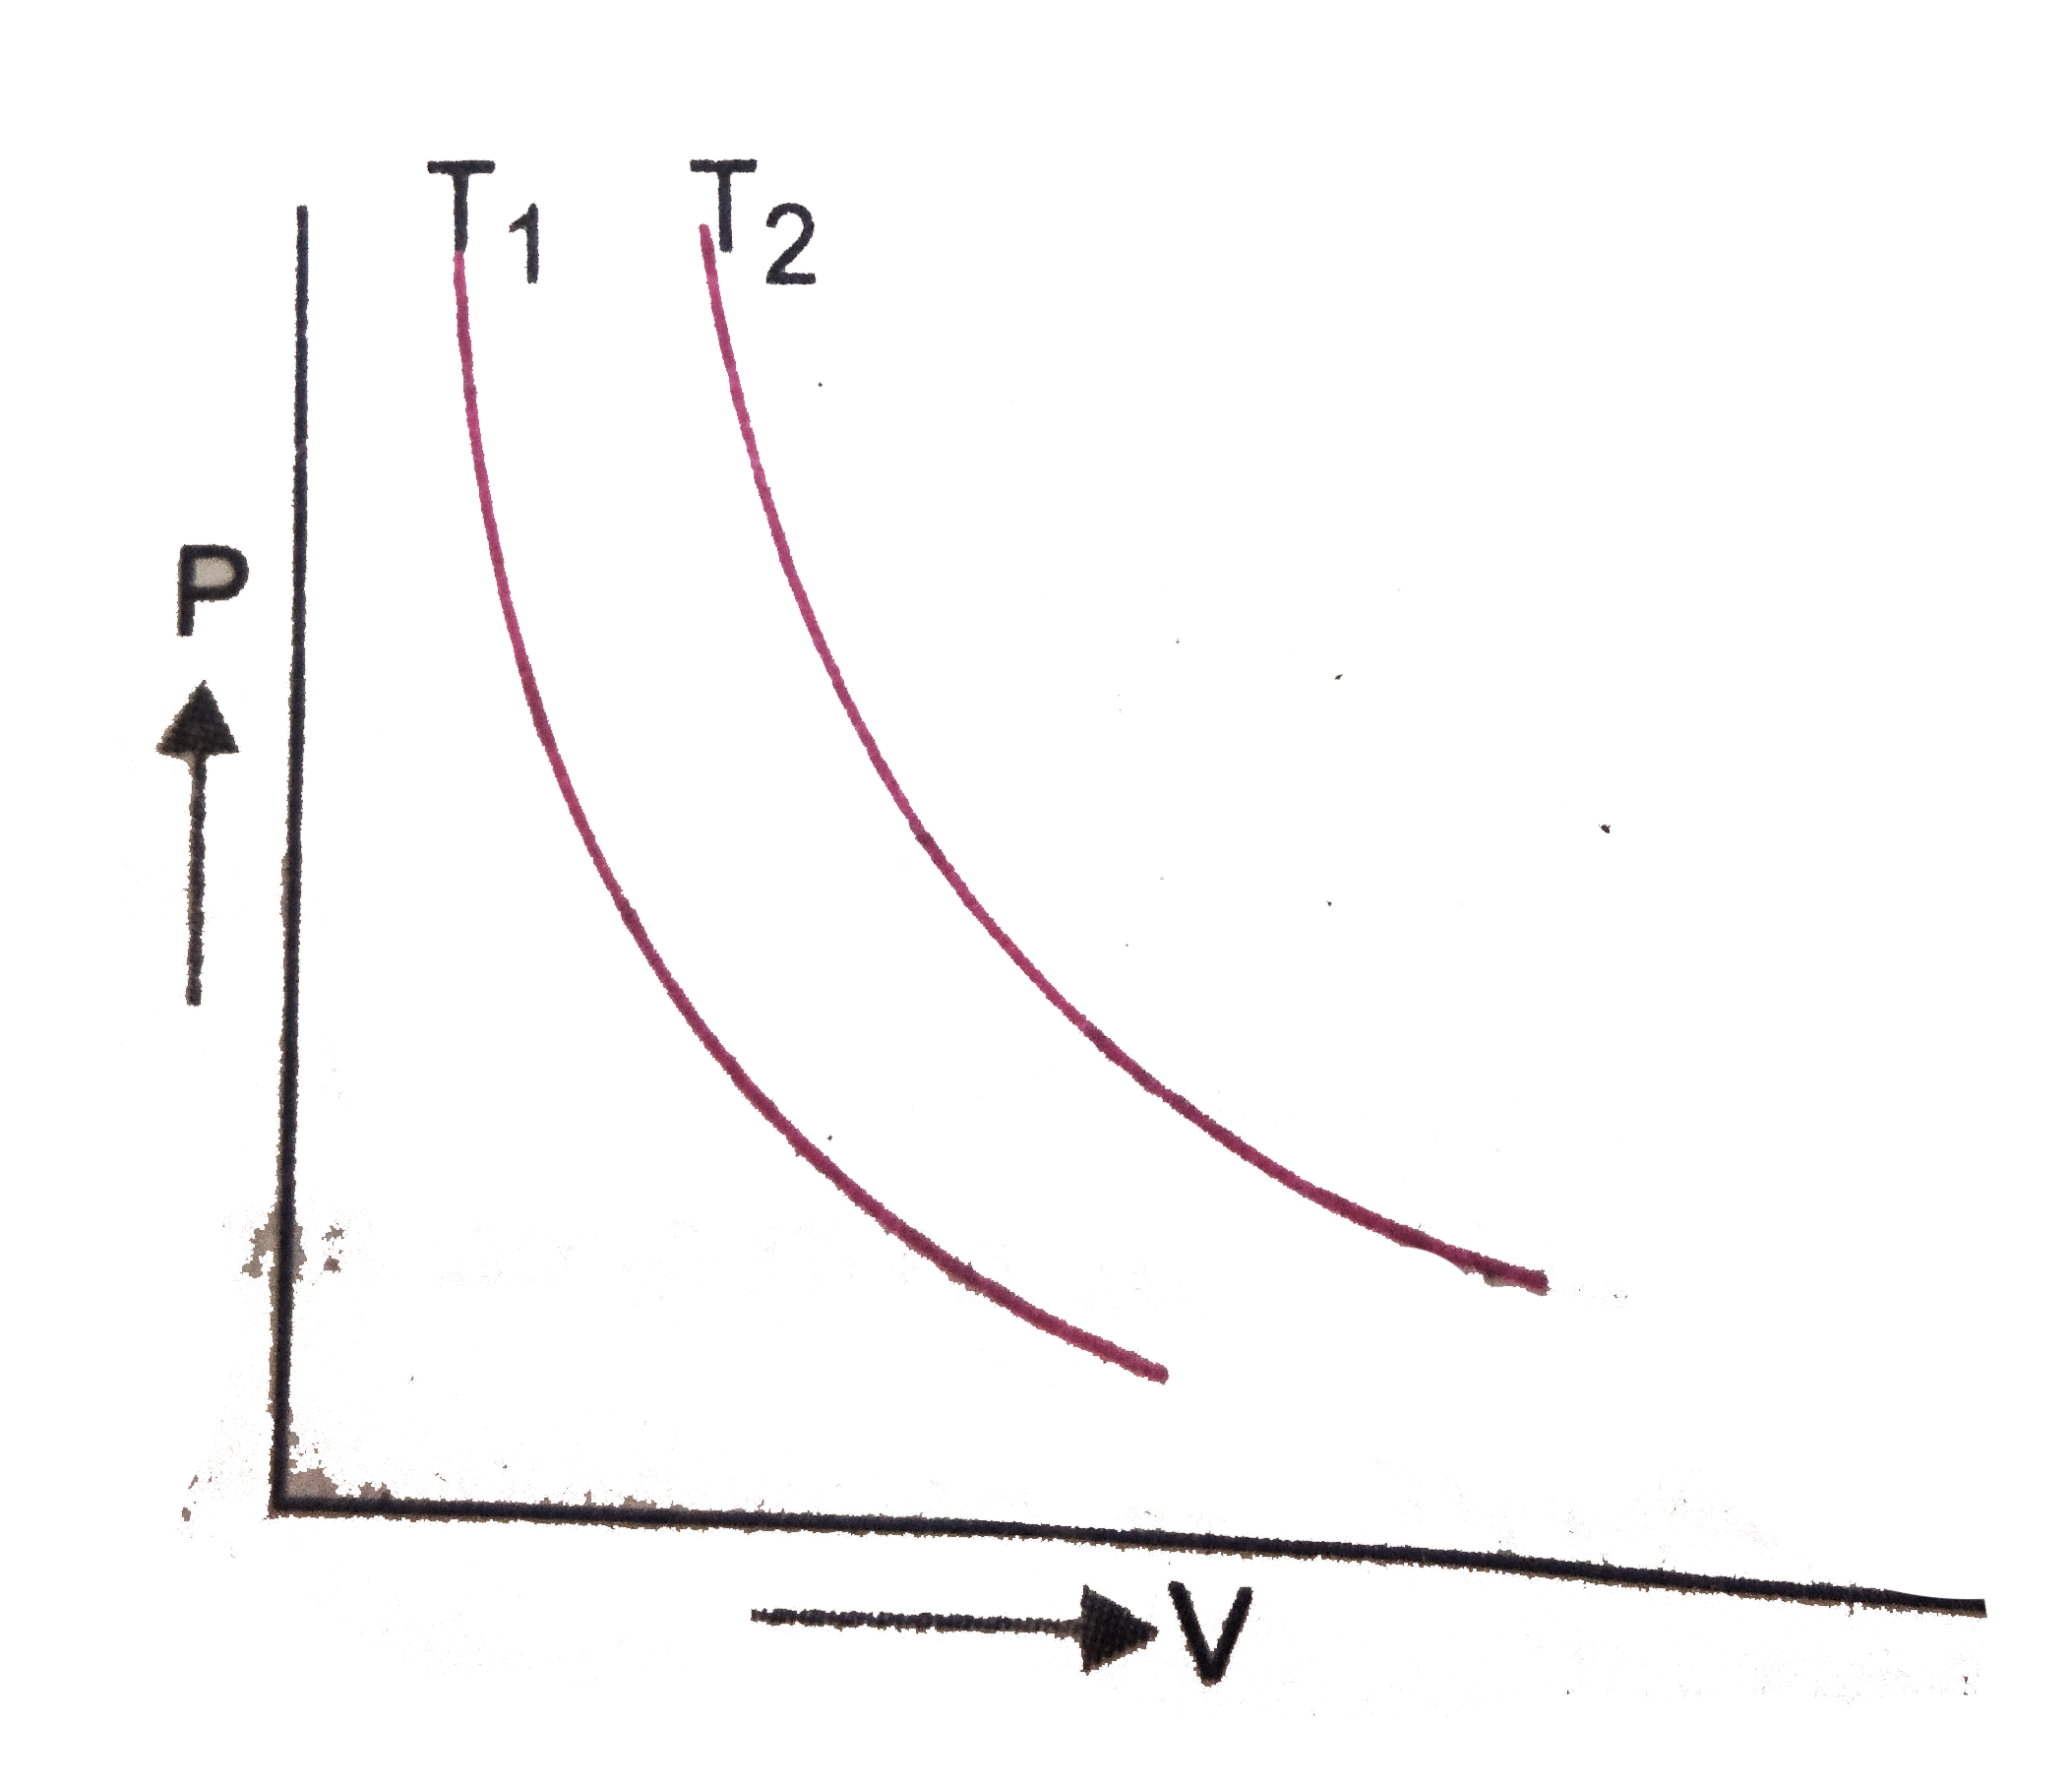
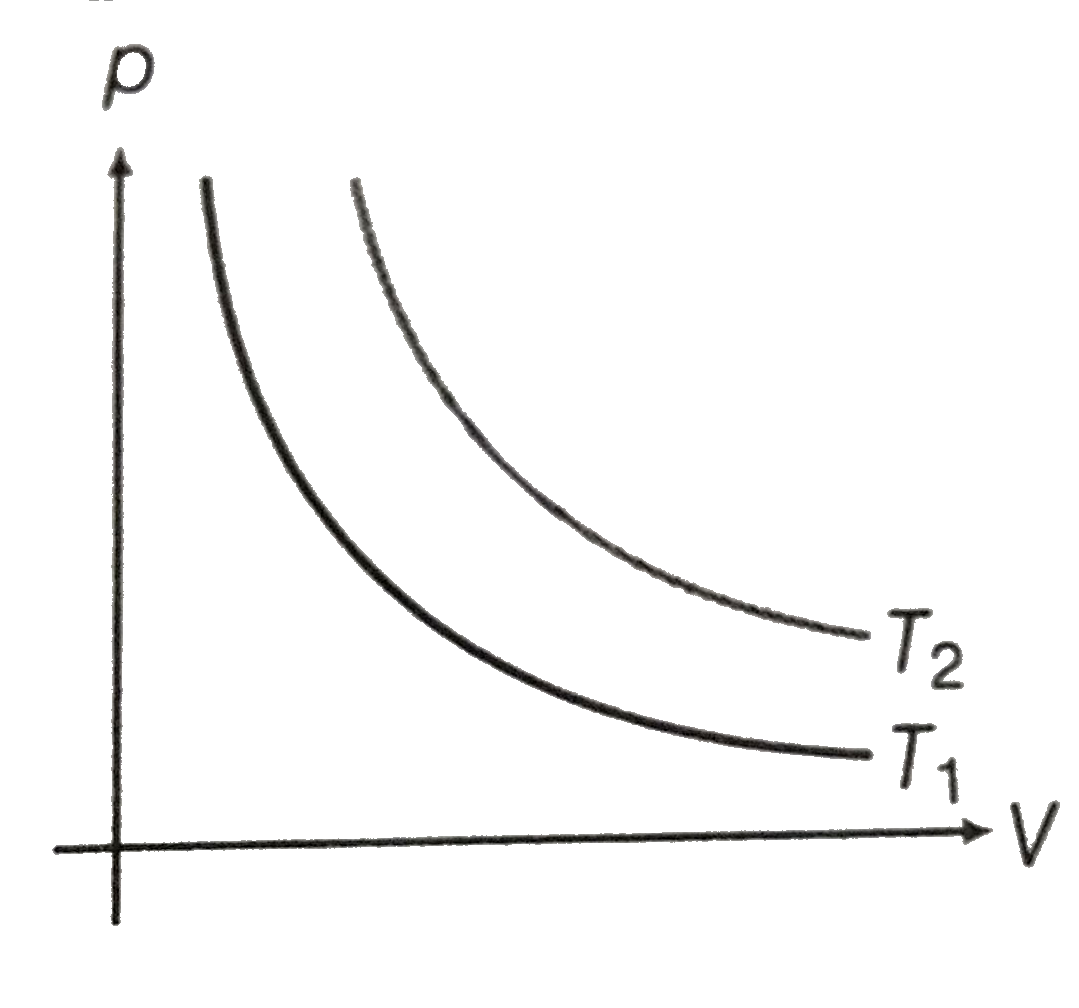
The p−V diagram of two different masses m1 and m2 are drawn (as shown) at constant temperature (T). State whether m1>m2orm2>m2.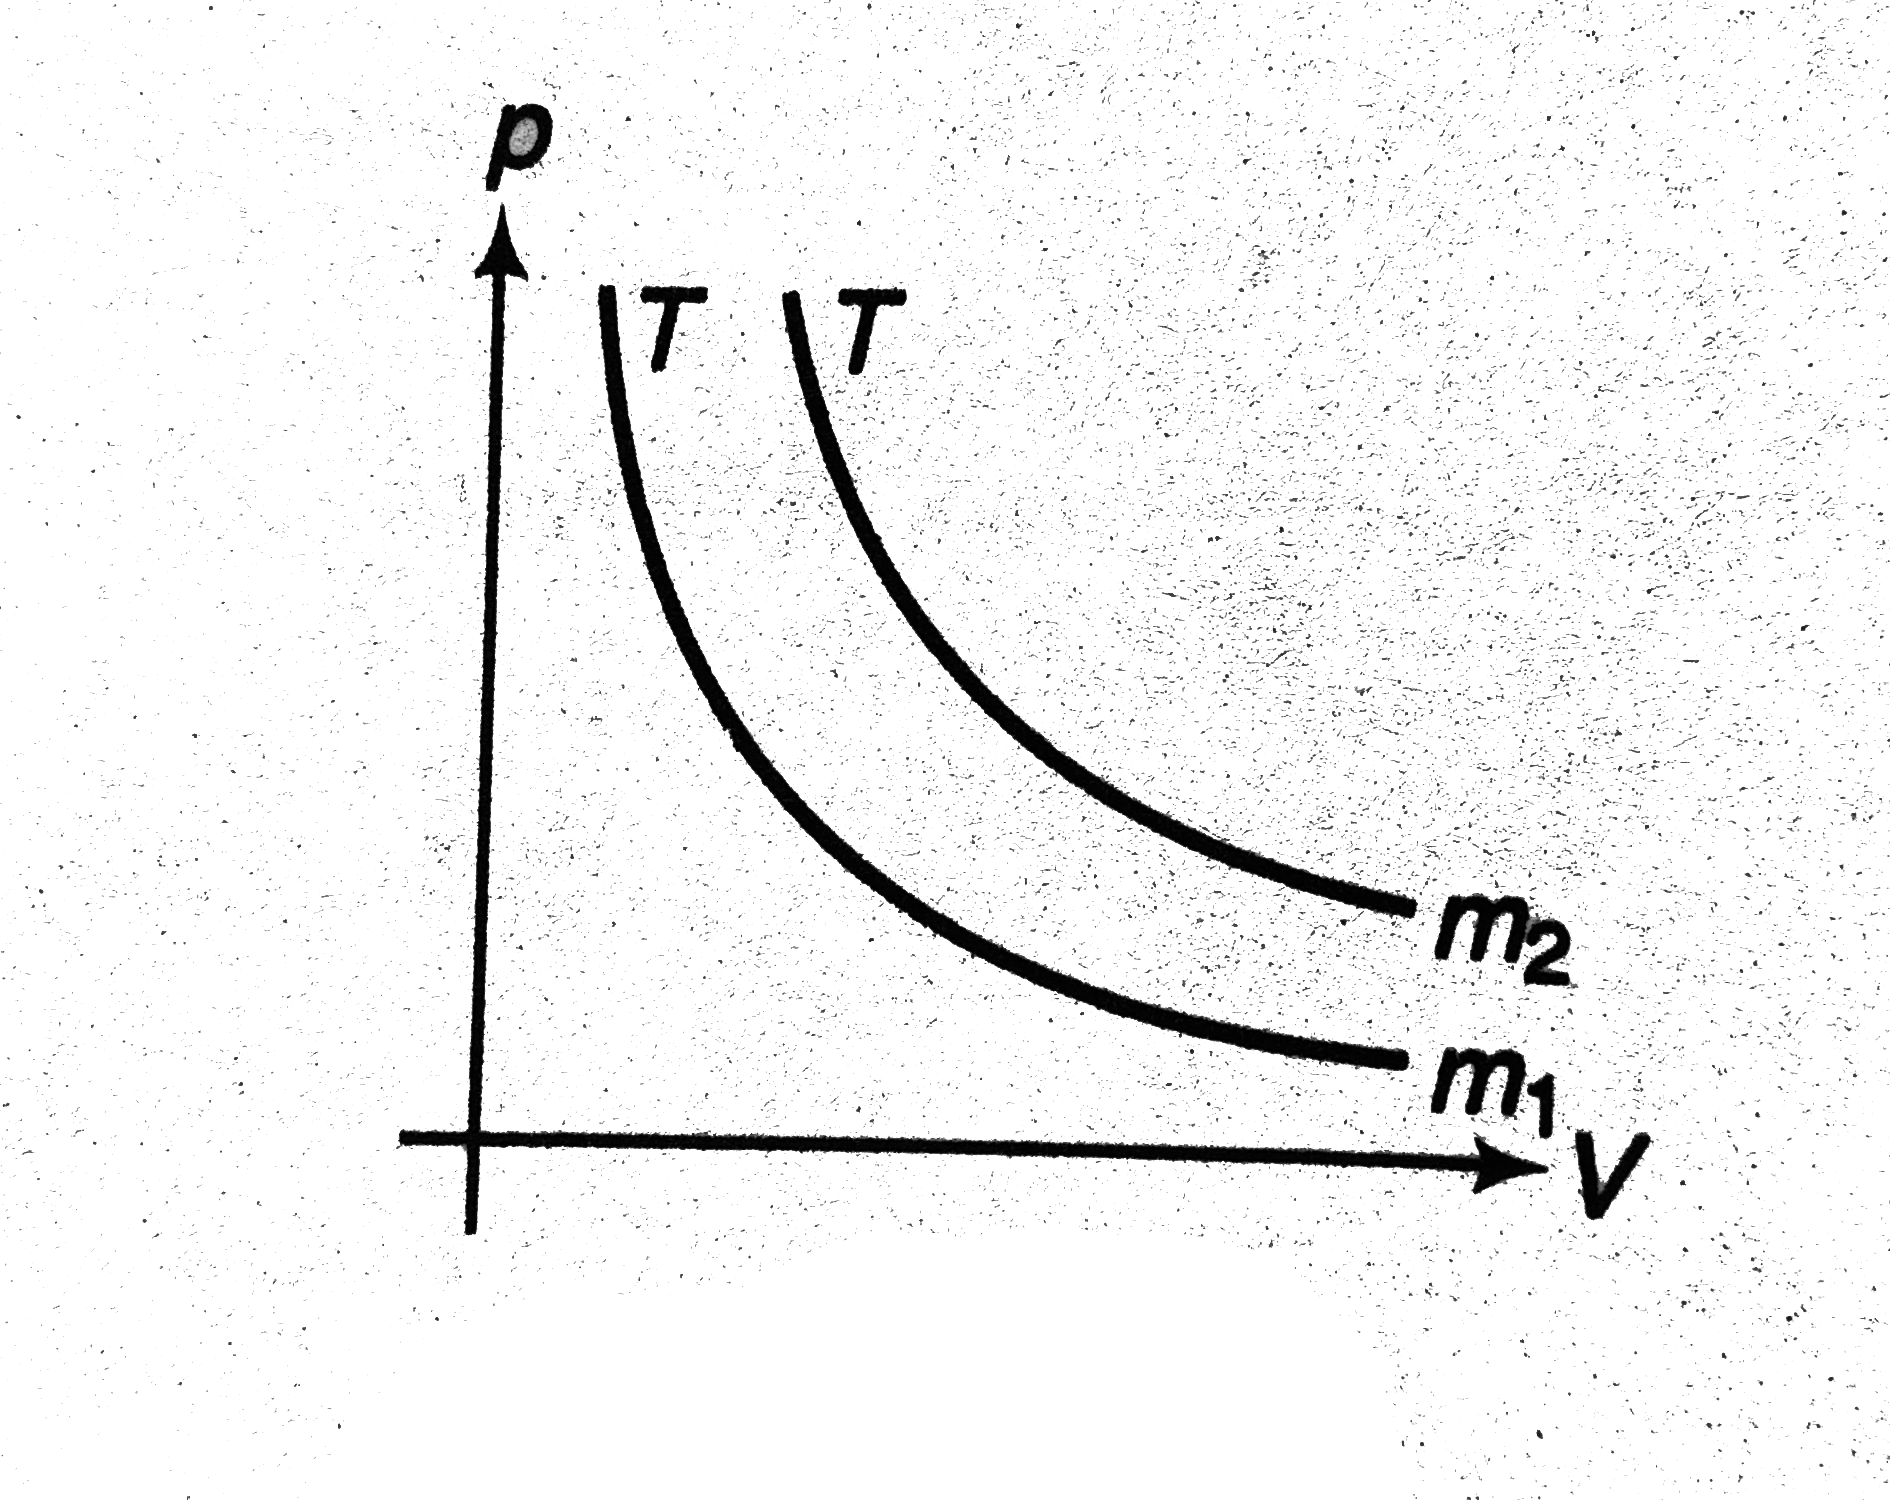 .
.
The correct Answer is:A, B
pV=nRT=mMRT
∴m=(pV)(MRT) or m∝pVifT= constant
From the graph, we can see that p2V2>p1V1( for same p or V).Therefore,
m2>m1.
Topper's Solved these Questions
- THERMOMETRY,THERMAL EXPANSION & KINETIC THEORY OF GASESBook:DC PANDEYChapter:THERMOMETRY,THERMAL EXPANSION & KINETIC THEORY OF GASESExercise:Example Type 1
Explore 1 Video
- THERMOMETRY,THERMAL EXPANSION & KINETIC THEORY OF GASESBook:DC PANDEYChapter:THERMOMETRY,THERMAL EXPANSION & KINETIC THEORY OF GASESExercise:Example Type 2
Explore 1 Video
- THERMOMETRY THERMAL EXPANSION AND KINETIC THEORY OF GASESBook:DC PANDEYChapter:THERMOMETRY THERMAL EXPANSION AND KINETIC THEORY OF GASESExercise:Medical entrance gallary
Explore 30 Videos
- UNIT AND DIMENSIONSBook:DC PANDEYChapter:UNIT AND DIMENSIONSExercise:Assertion And Reason
Explore 2 Videos
Similar Questions
Knowledge Check
The figure shown, the p-V diagram of two different masses m1andm2 drawn at constant temperature T, then ltbr>
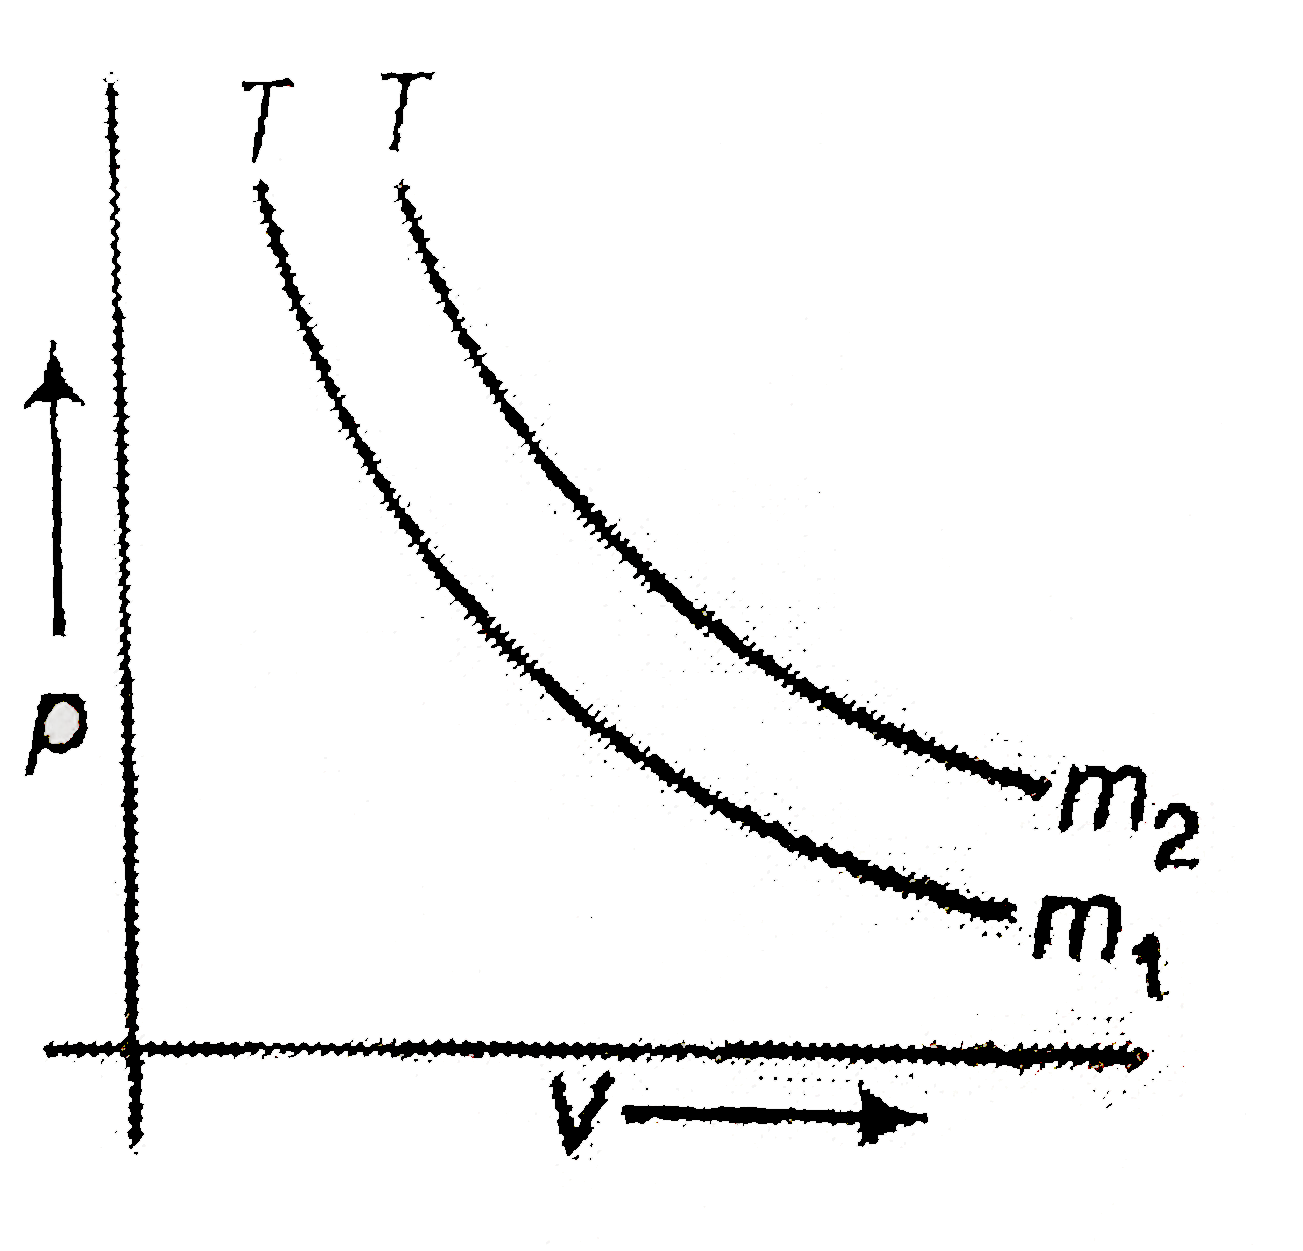 Am1>m2Bm2>m1Cm1=m2Dinsufficient data
Two block of masses m1 and m2 are connected as shown in the figure. The acceleration of the block m2 is:
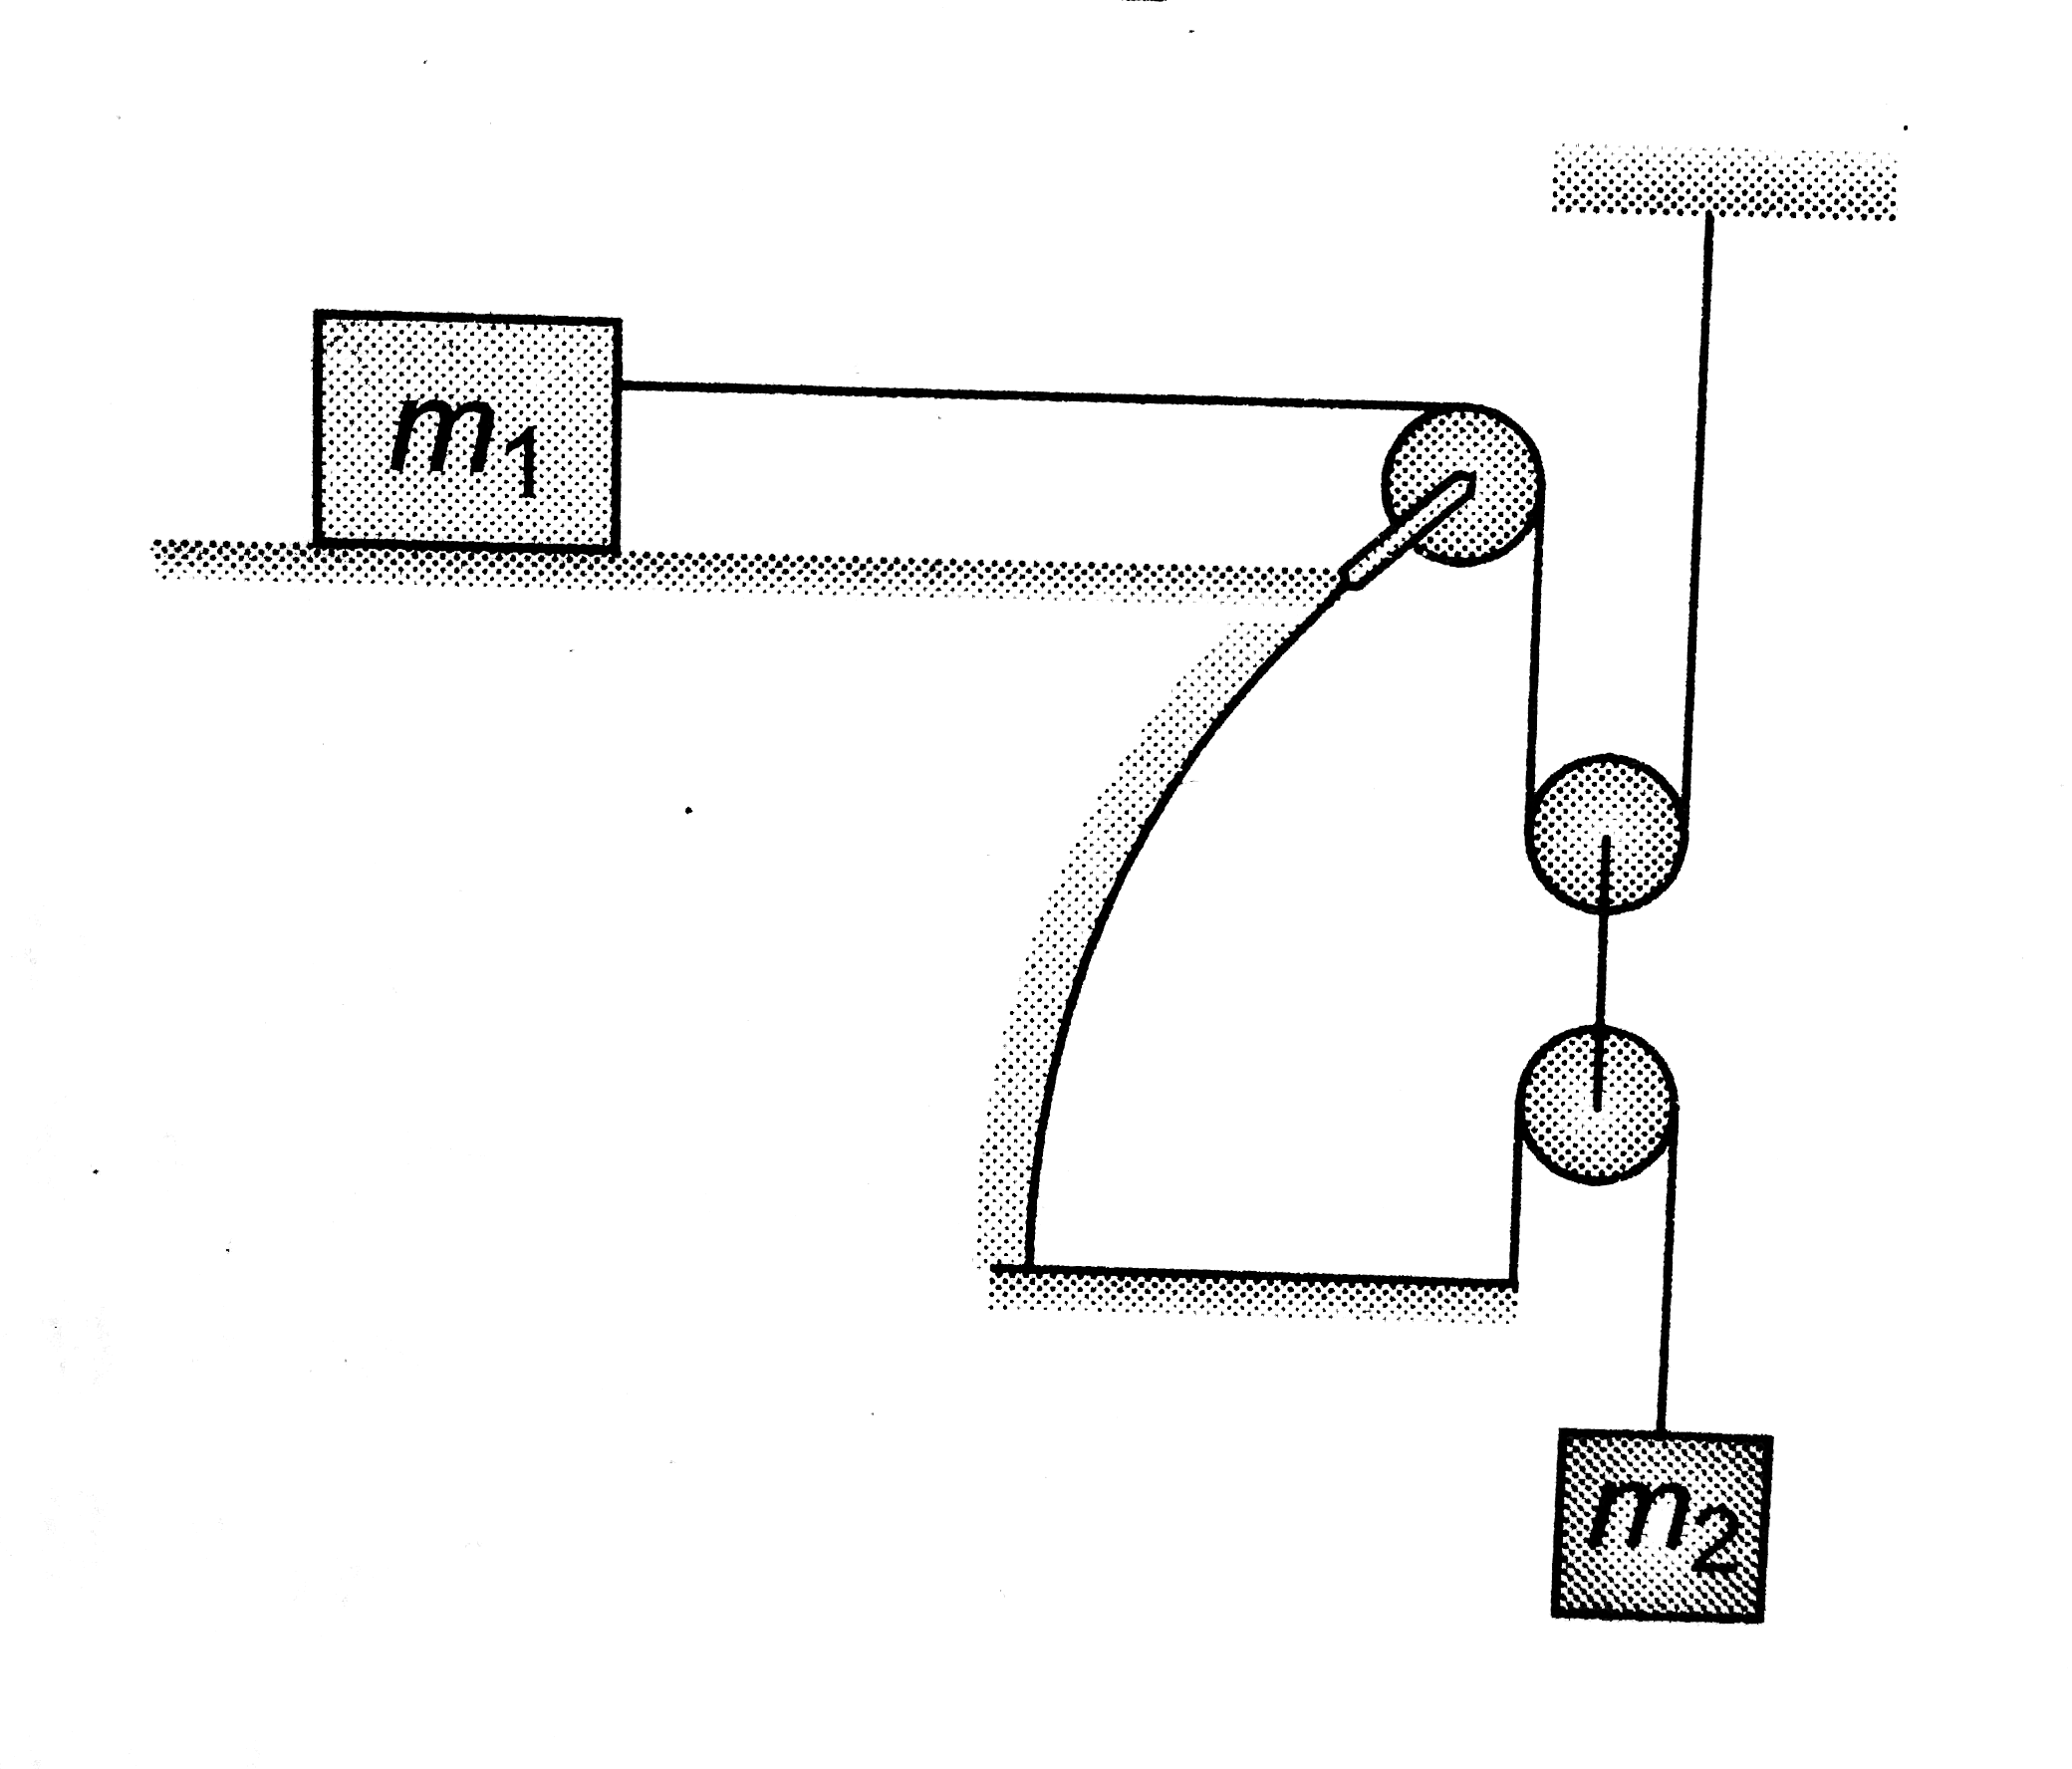 Am2gm1+m2Bm1gm1+m2C4m2g−m1gm1+m2Dm2gm1+4m2
Two masses m1 and m2 are attached to a spring balance S as shown in figure. m1>m2 then the reading of spring balance will be .
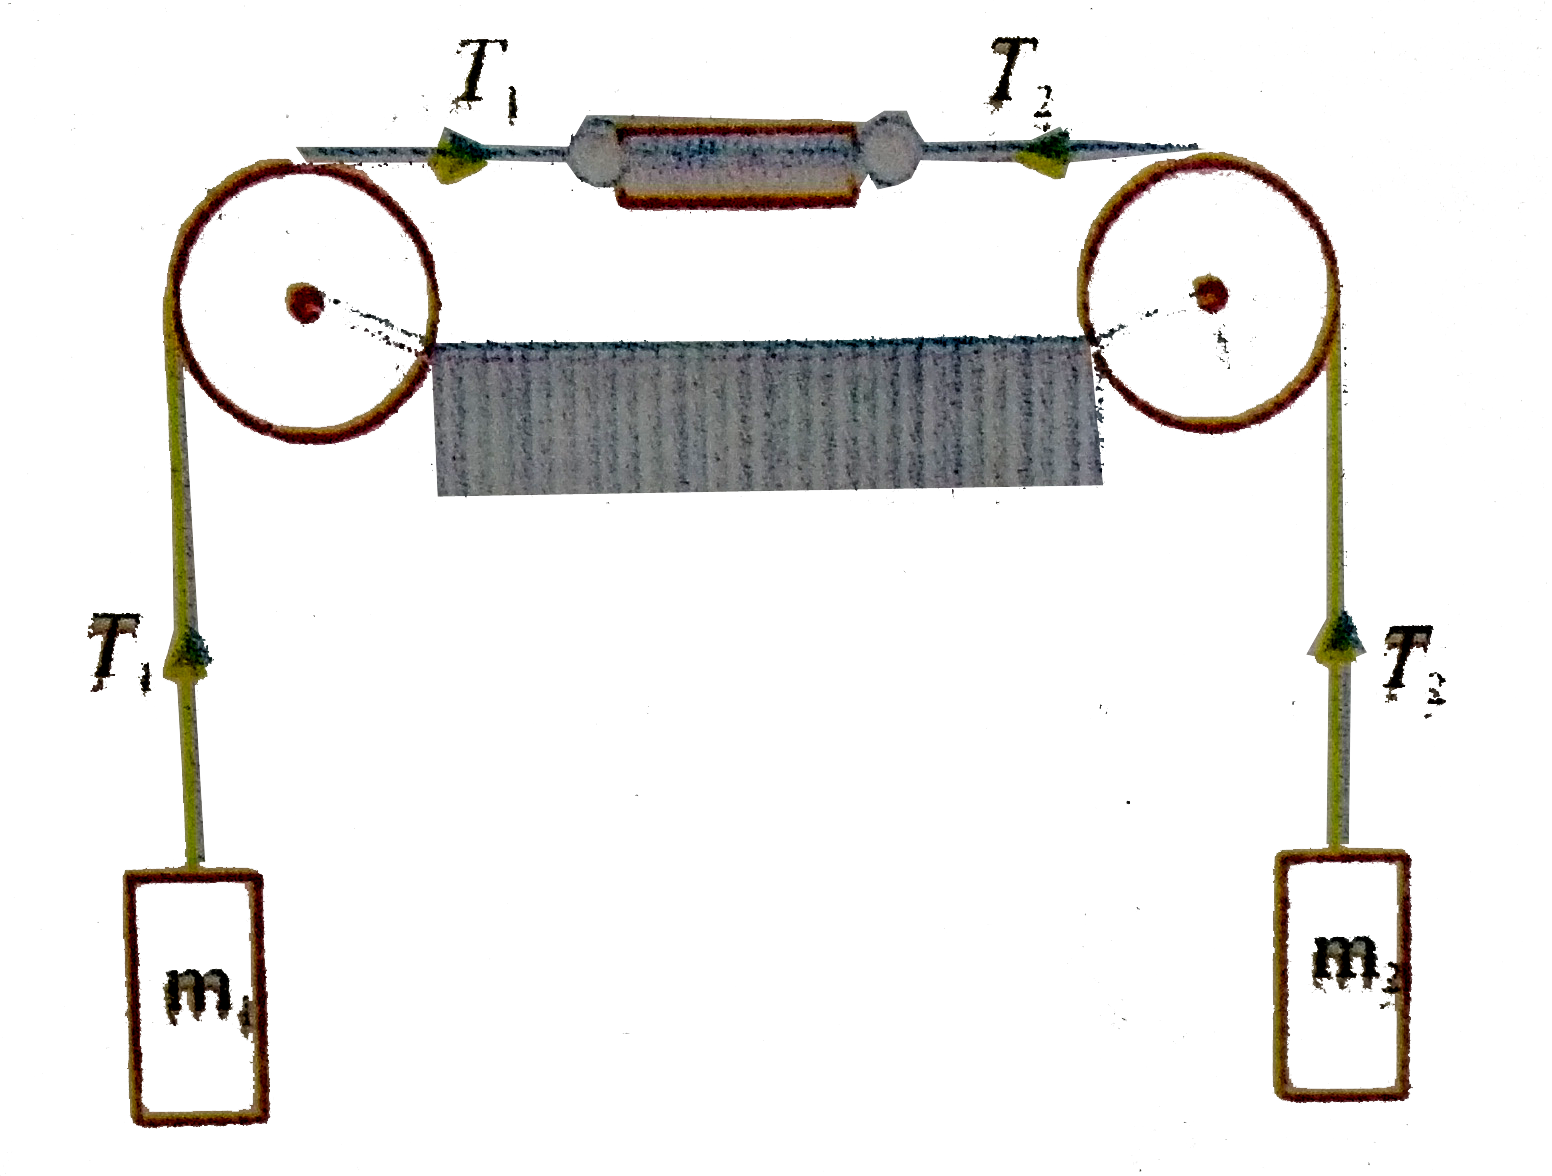 .A(m1−m2)B(m1+m2)C2m1m2m1+m2Dm1m2m1+m2
M1andM2 represent the masses of .10Ne20 nucleus and .20Ca40 nucleus respectively. State whether M2=2M1 or M2>2M1 or M2<2M1
View SolutionEqual volumes of two different gases 1 and 2 with respective molecular masses M1 and M2 are the same temperature (T) and pressure (P), if M1>M2, then which of the following is true regarding the number of molecules (N) ?
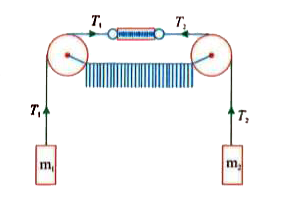
View SolutionTwo masses m1 and m2 are attached to a spring balance S as shown in Figure. If m1>m2 then the reading of spring balance will be
View SolutionTwo bodies of masses m1andm2 are separated by certain distance. If →F12 is the force on m1 due to m2 and →F21 is the force on m2 due to m1, then
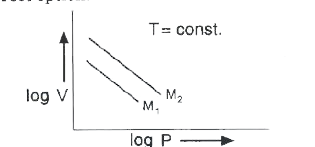
View SolutionFor same mass of two different ideal gases of molecular weights M1andM2 plots of log V vs log P at a given constant temperature are shown. Identify the correct option.
View Solution
