Gravtational potential varies alolngl x-axis as shown in figure .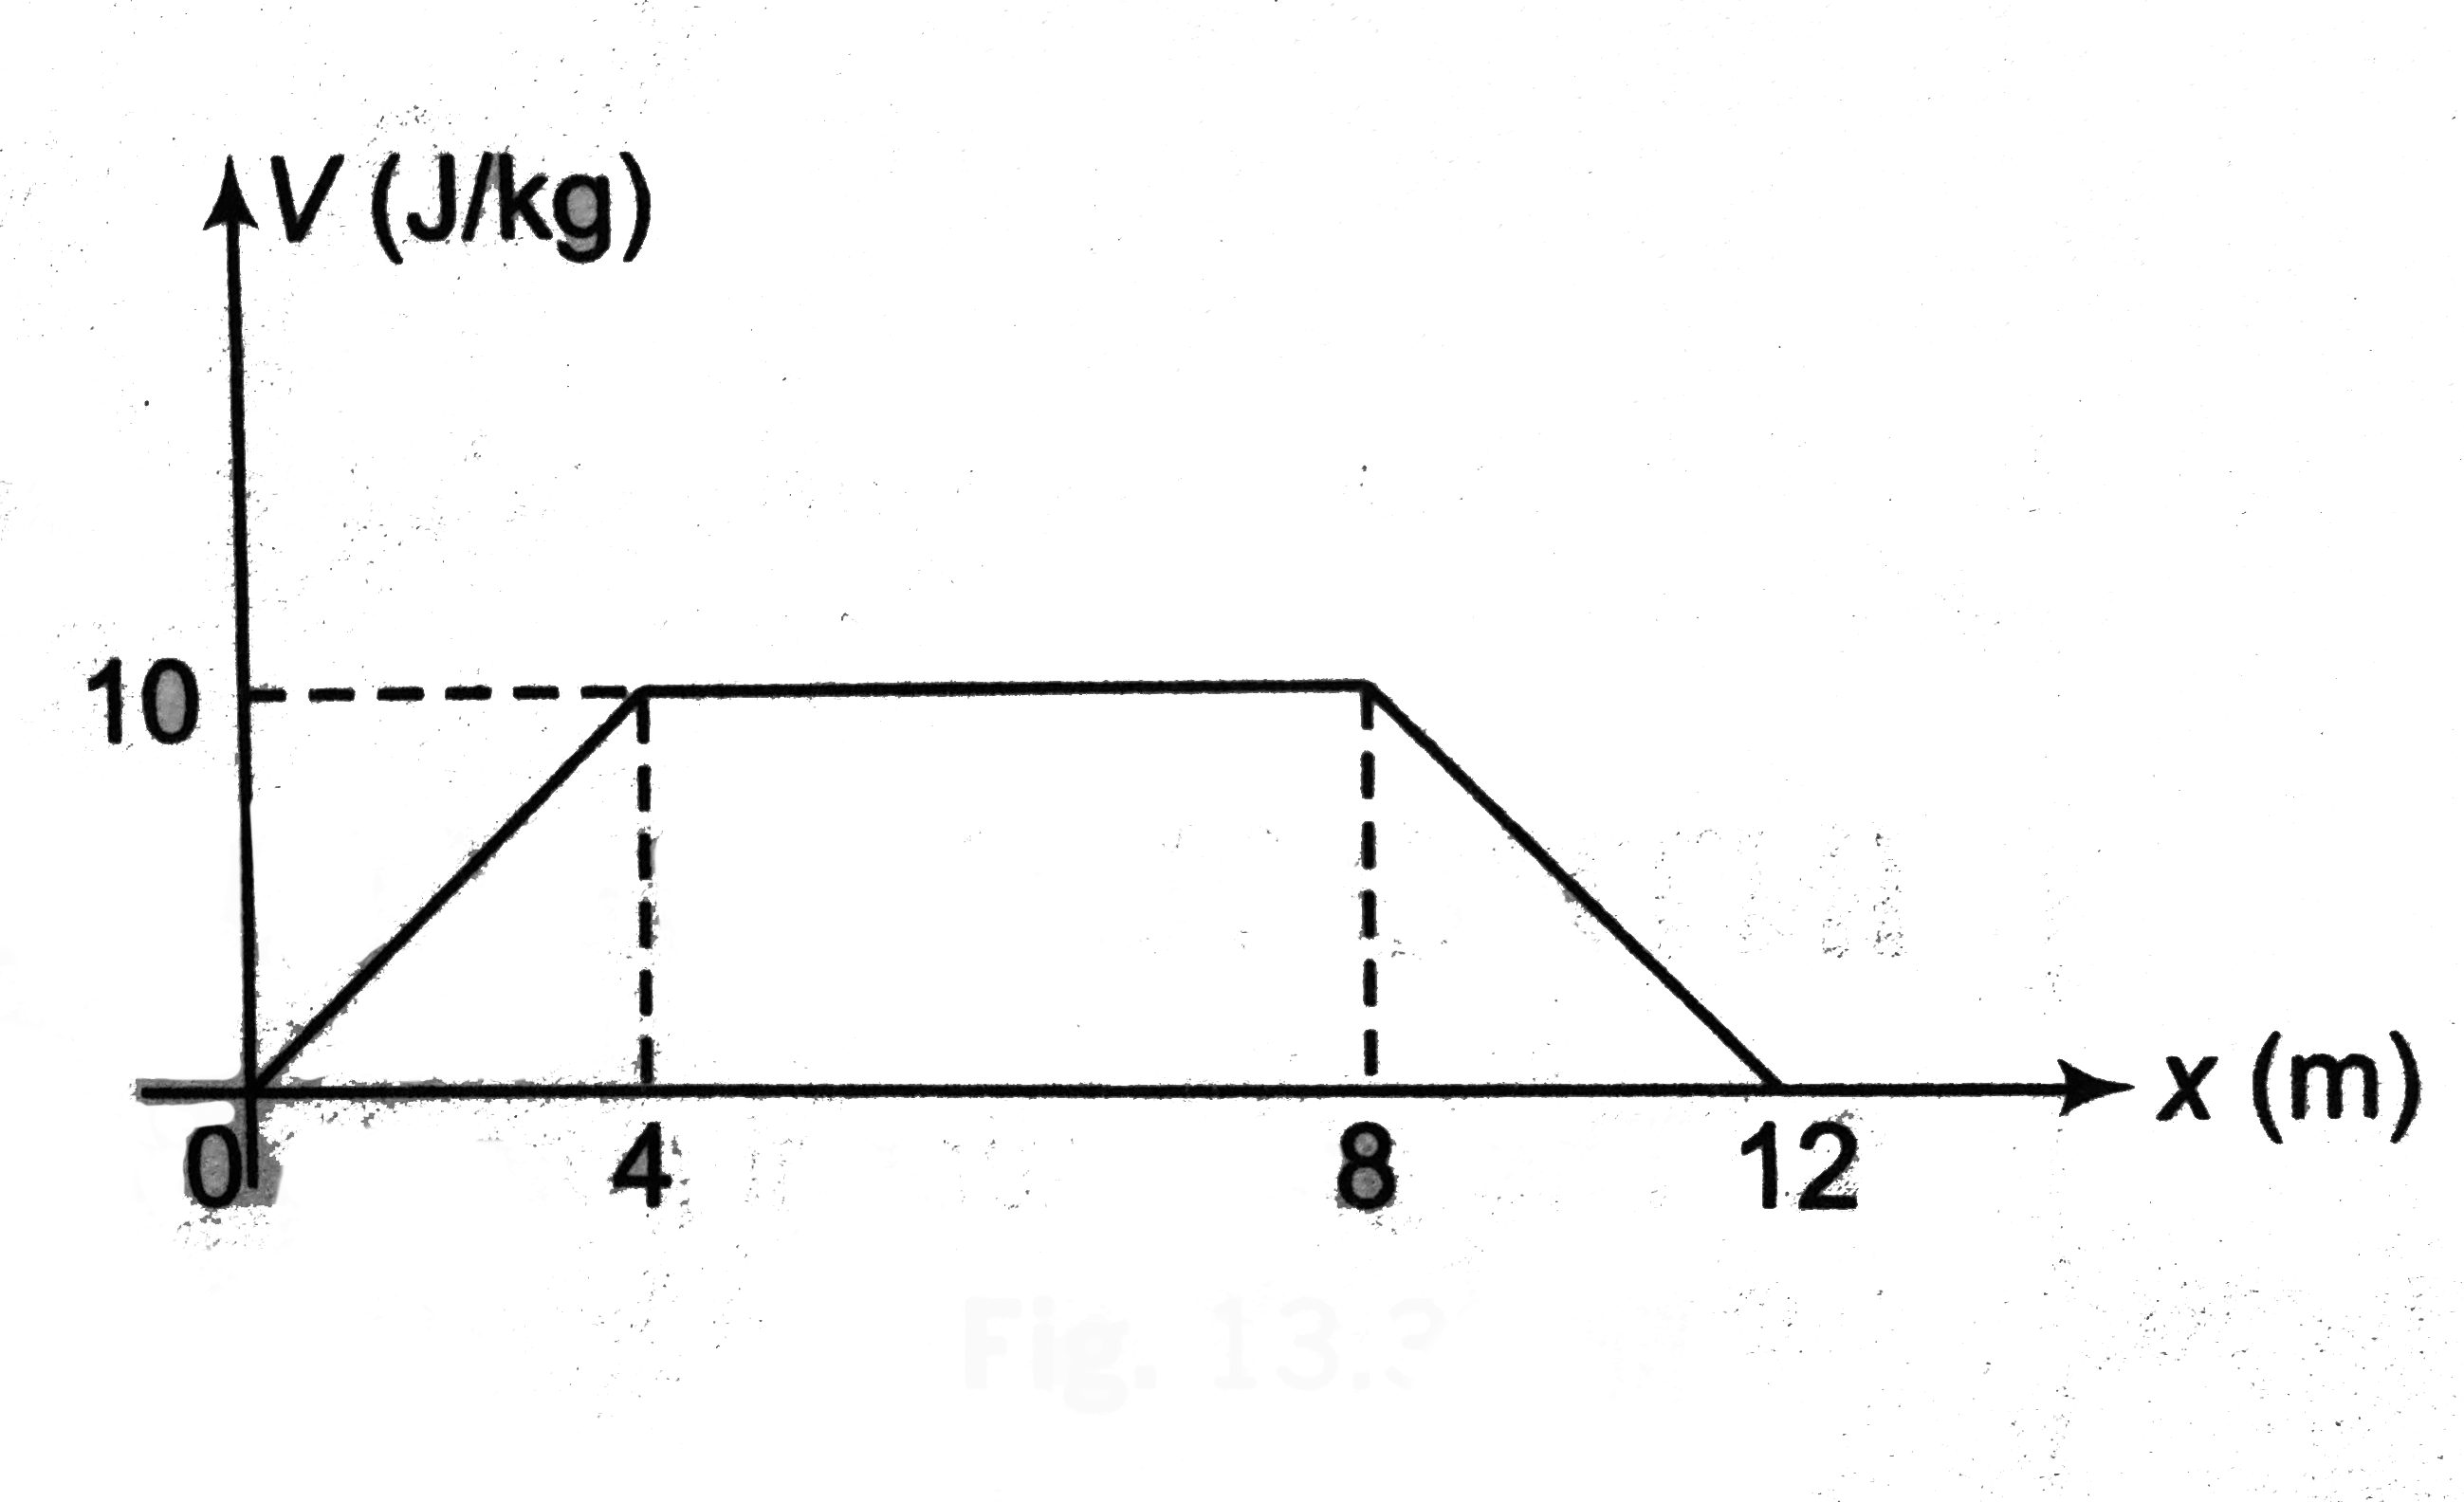
(a) Plot E versus x graph corresponding to given V−x graph.
(b) A mass of 2 kg is kept at x=3m. Find gravitational force on it.
Video Solution
Text Solution
The correct Answer is:B
(a) E=−dVdx=−slope of V−x graph.
From x=0 to x=4m
slope =+104=(2.5)N/kg
∴E=−(2.5)N/kg
From x=4m to x=8m
Slope =0
∴E=0
From x=8m to x=12m
Slope = −104=−2.5N/kg
∴E=+(2.5)N/kg Therfore, E−x graph is as shown in figure. 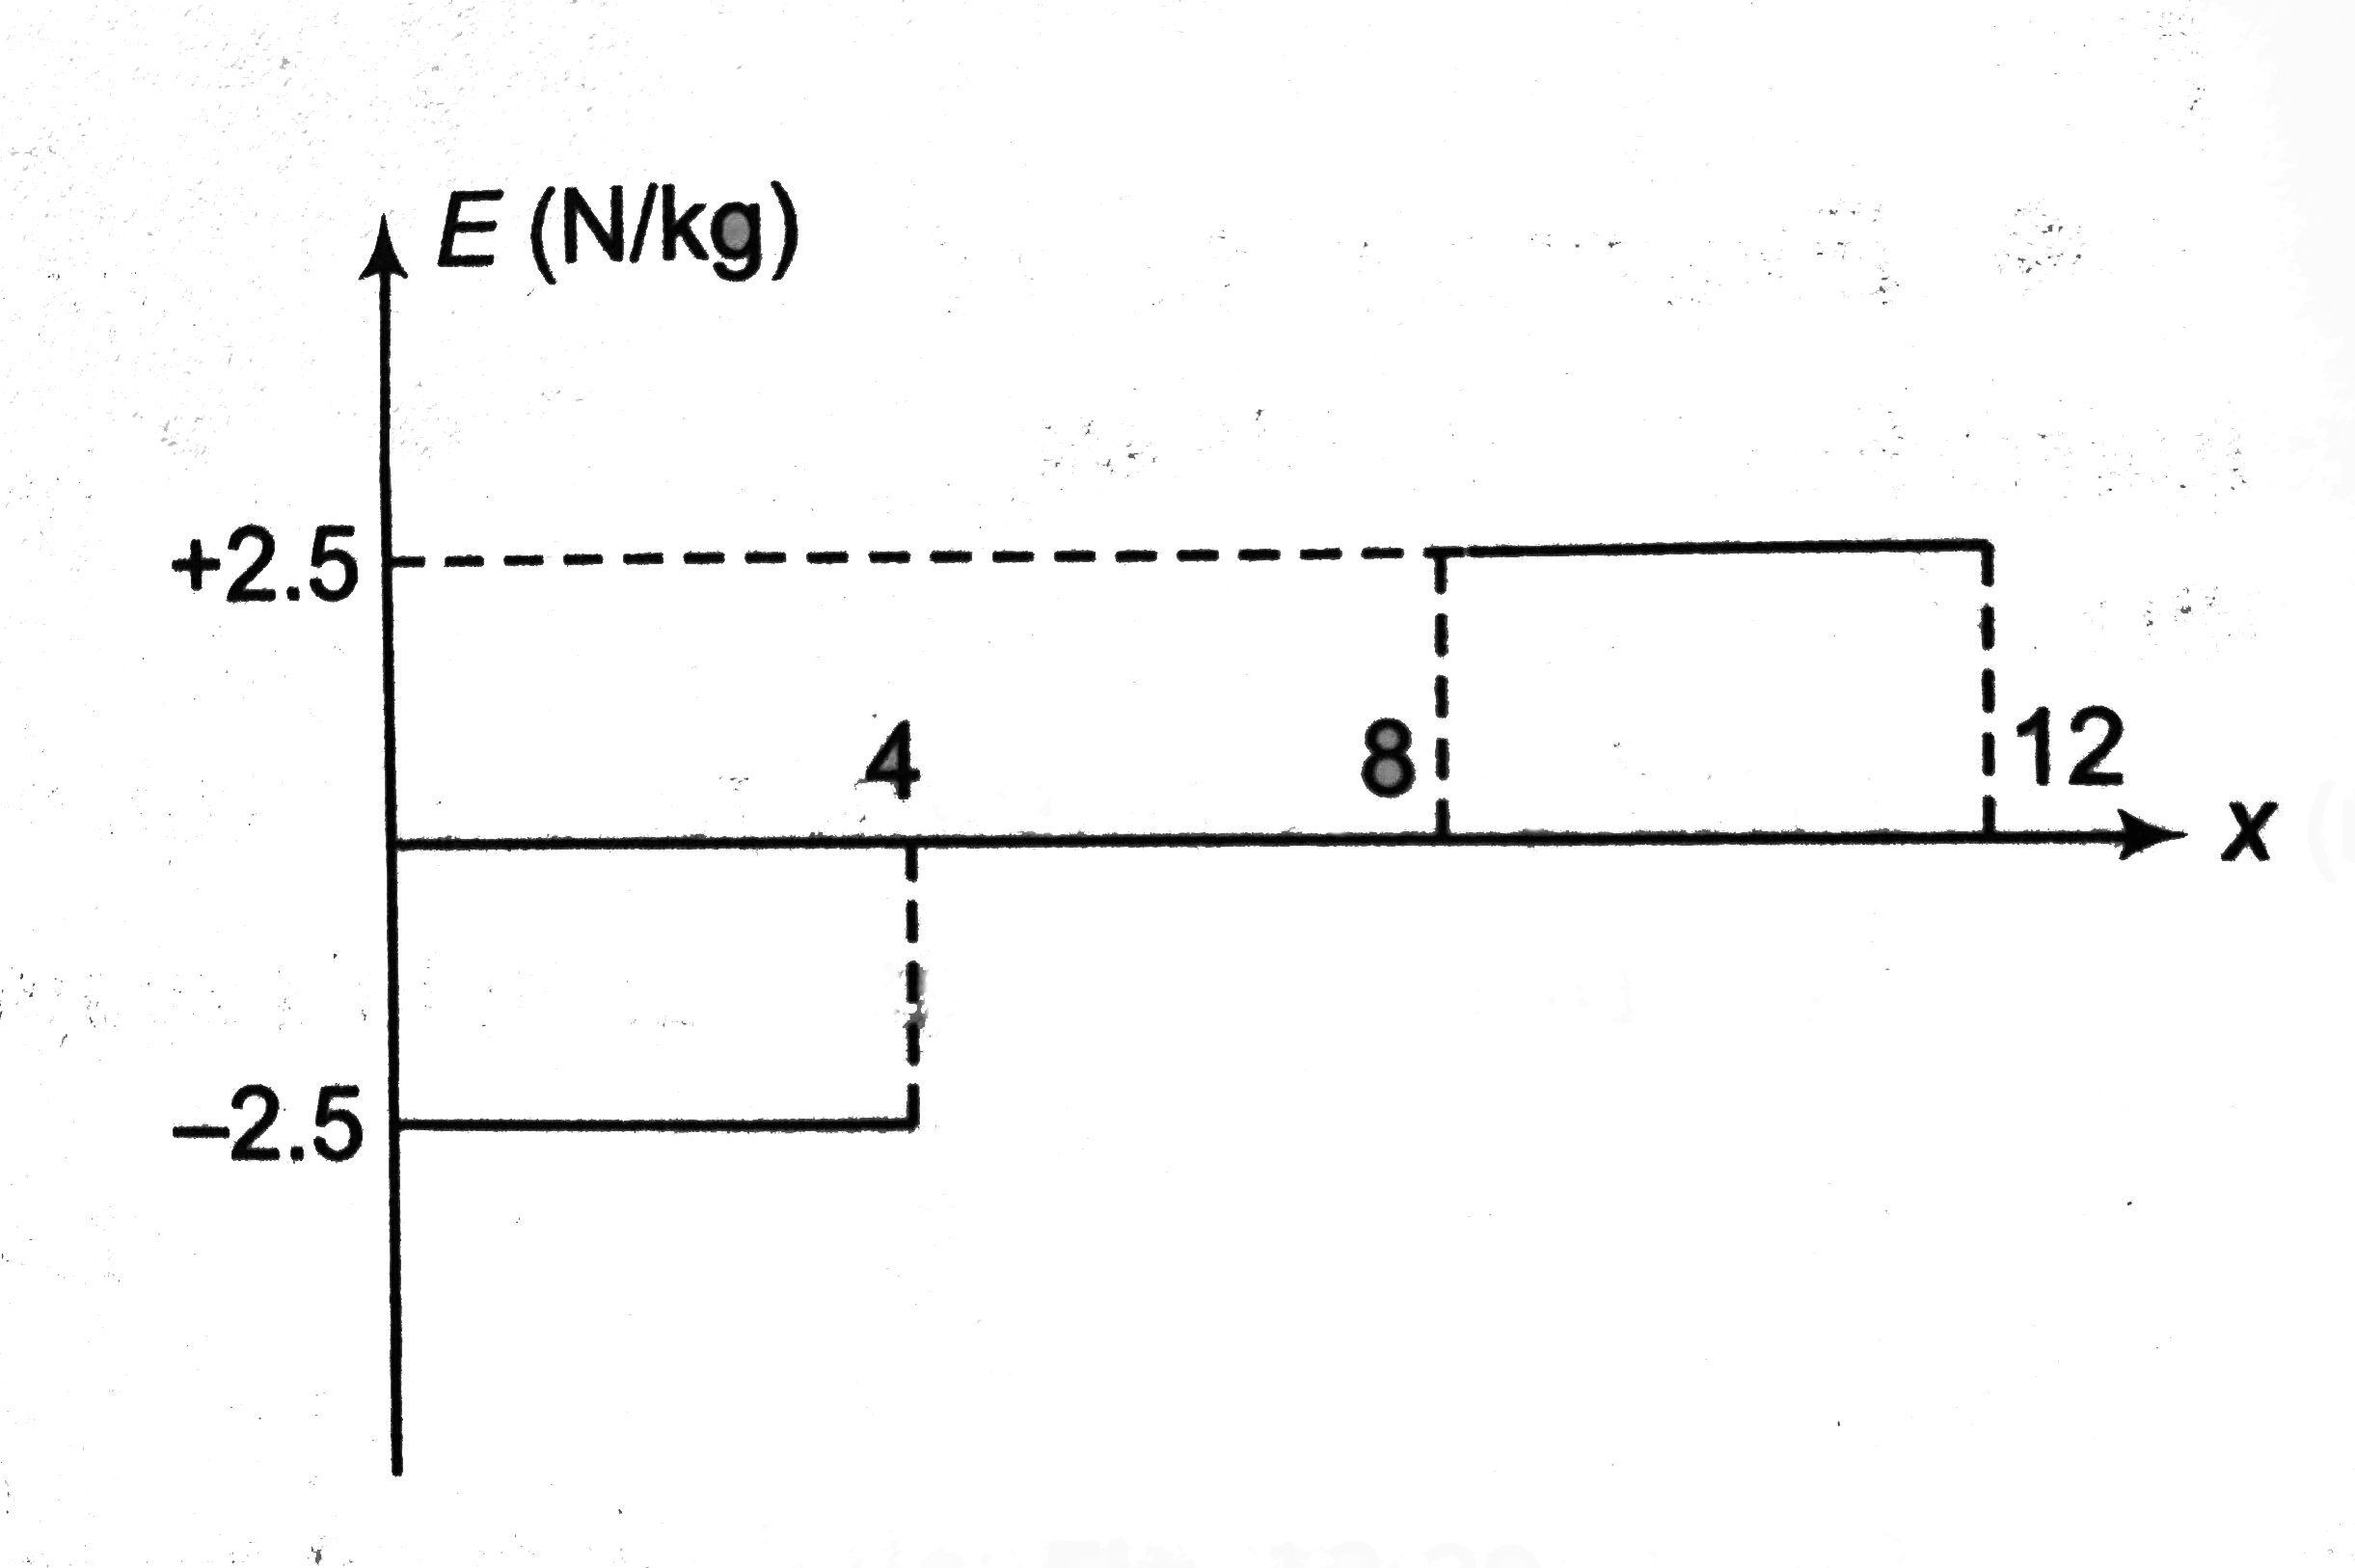 (b) At x=3m, E=−2.5N/kg
∴ Gravitational force
F=mE (as E=Fm)
(2)(−2.5)=−5N
Here, negative sign implies that this force is acting towards negative x-direction.
|
Topper's Solved these Questions
- GRAVITATIONBOOK - DC PANDEYCHAPTER - GRAVITATIONEXERCISE - Solved Examples
16 Videos
- GRAVITATIONBOOK - DC PANDEYCHAPTER - GRAVITATIONEXERCISE - Miscellaneous Examples
8 Videos
- GENERAL PHYSICSBOOK - DC PANDEYCHAPTER - GENERAL PHYSICSEXERCISE - INTEGER_TYPE
2 Videos
- KINEMATICSBOOK - DC PANDEYCHAPTER - KINEMATICSEXERCISE - INTEGER_TYPE
11 Videos
Similar Questions
Knowledge Check
The x-t equation is given as x=2t+1. The corresponding v-t graph is
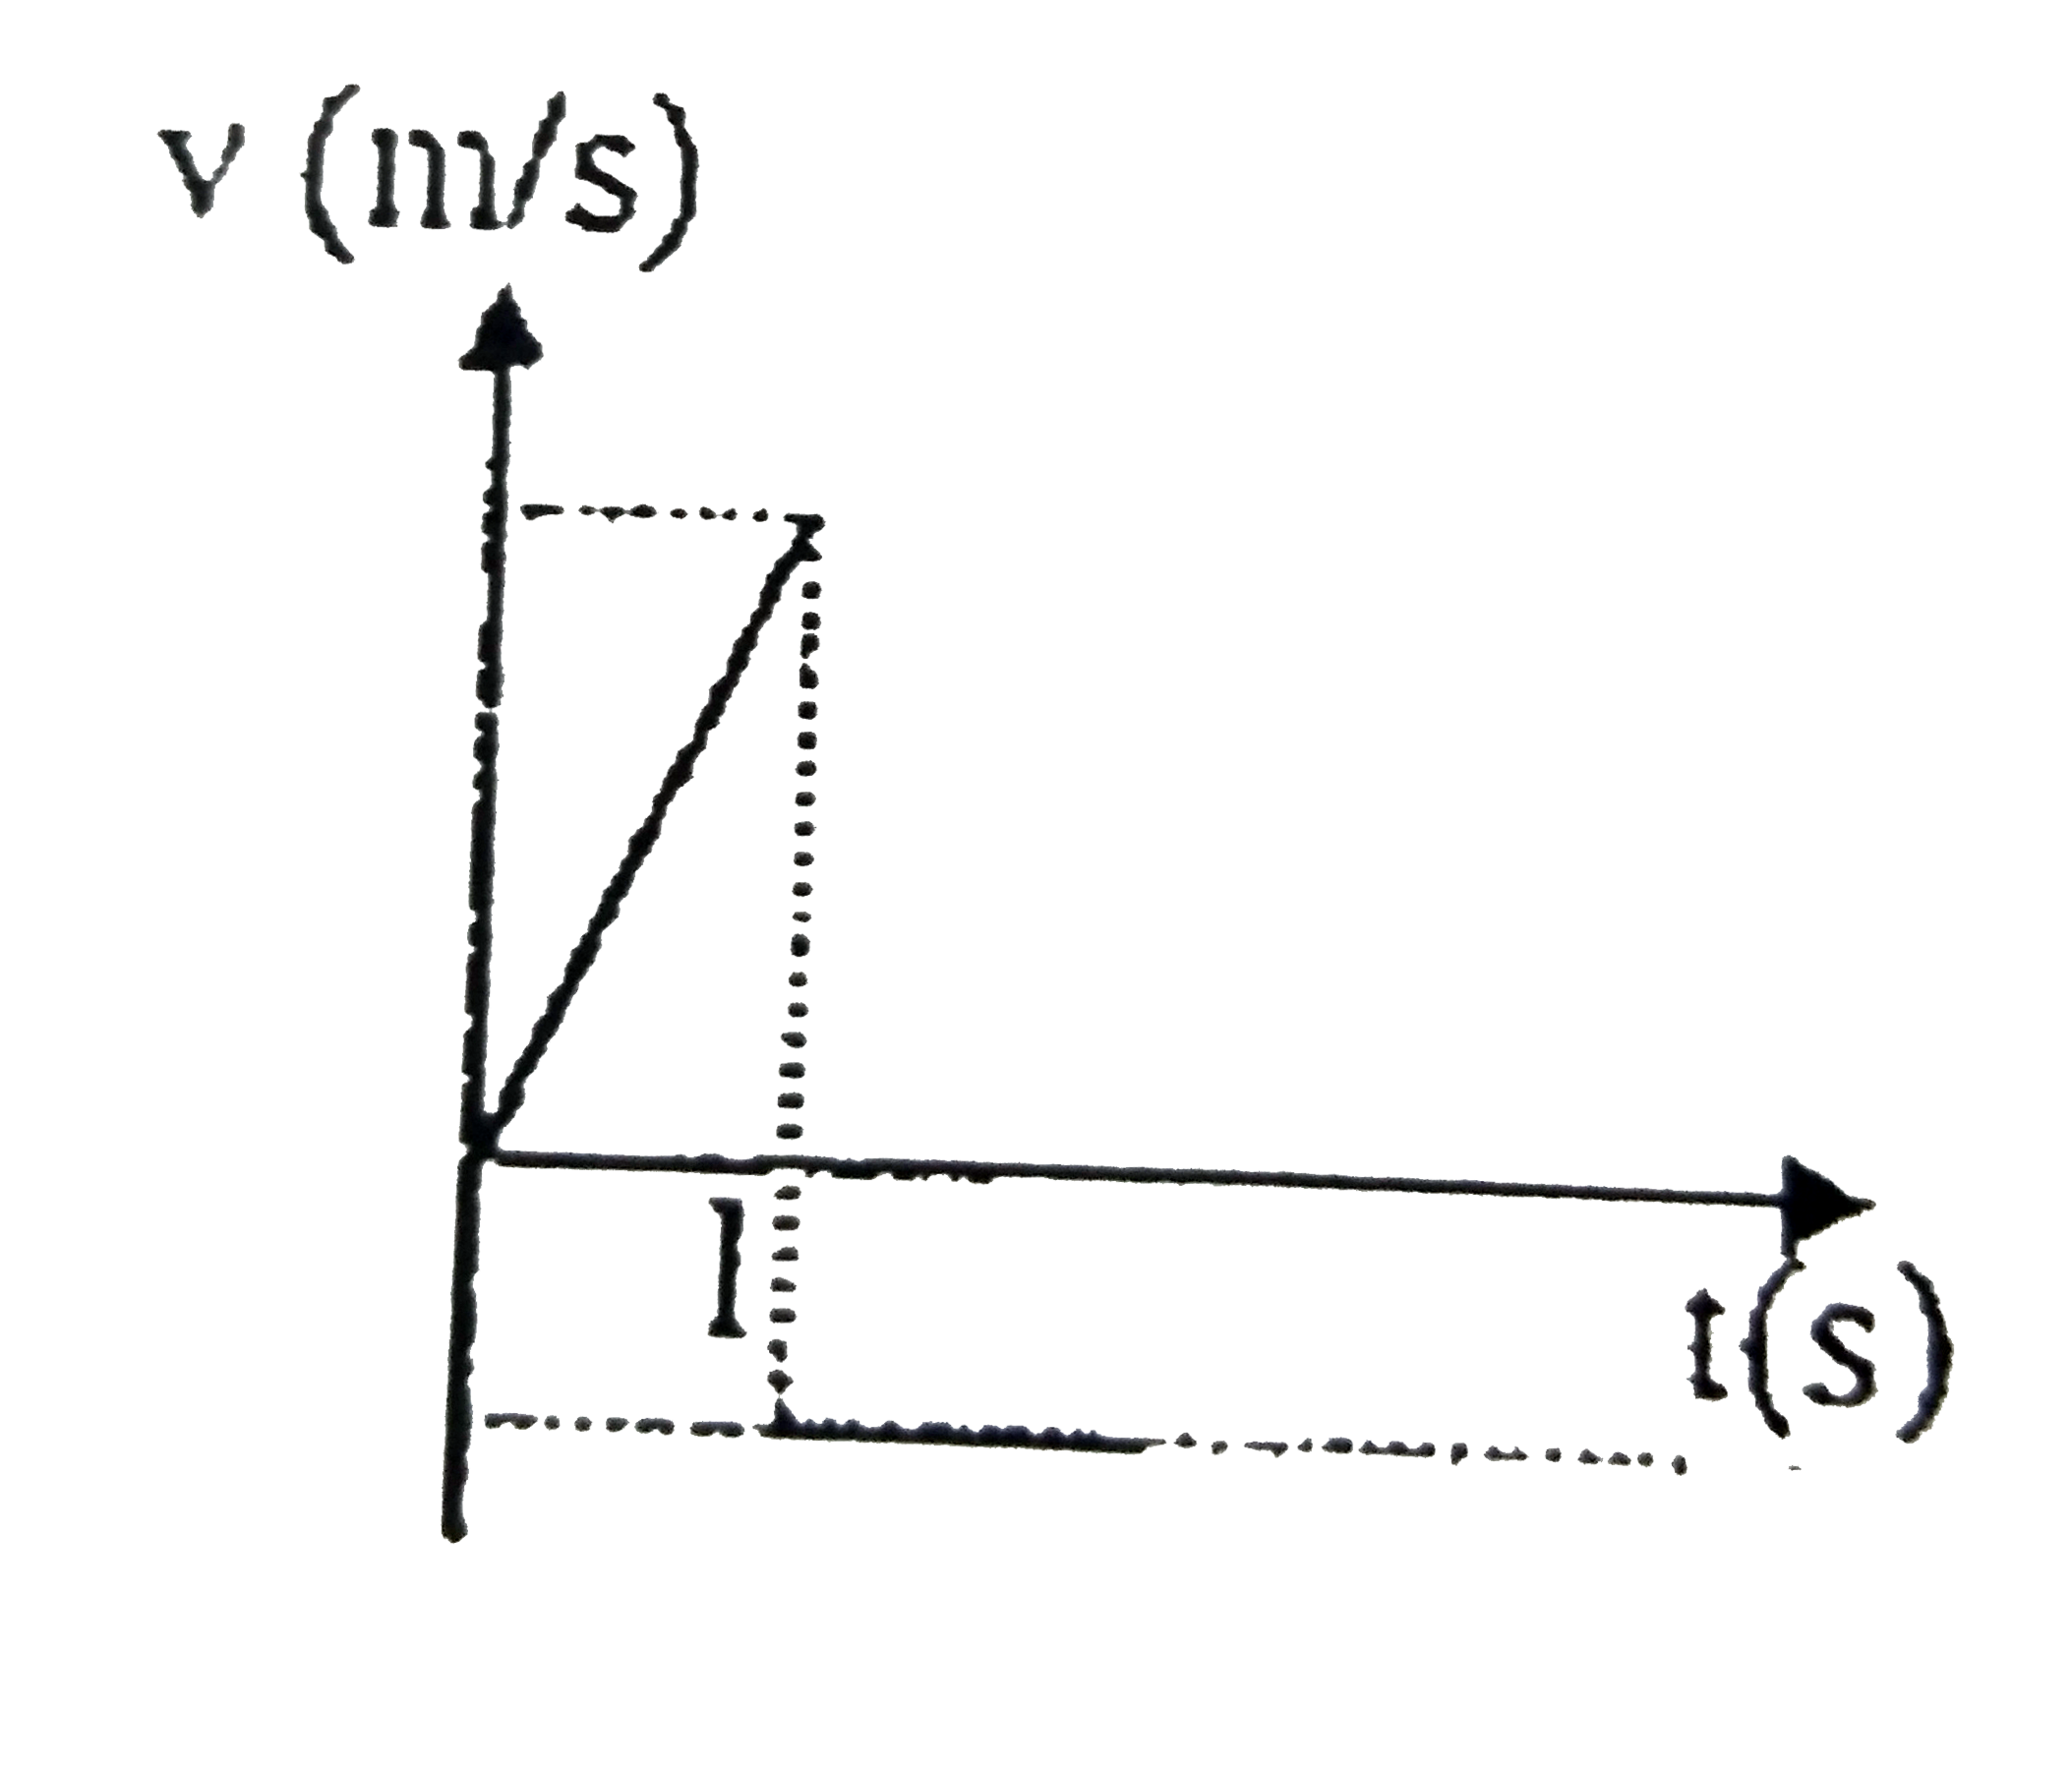
Aa straight line passing through originBa straight line not passing through originCa parabolaDNone of the aboveThe velocity time graph for a particle moving along x-axis is shown in the figure. The corresponding displacement time graph is correctly shown by
 A
A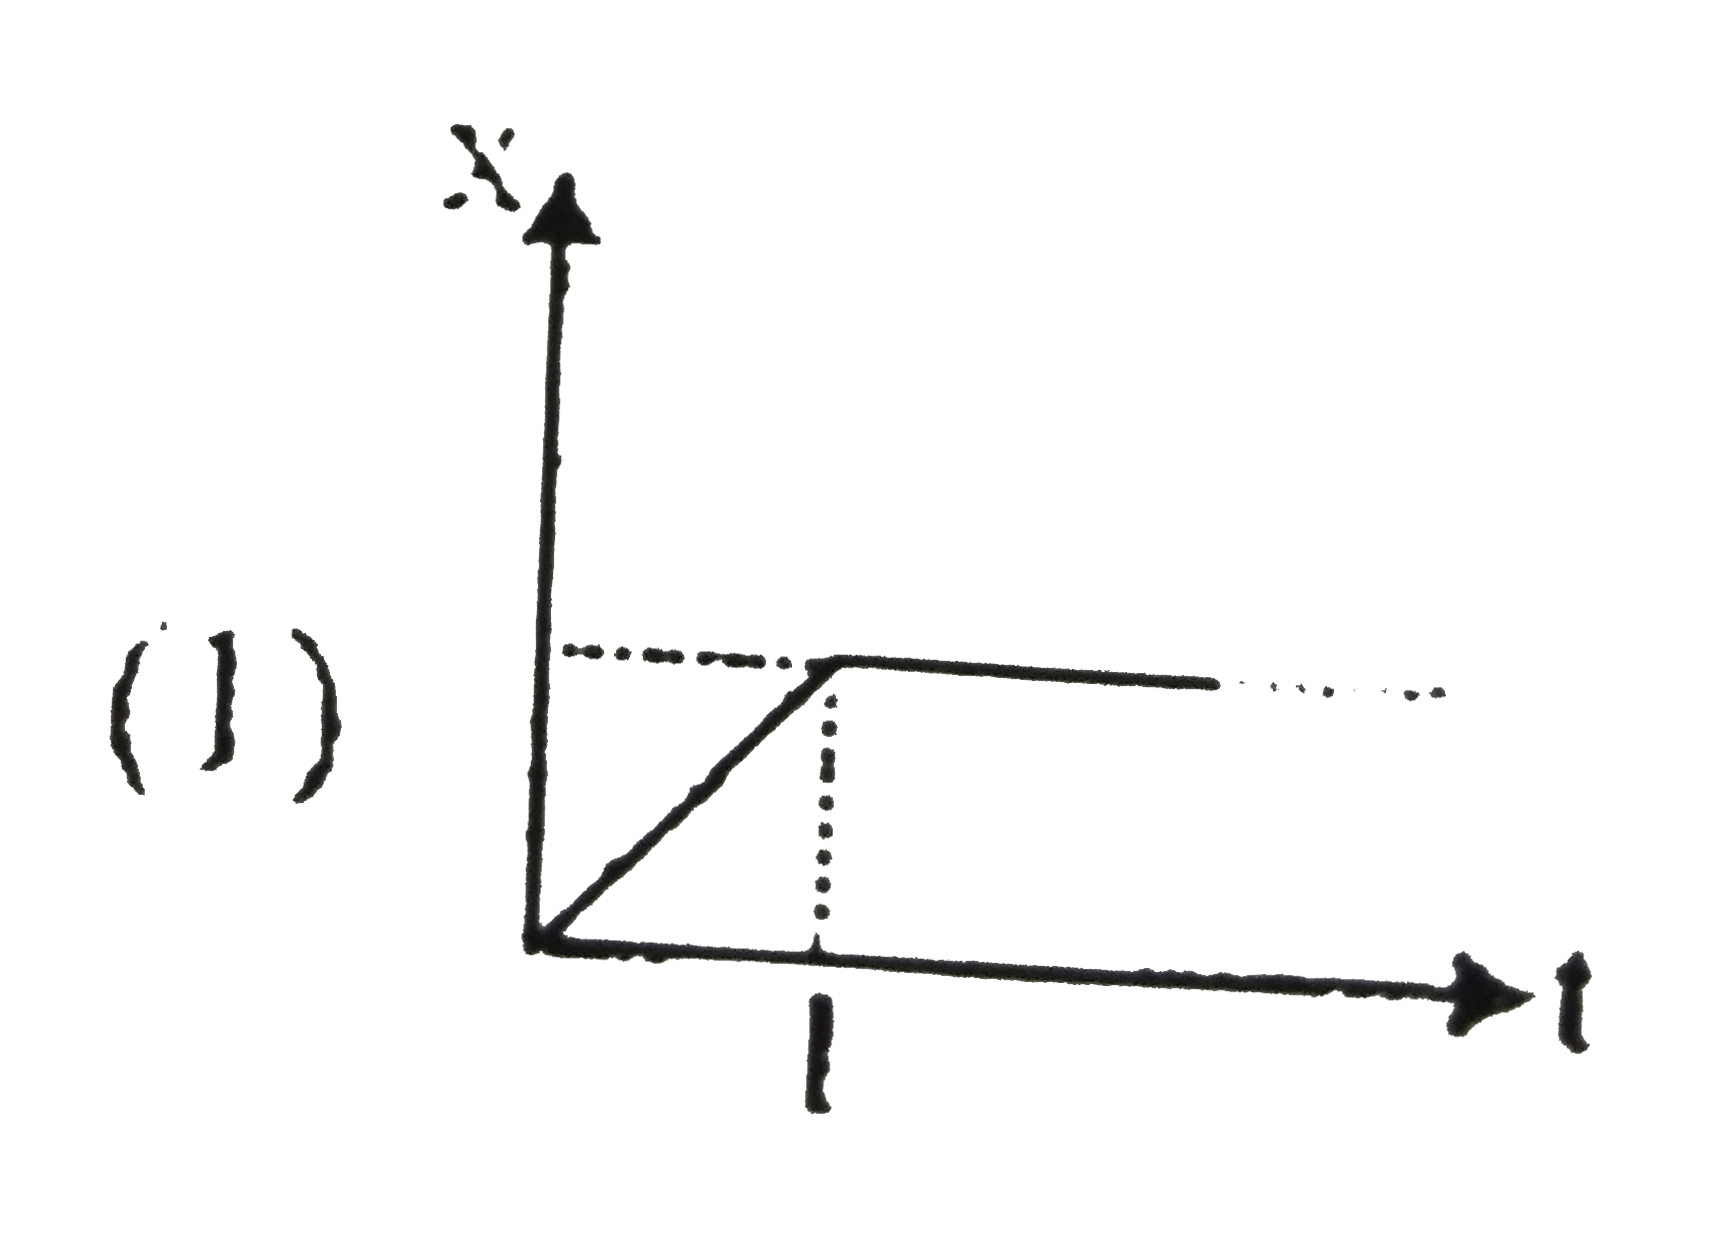 B
B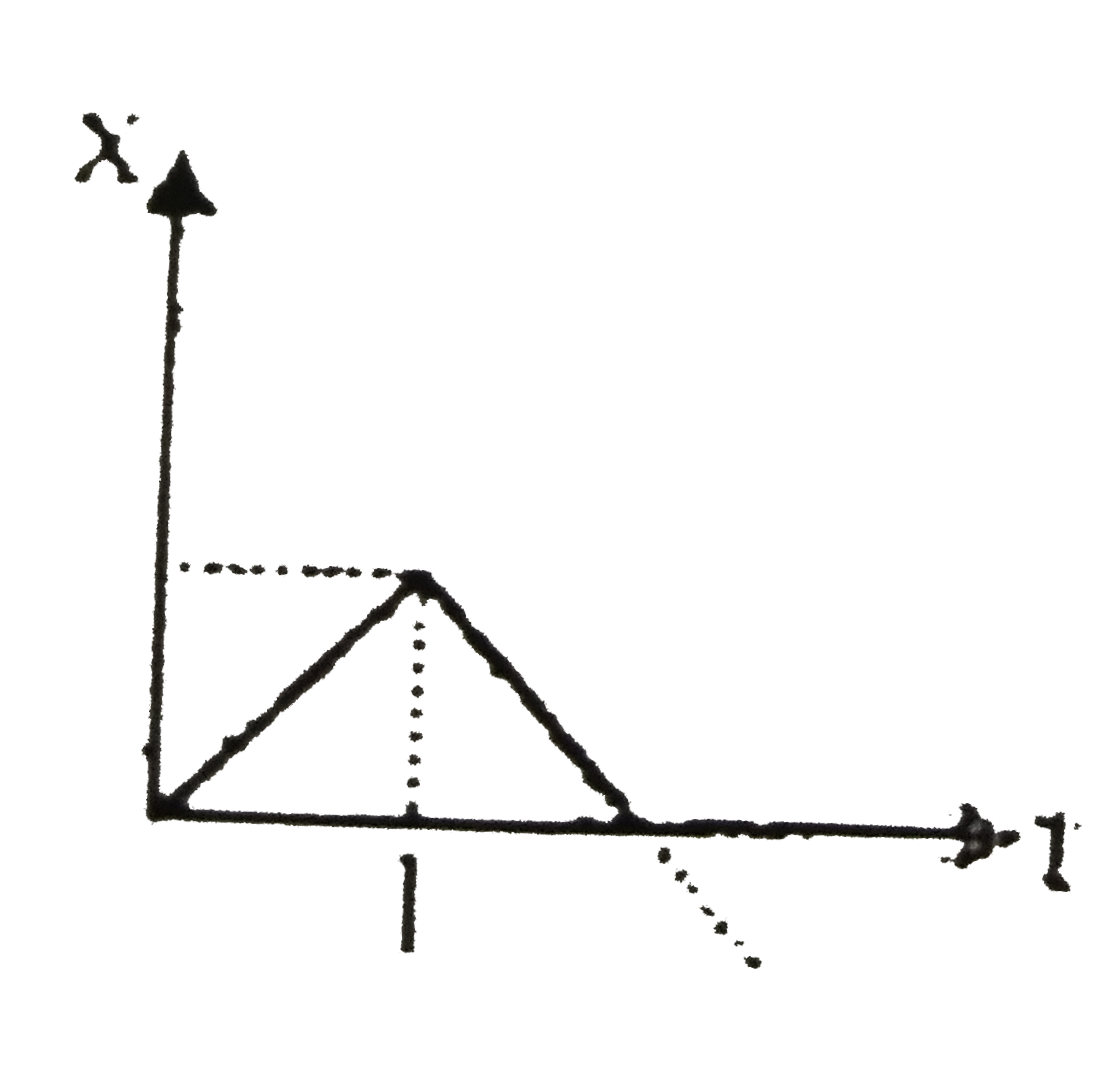 C
C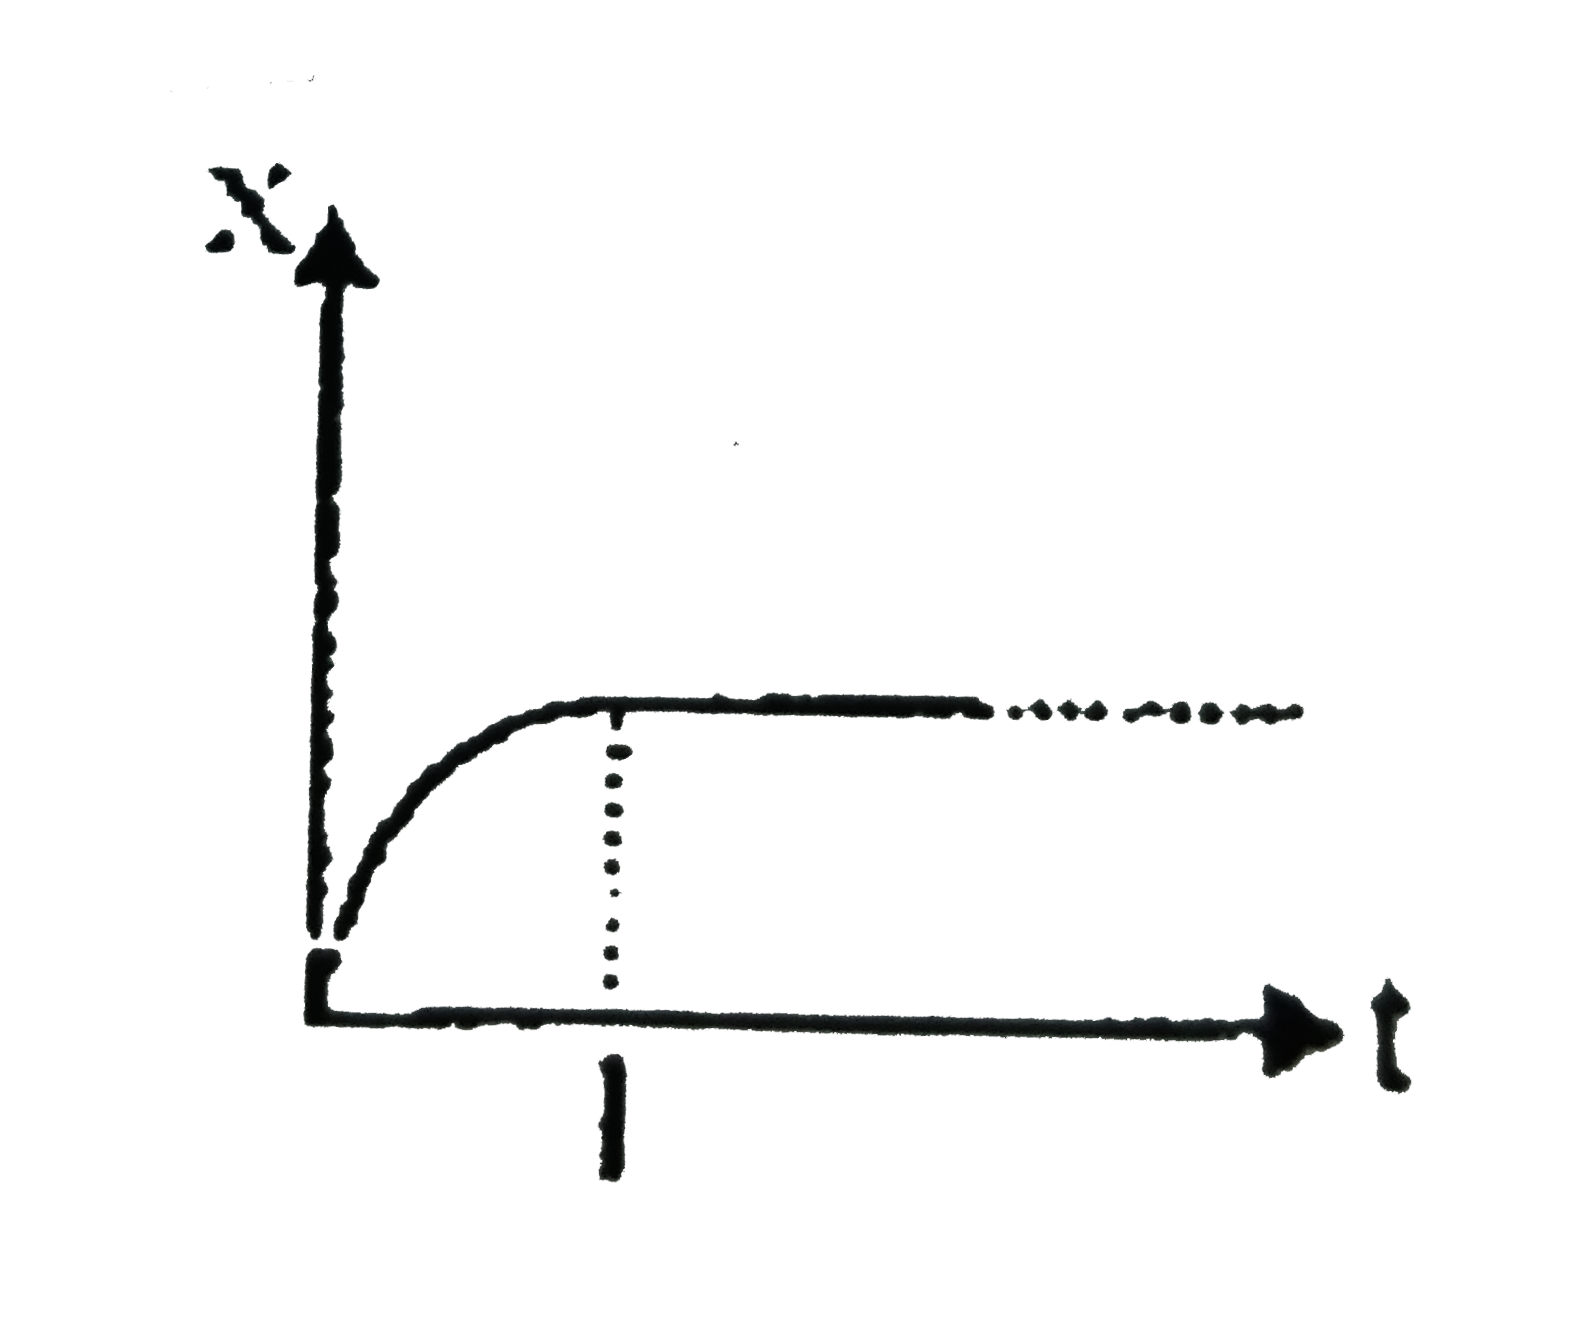 D
D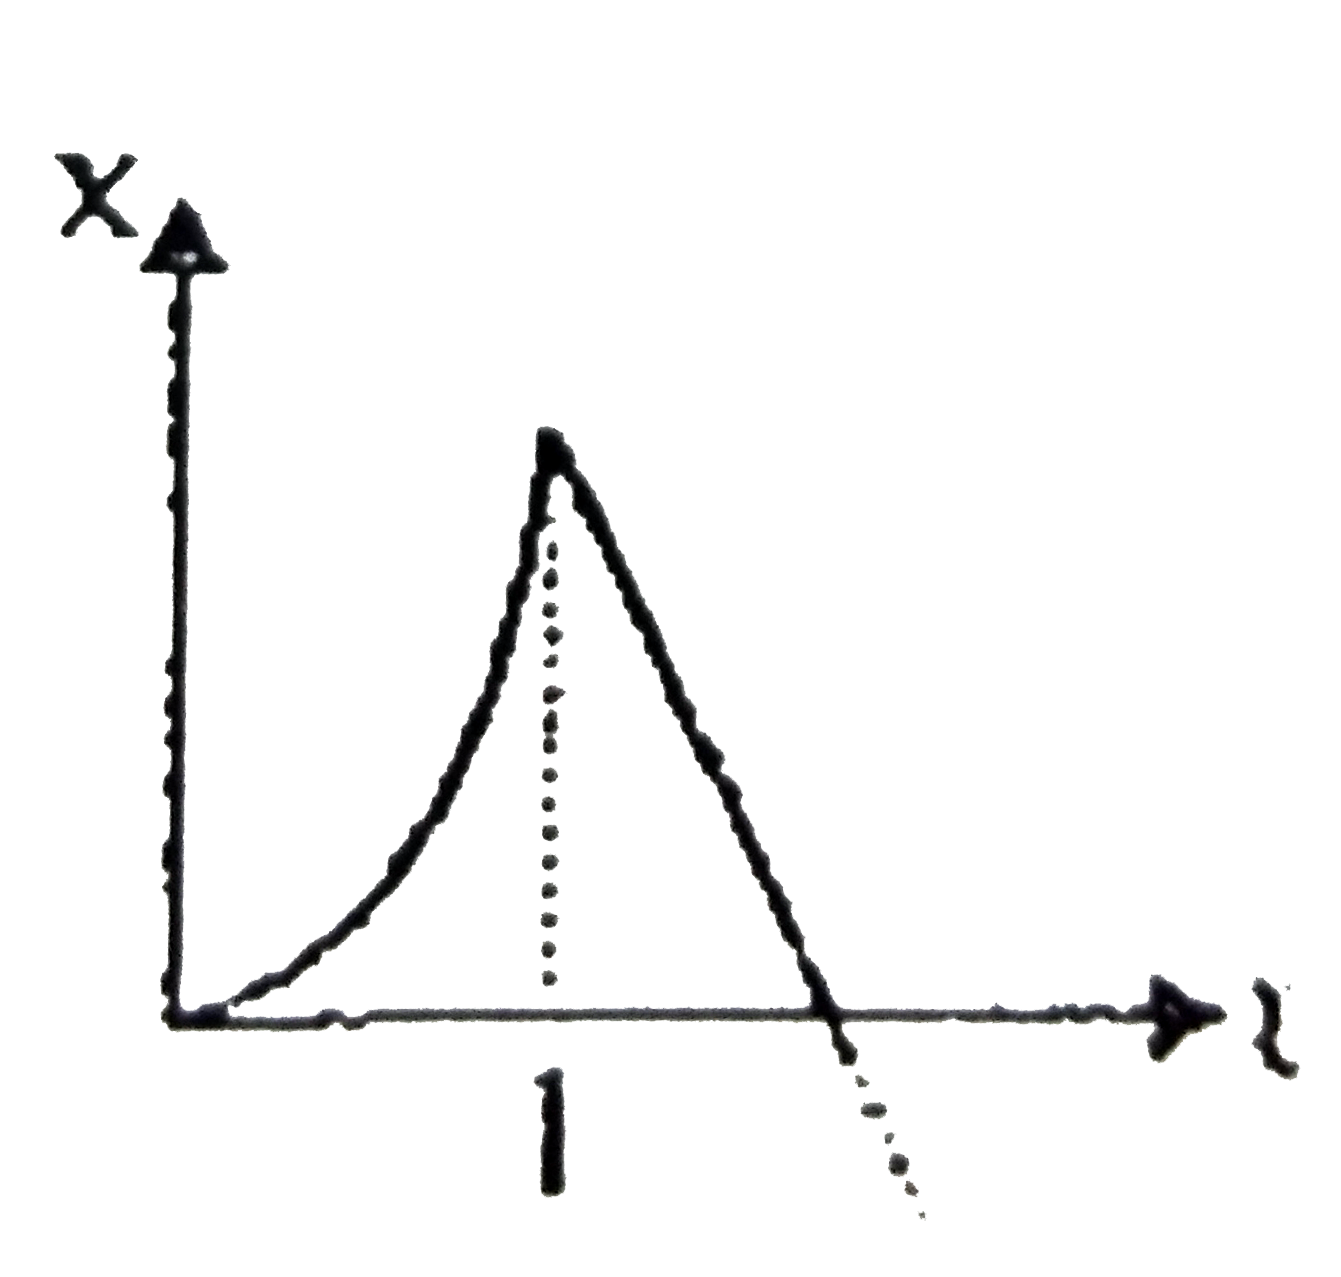
The velocity time graph for a particle moving along X-axis is shown in the figure. The corresponding displacement time graph is correctly shown by
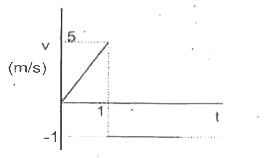 A
A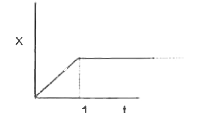 B
B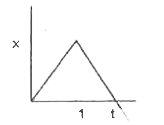 C
C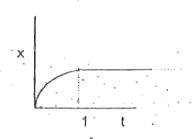 D
D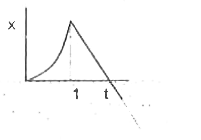
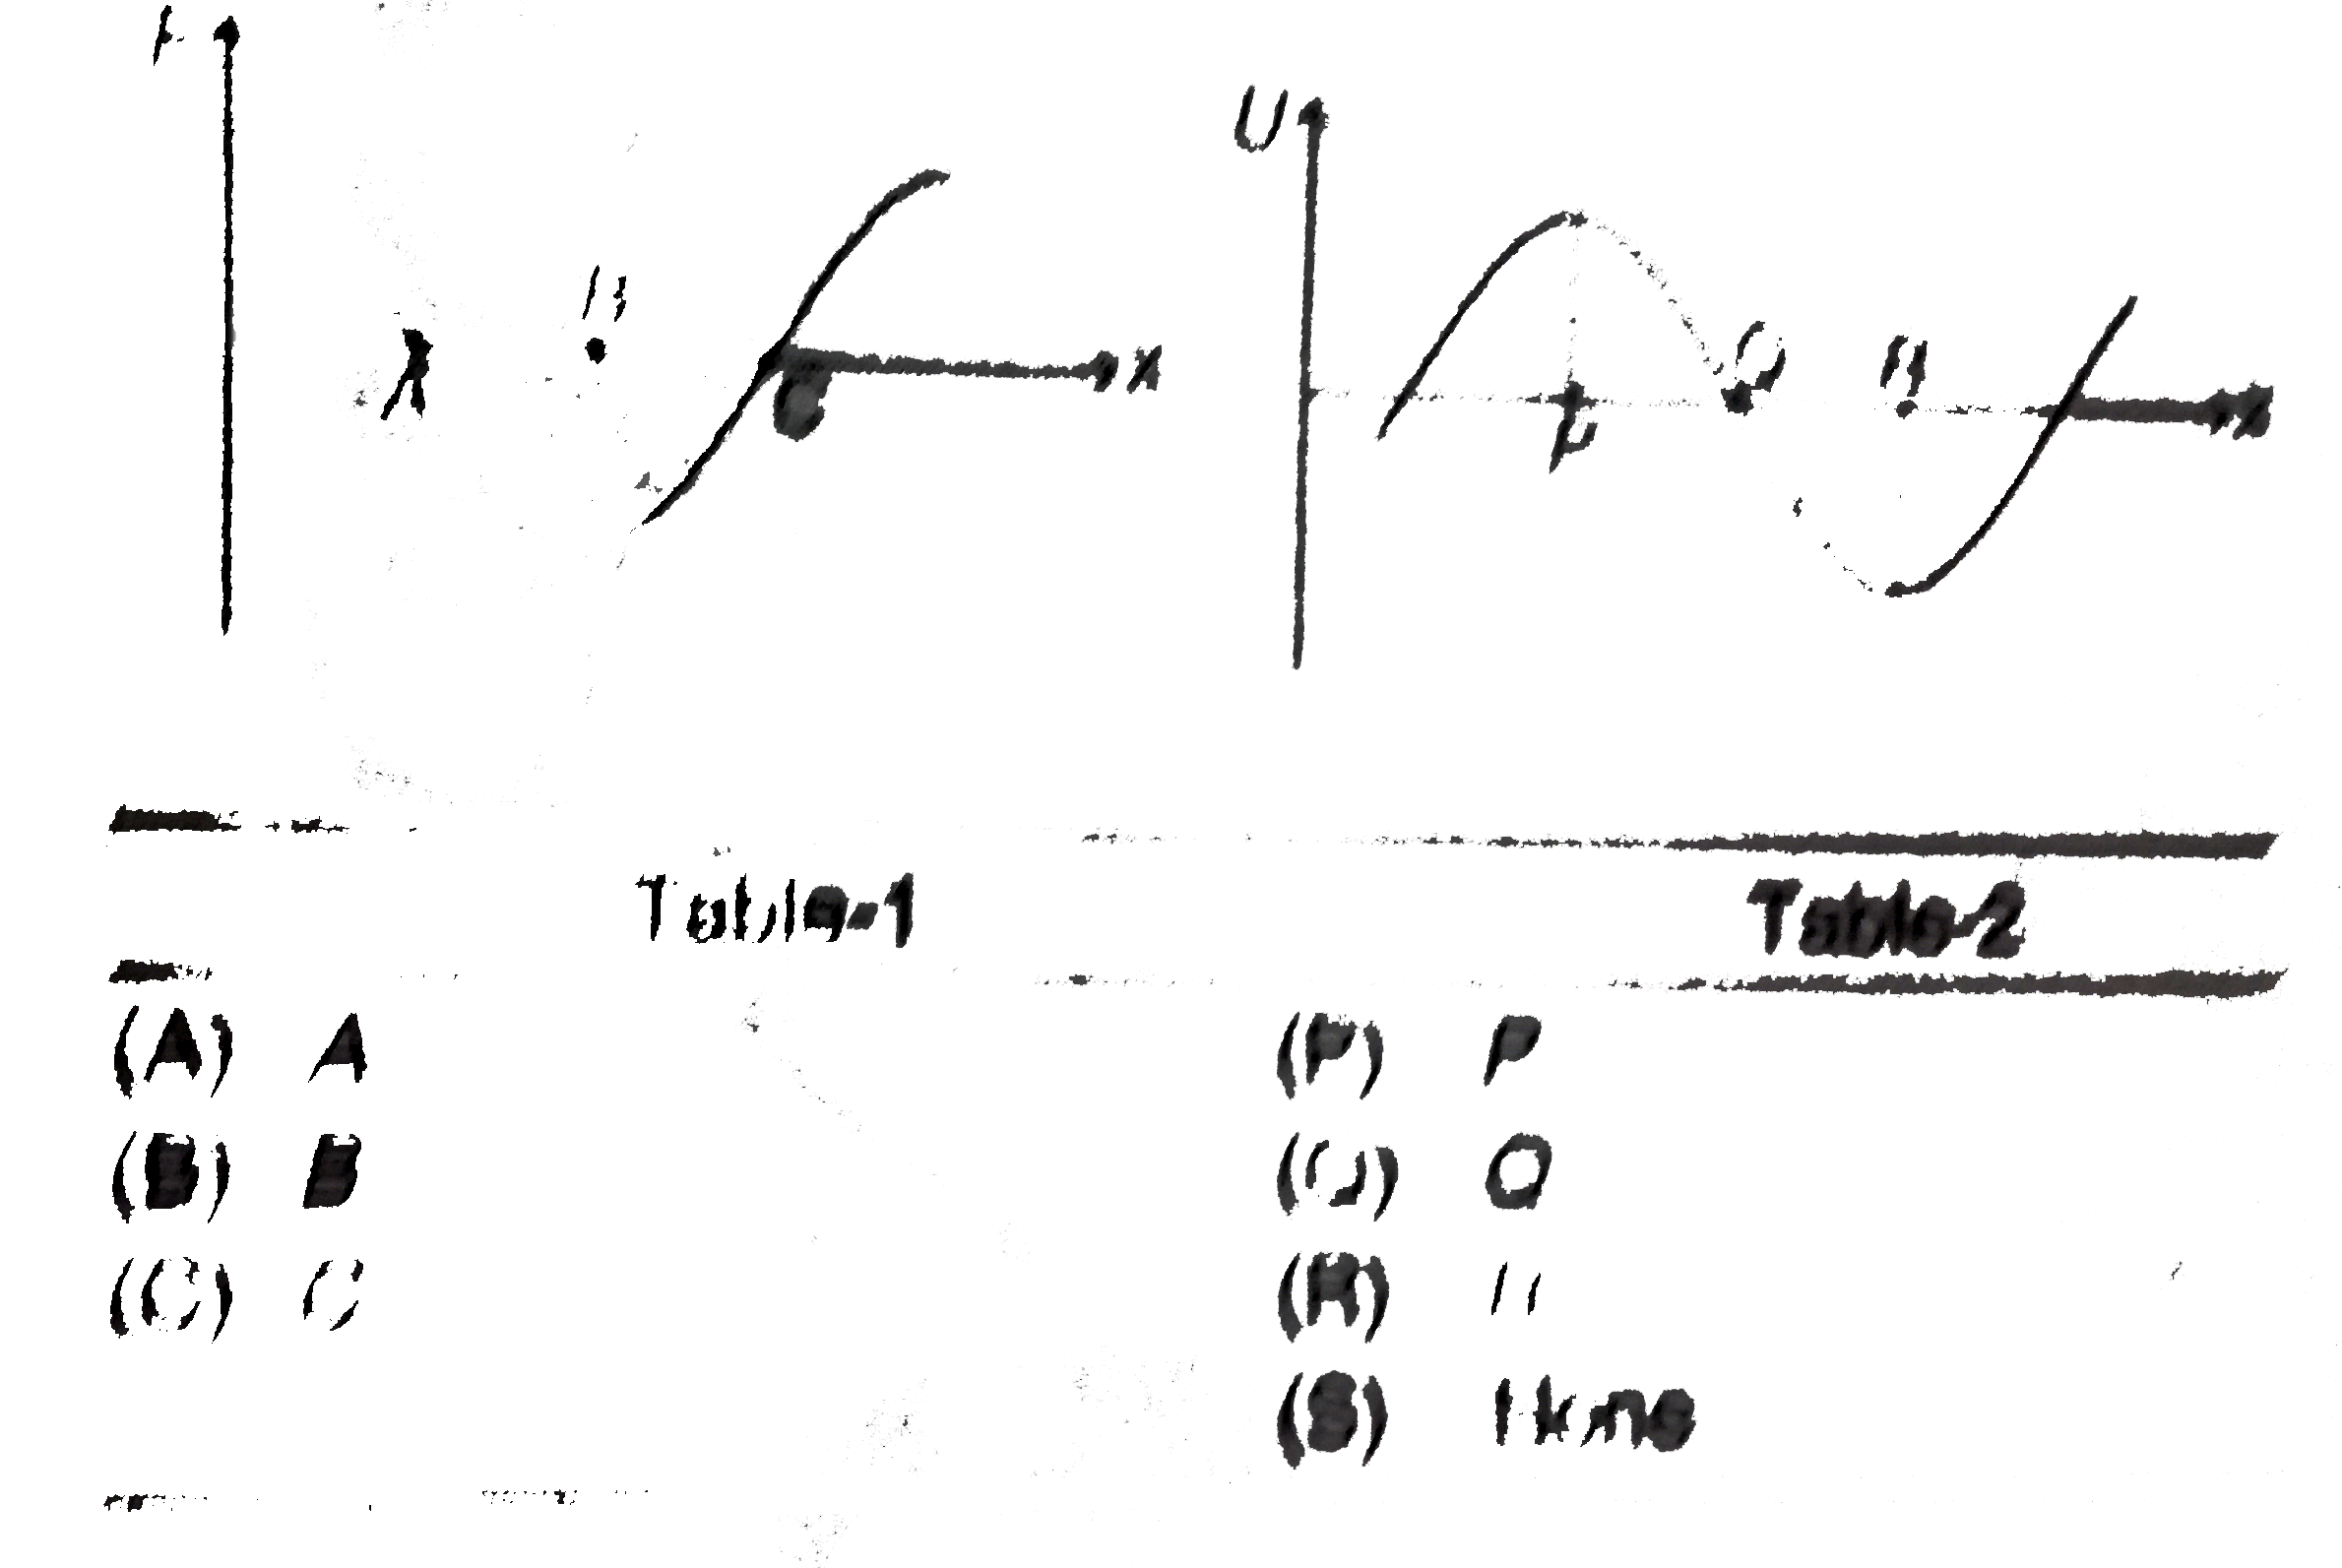
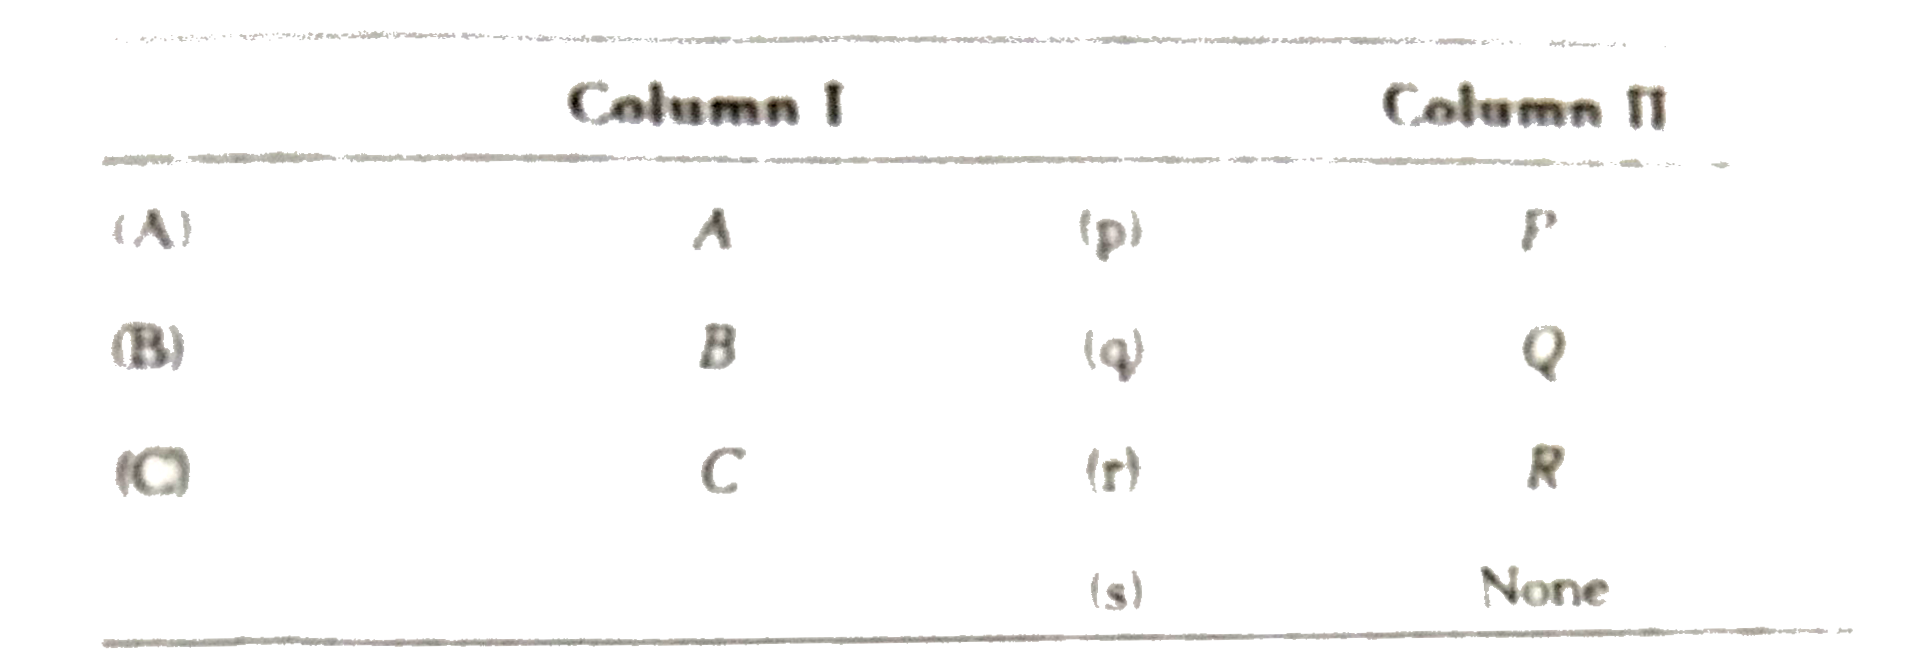
F-x and corresponding U-x graph are as shown in figures. Three points A,B and C in F-x graph may be corresponding to P,Q and R in the U-x graph. Match the following.

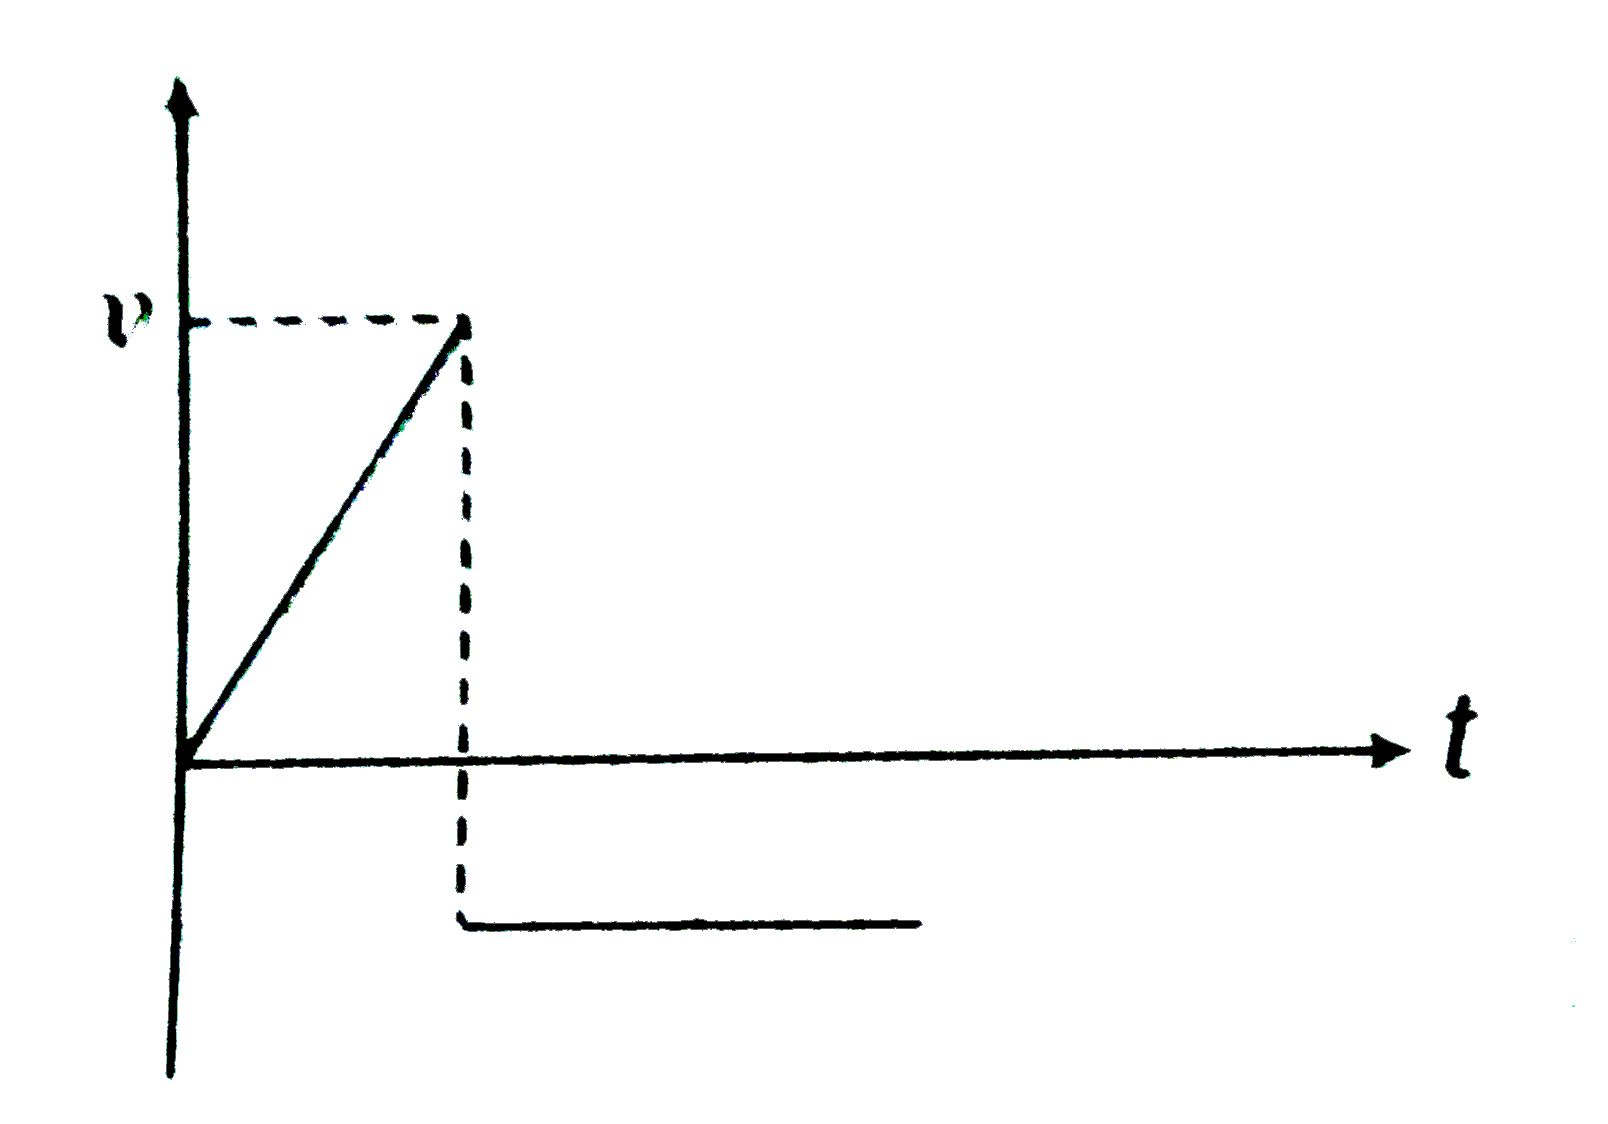
View SolutionThe velocity-time graph for a particle moving along X-axis is shown in the figure. The corresponding displacement-time graph is correctly shown by
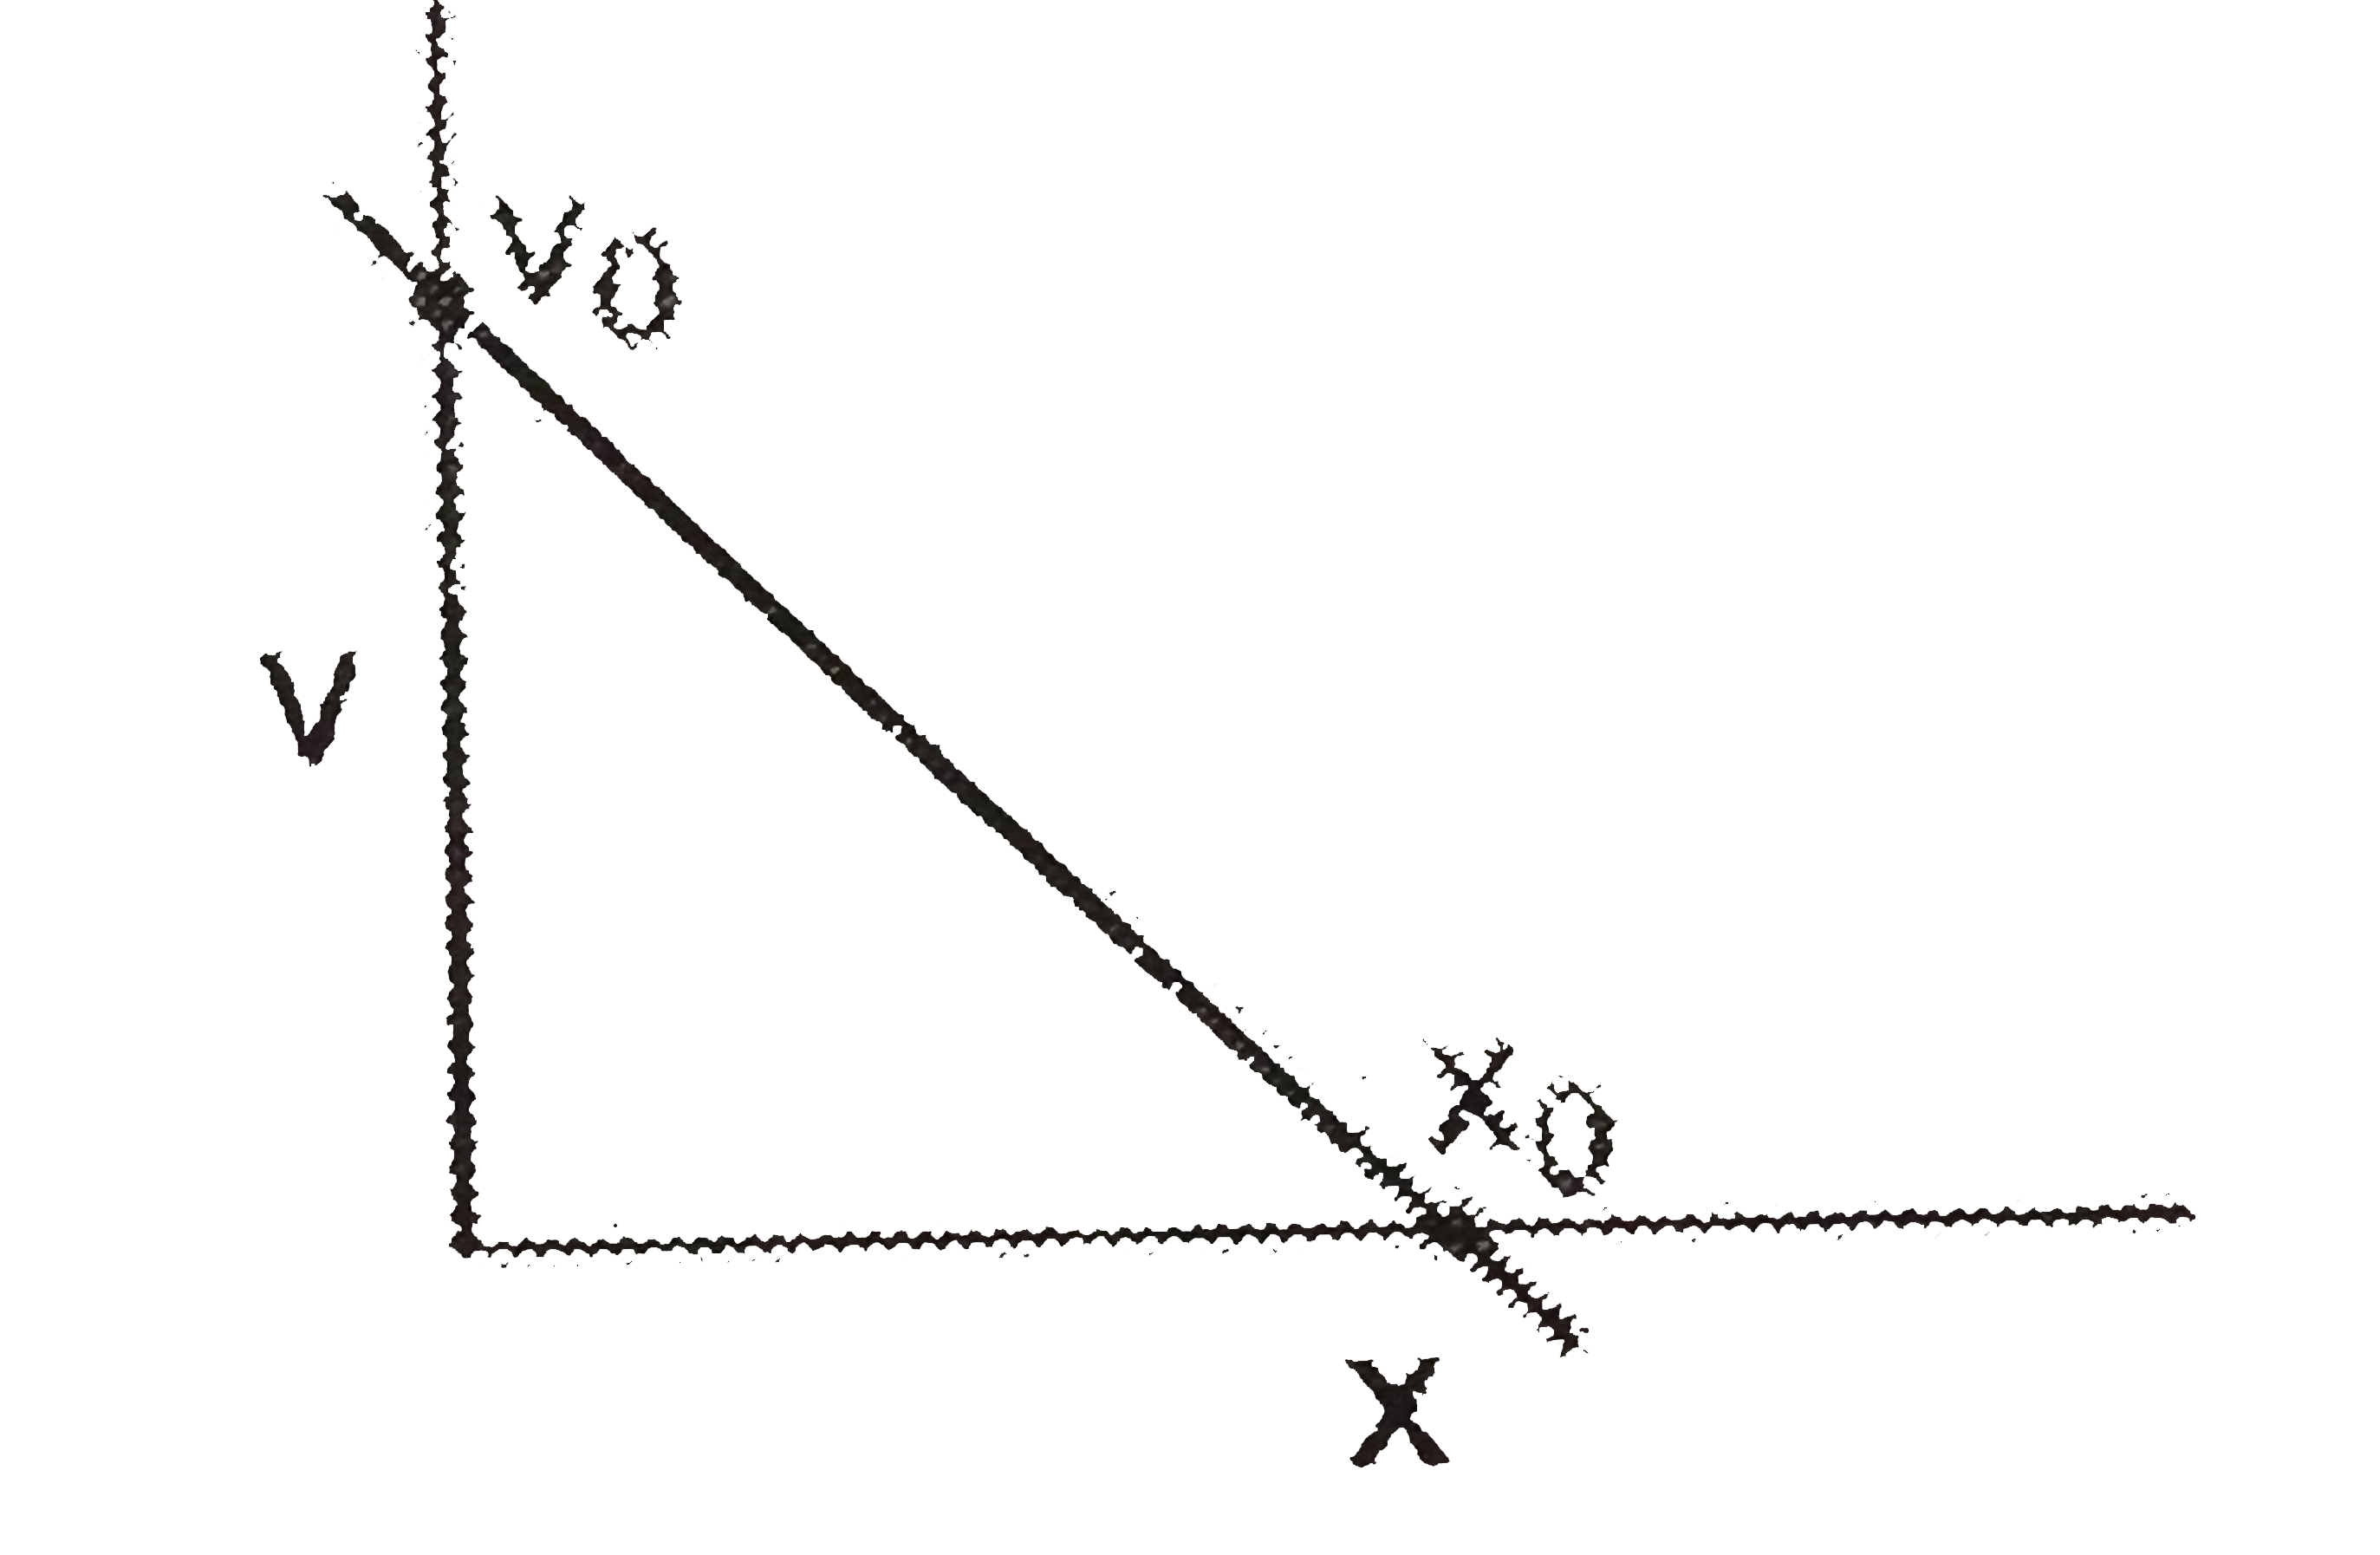
View SolutionDepict the shown v−x graph a−x graph:
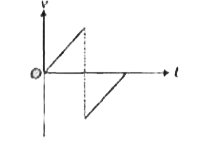
View SolutionThe velocity (v) - time (t) graph for a particle moving along x - axis is shown in the figure. The corresponding position (x) - time (t) is best represented by
View SolutionA particle is moving along x-axis. Its x-coordinate versus time graph is as shown below.
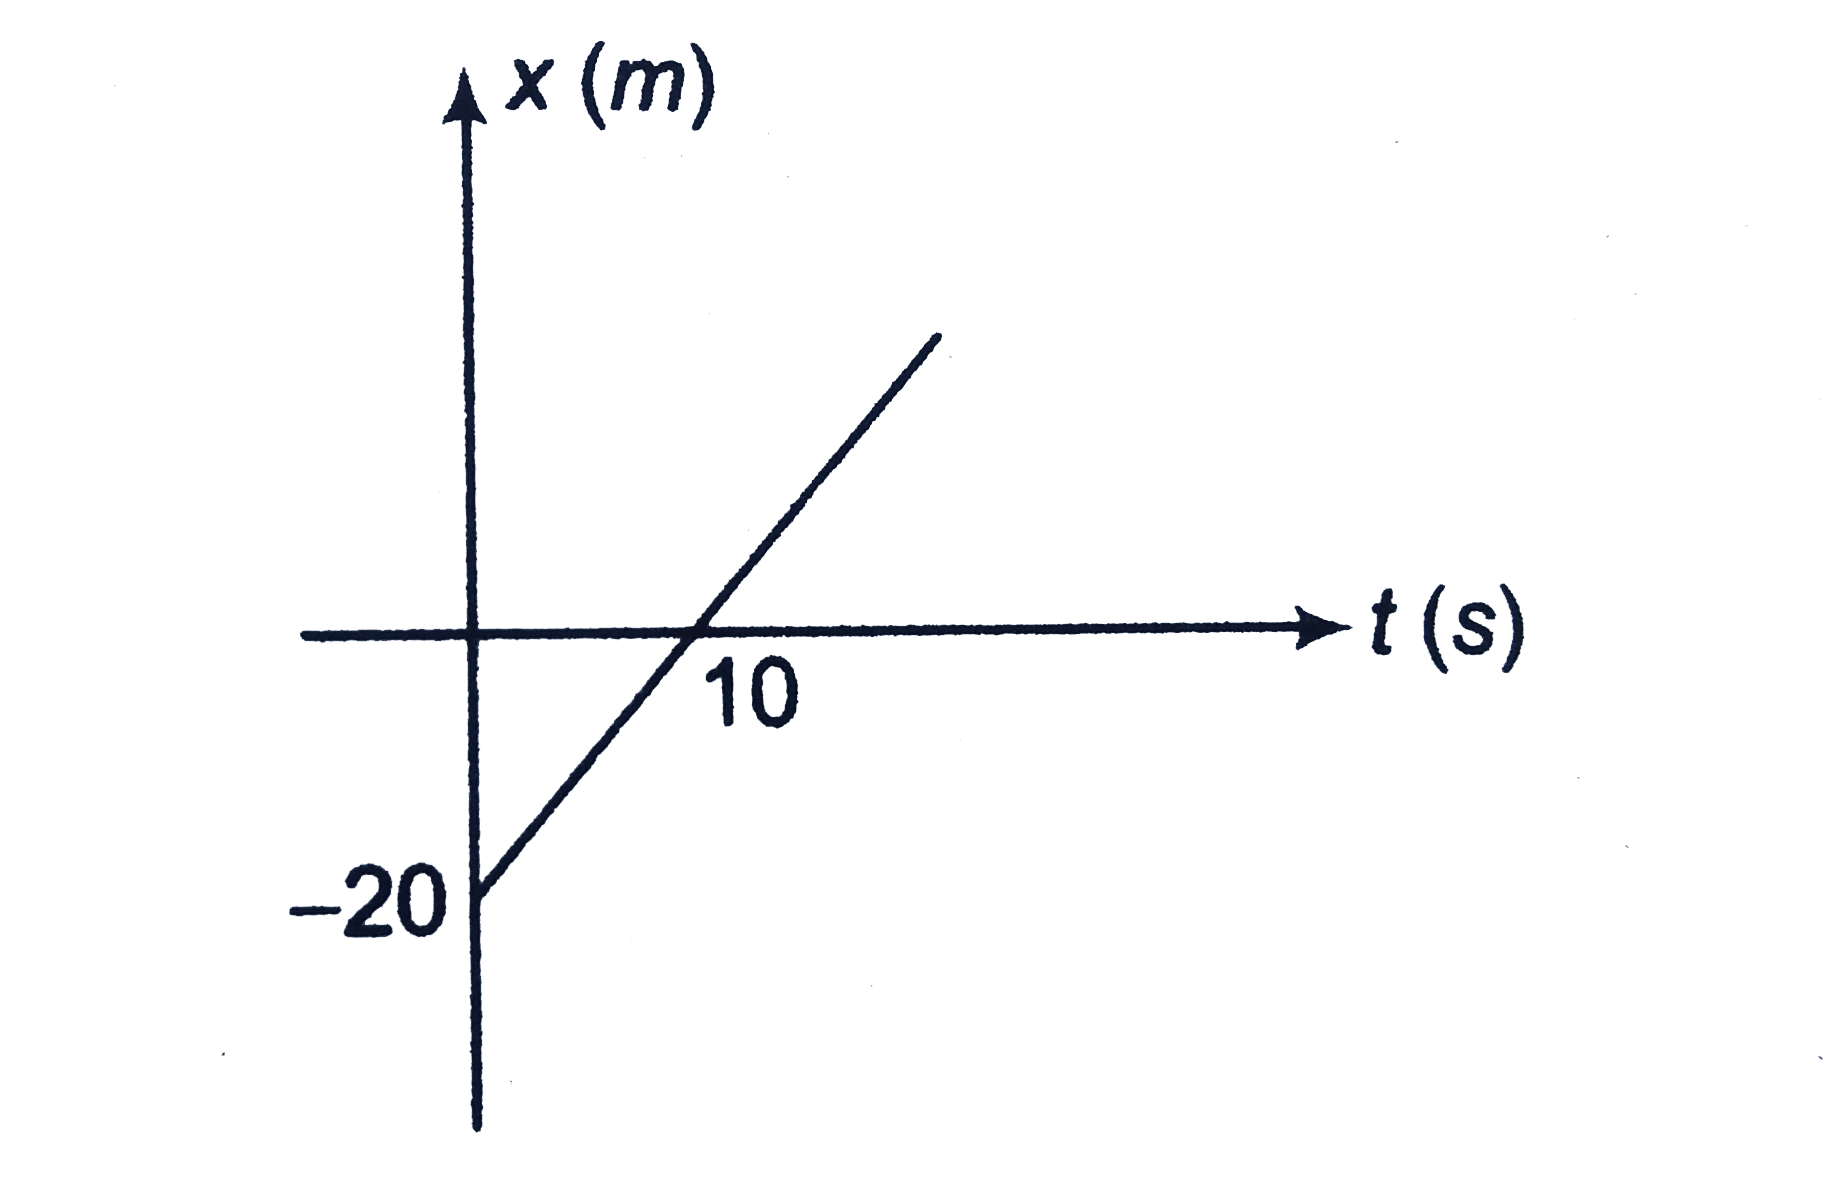 Draw some conclusion from the given graph.
View Solution

