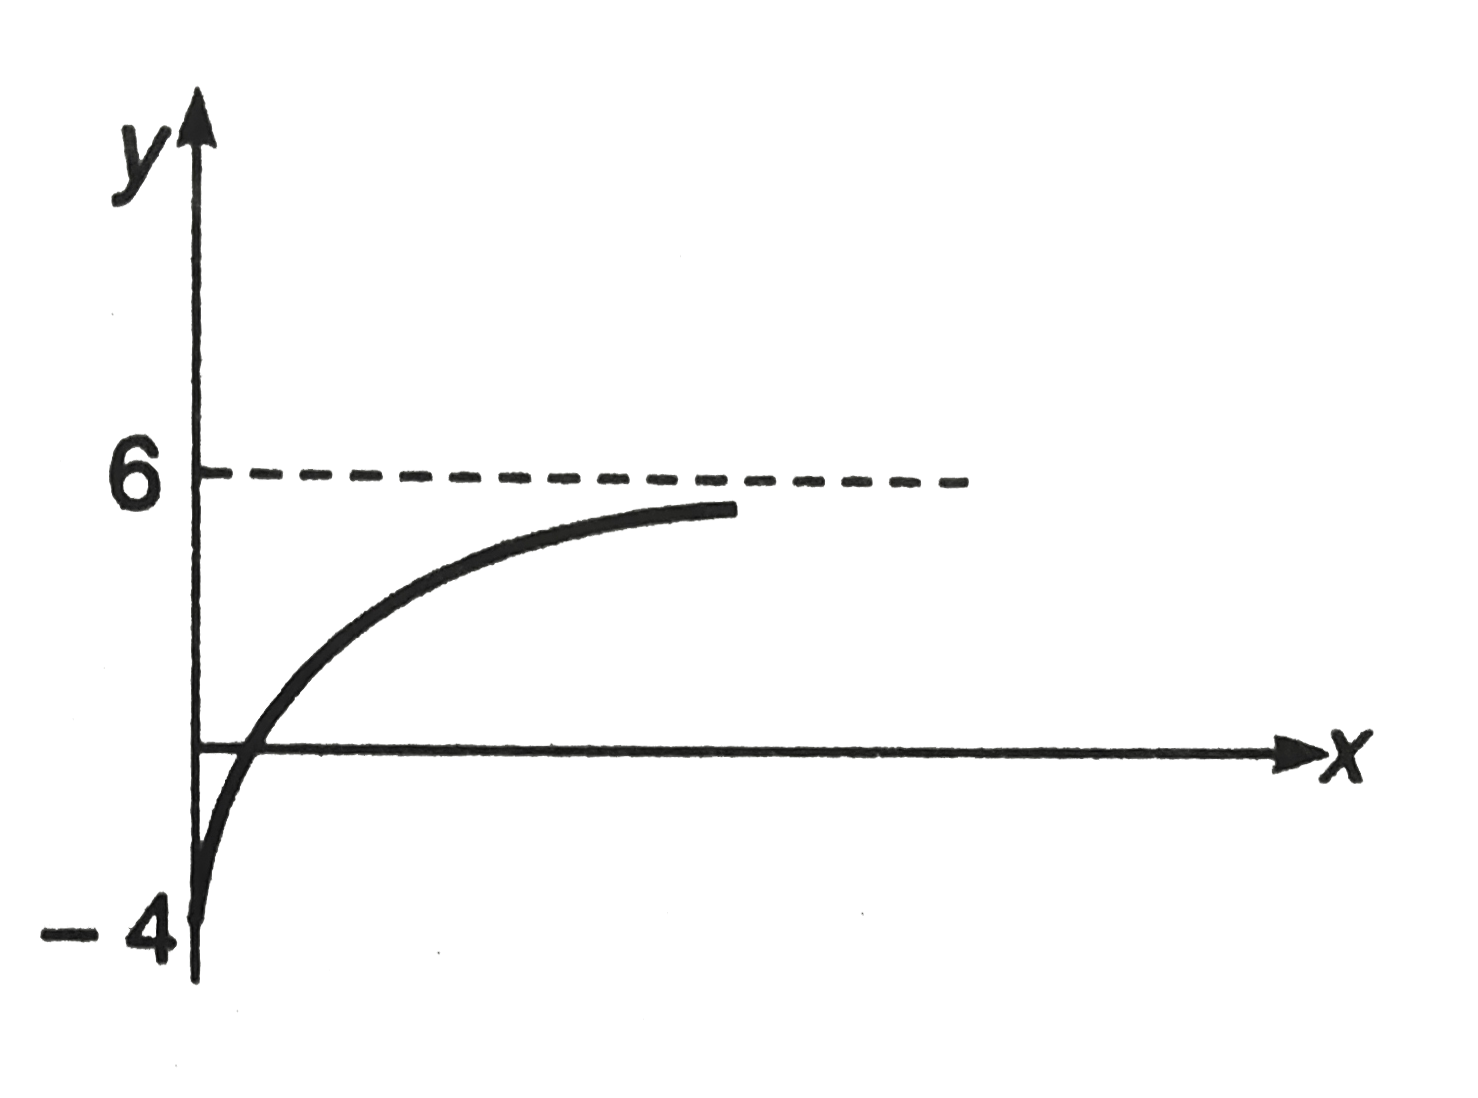
The graph shown in figure is exponential. Write down the equation corresponding to the graph.
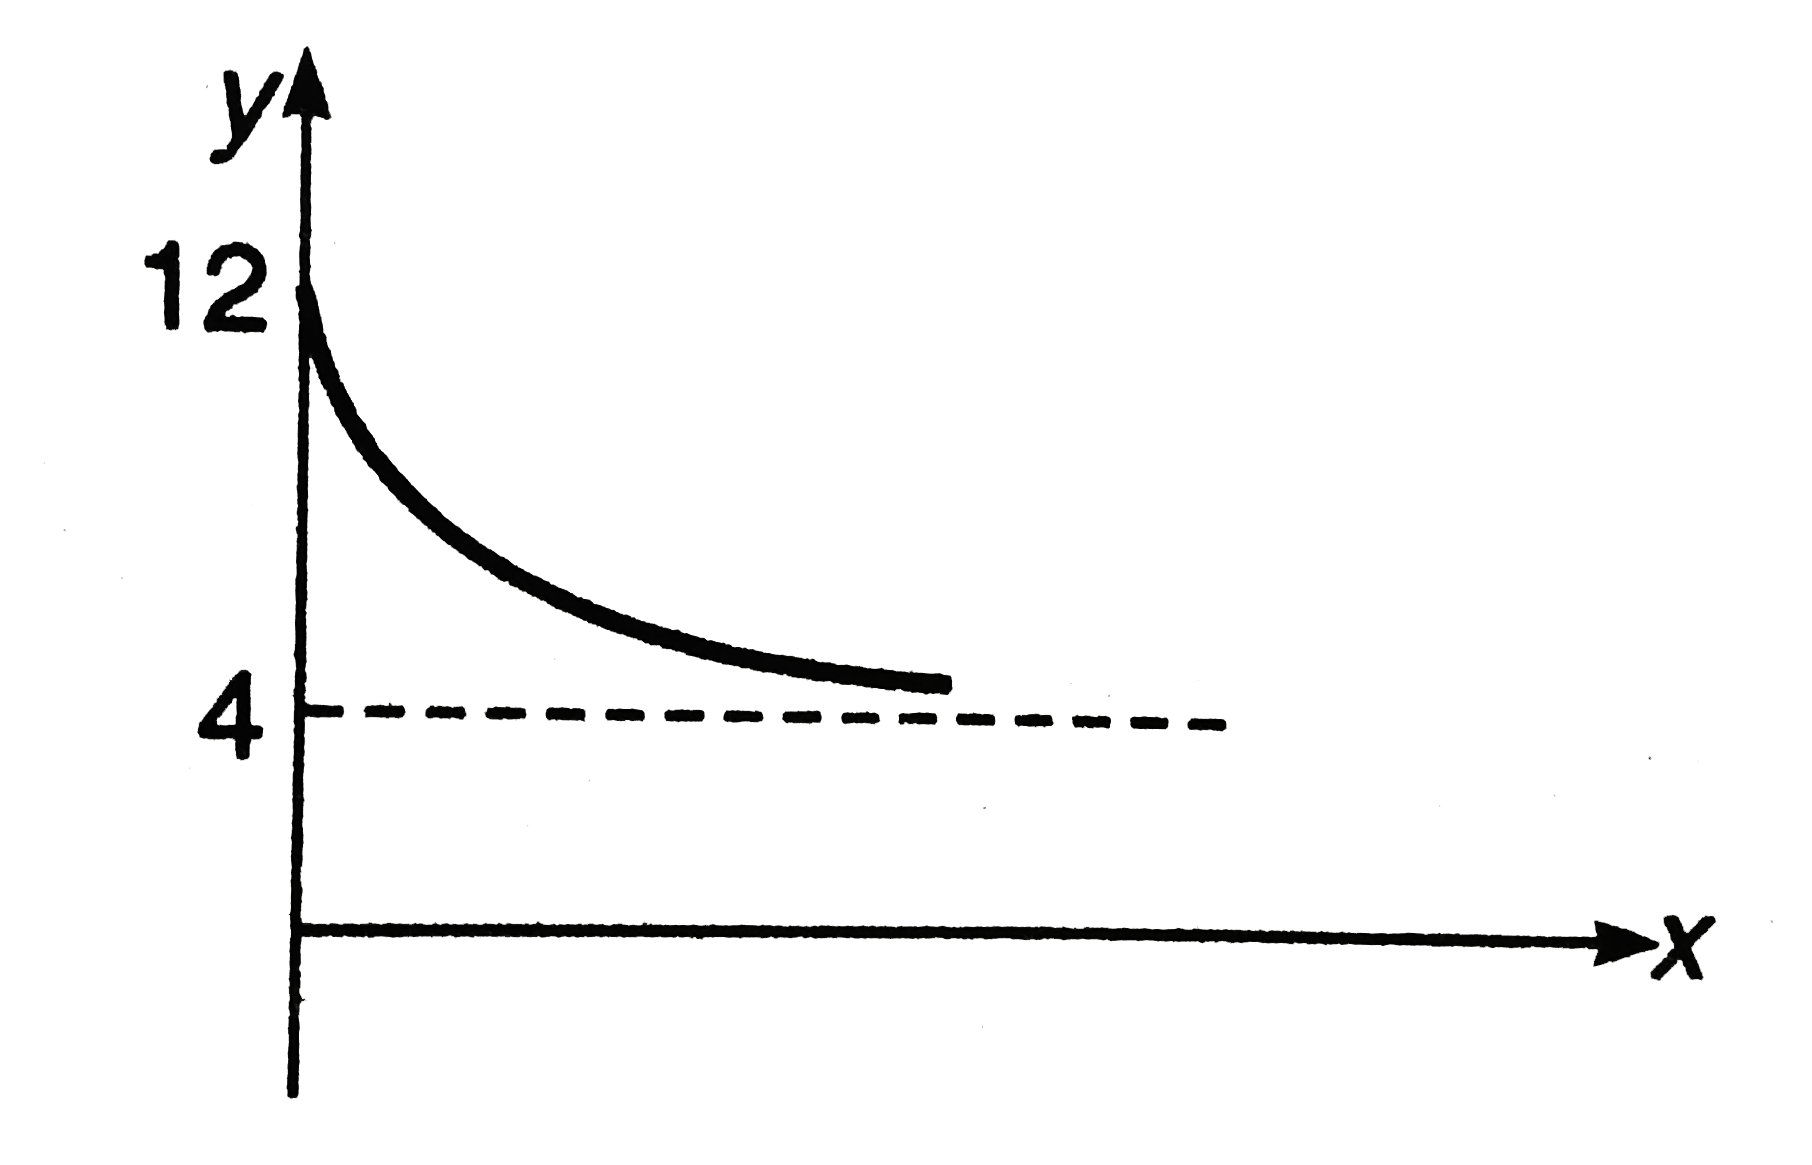
The correct Answer is:A, C, D
Step by step video, text & image solution for The graph shown in figure is exponential. Write down the equation corresponding to the graph. by Physics experts to help you in doubts & scoring excellent marks in Class 11 exams.
Updated on:21/07/2023Topper's Solved these Questions
Similar Questions
Knowledge Check
The graph in figure shows the velocity v versus time t for a body. Which of the graphs shown in figure represents the corresponding acceleration versus time graphs ?
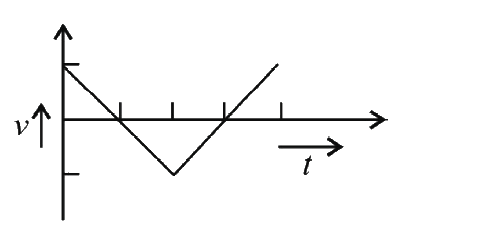 A
A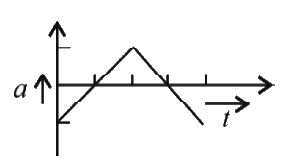 B
B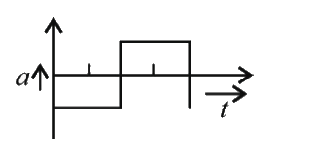 C
C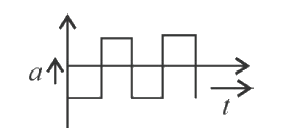 D
D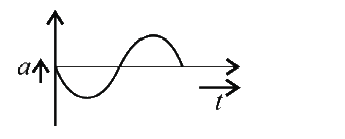
What do the graph shown in Figure indicate ?
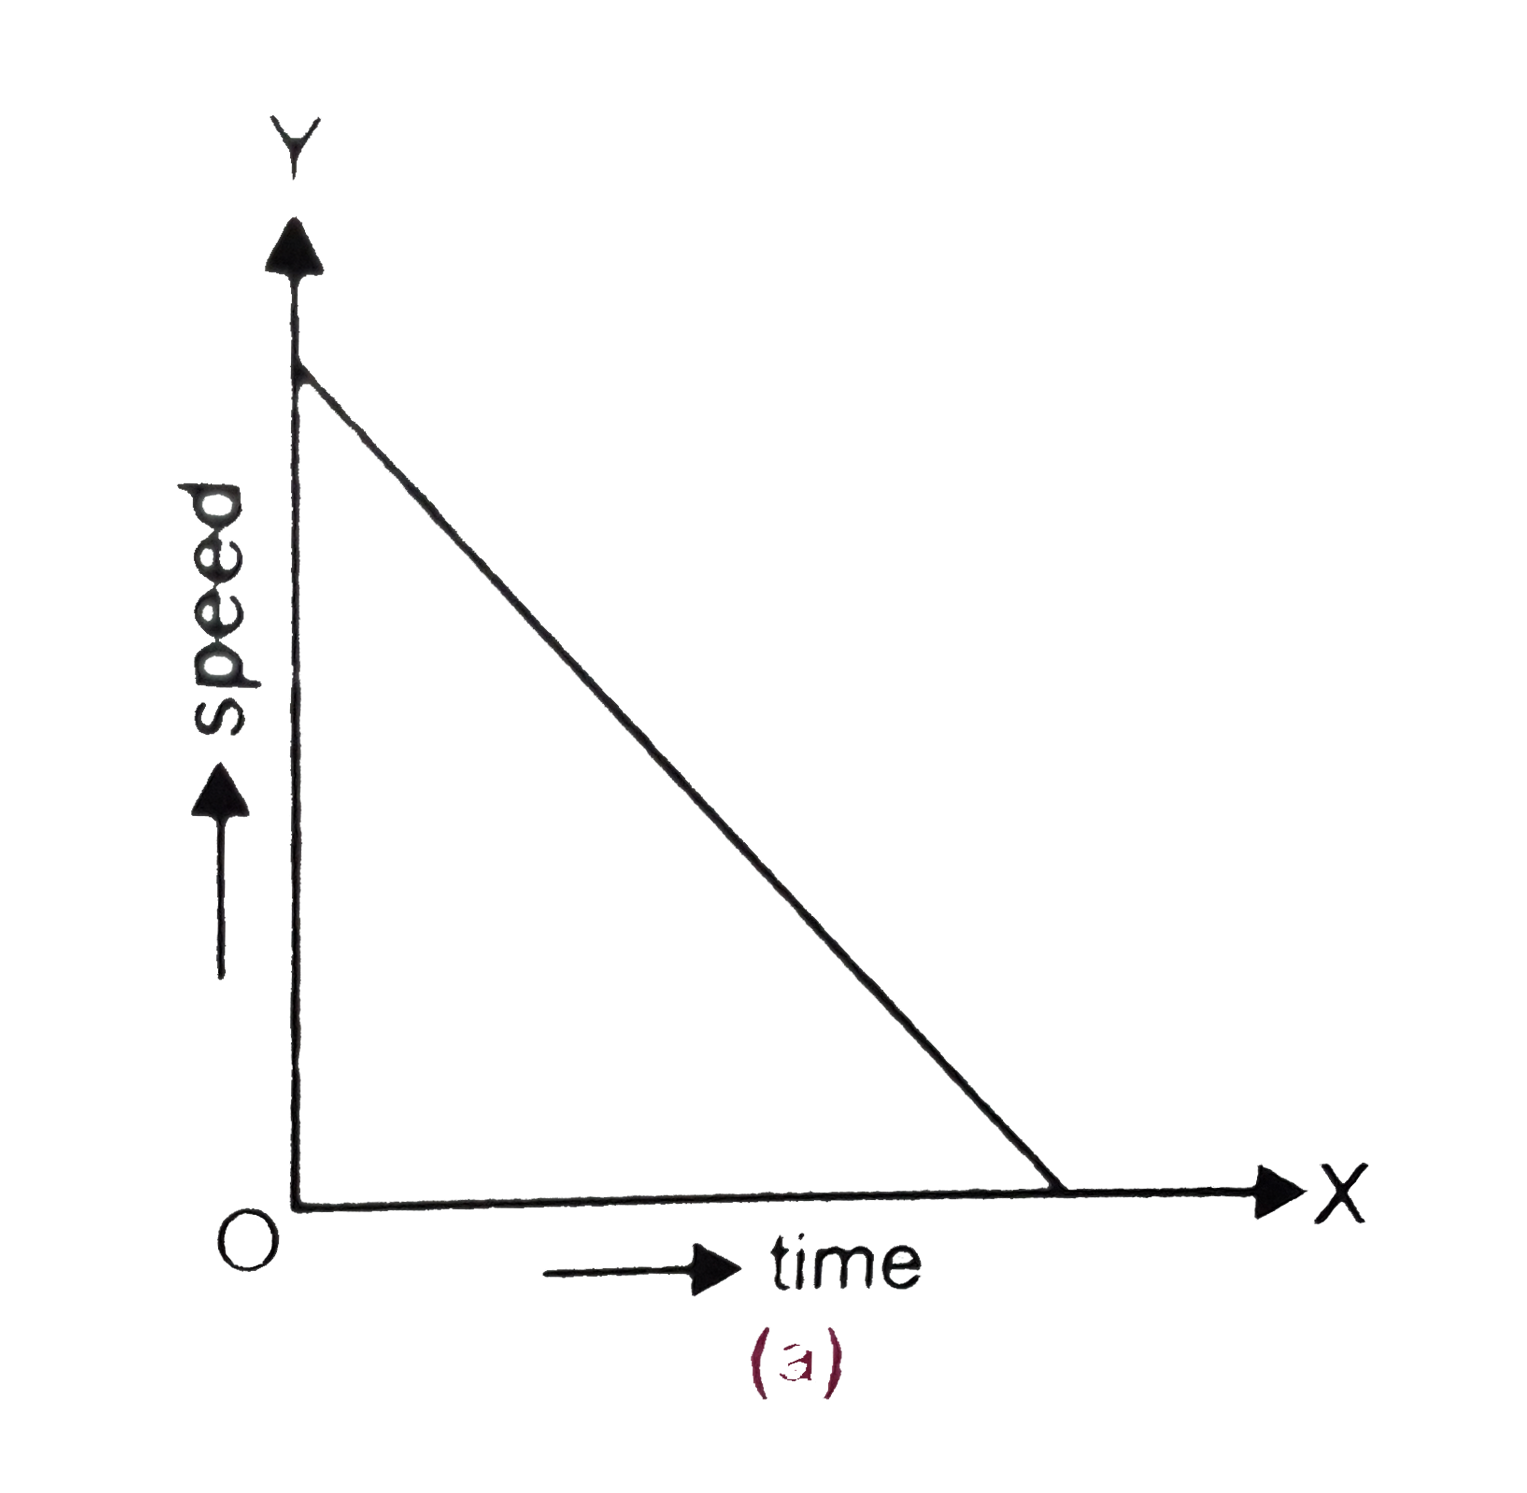
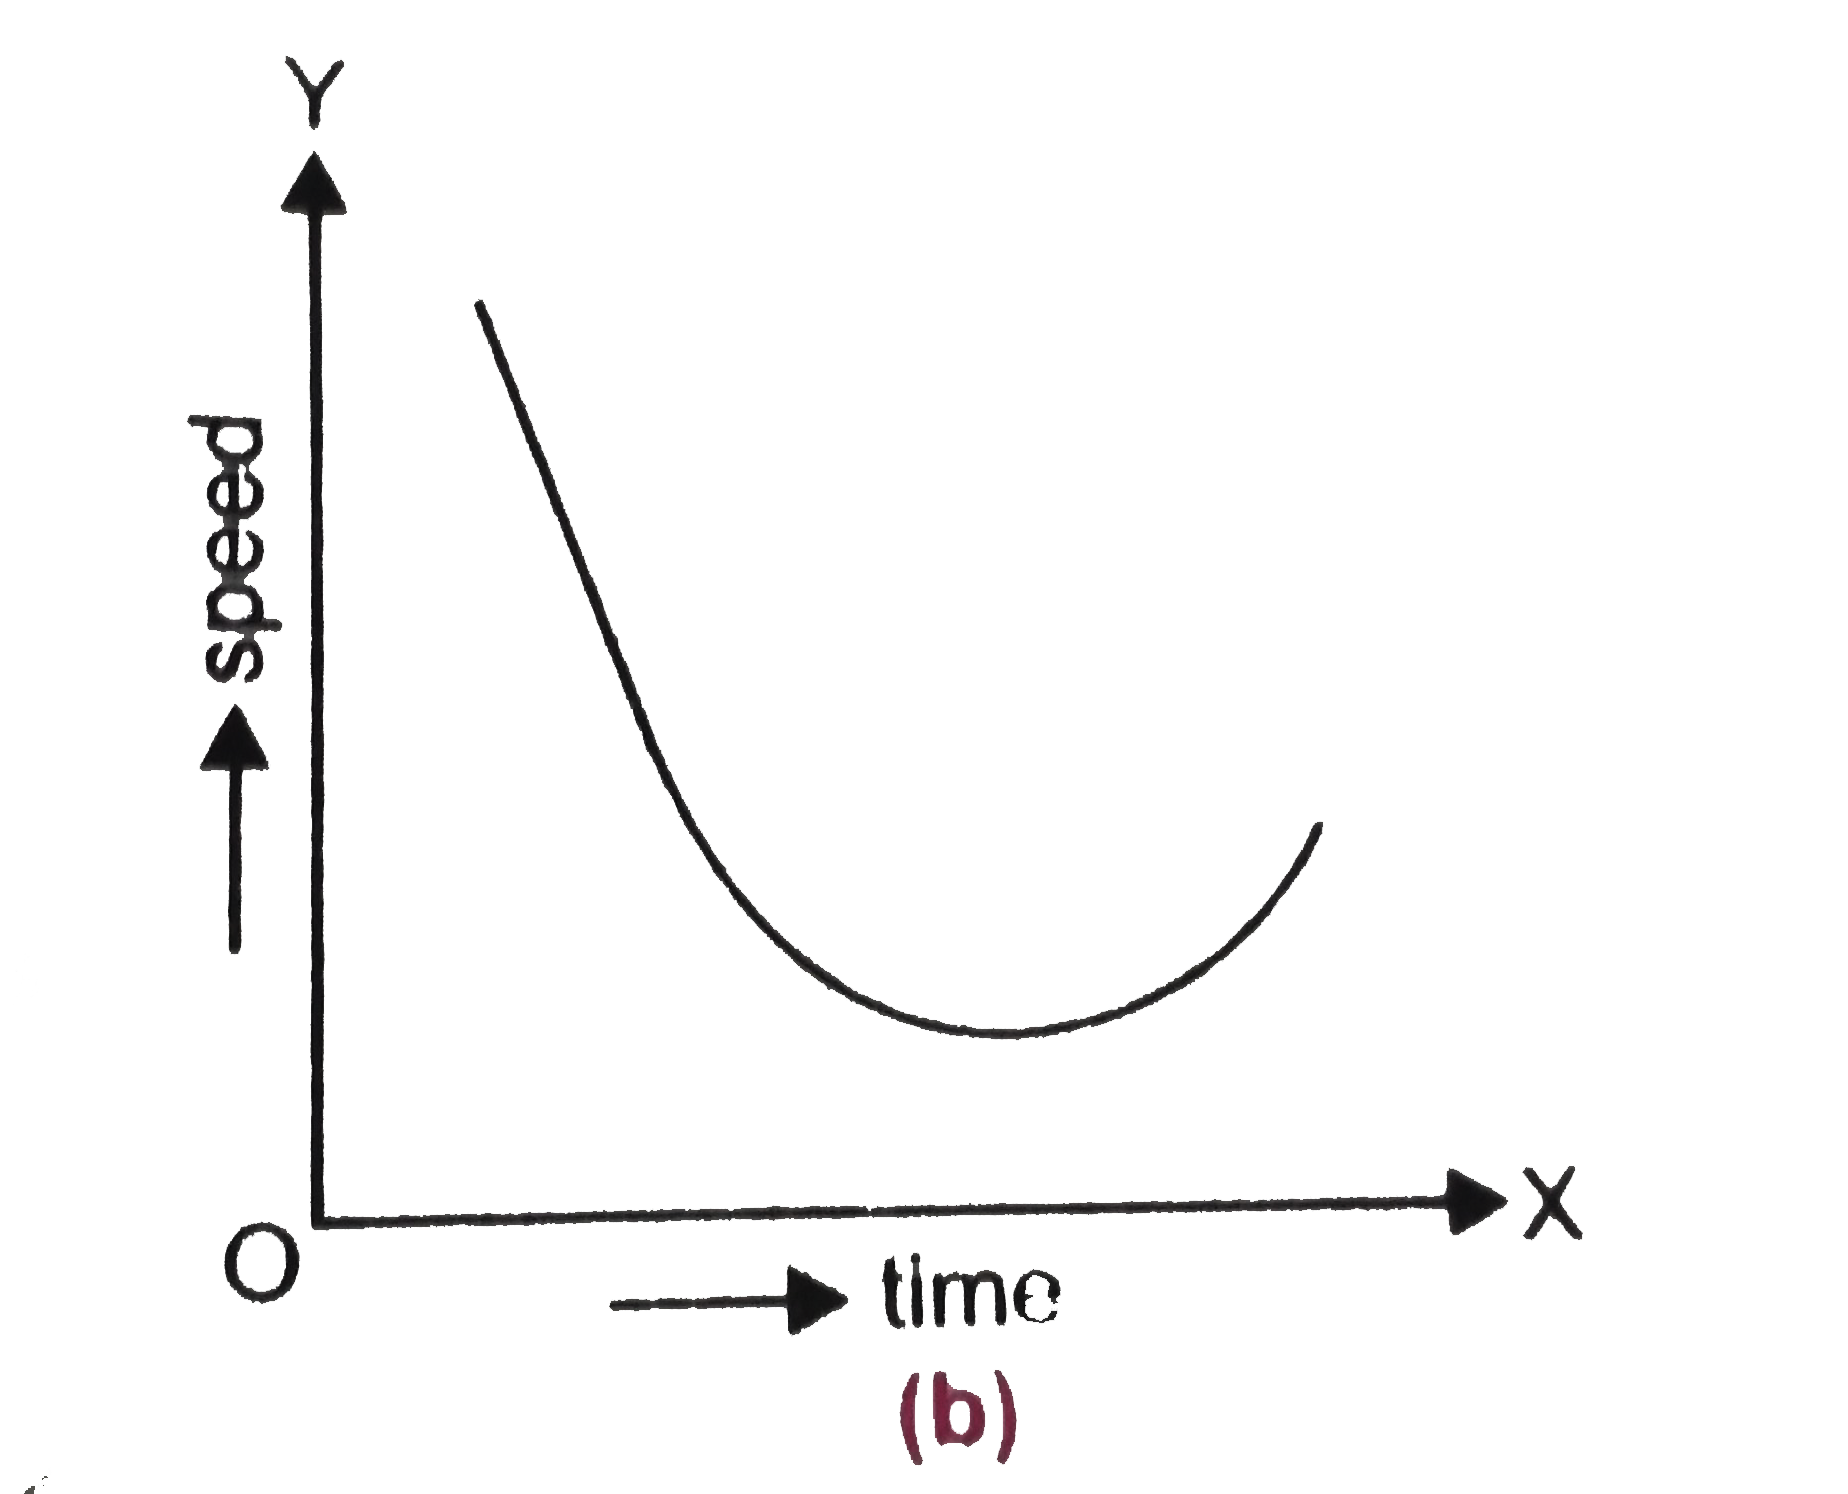
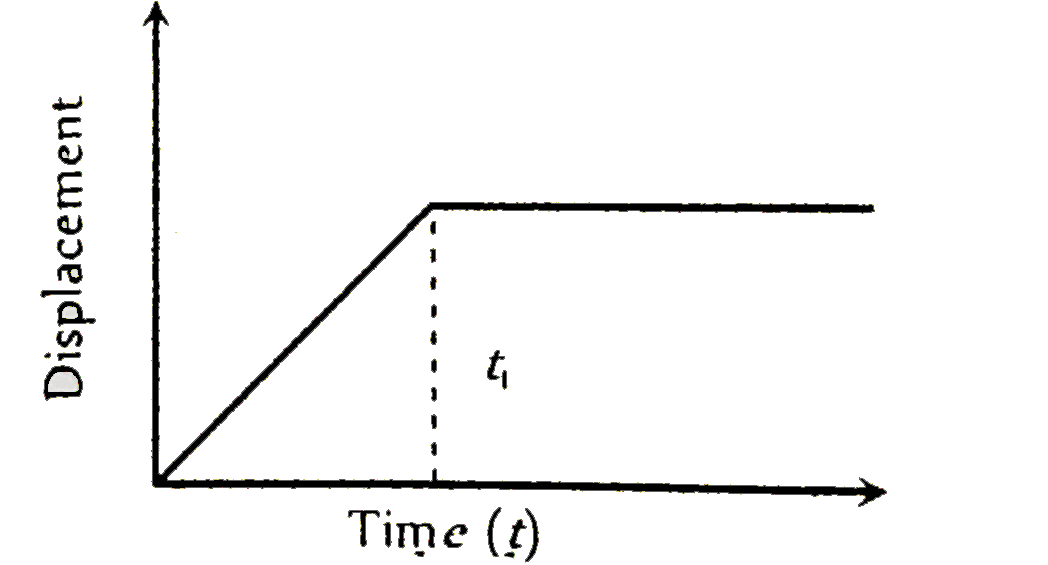
View SolutionDisplacement-time graph is shown in the figure. Displacement
The corresponding distance-time graph is
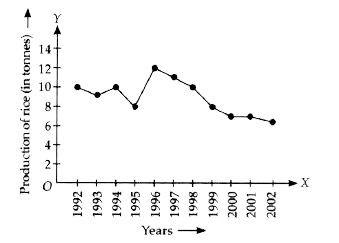
View SolutionThe graph shown in figure exhibits the production of rice for different years. Read the graph and find, in which period was the production remains constant?
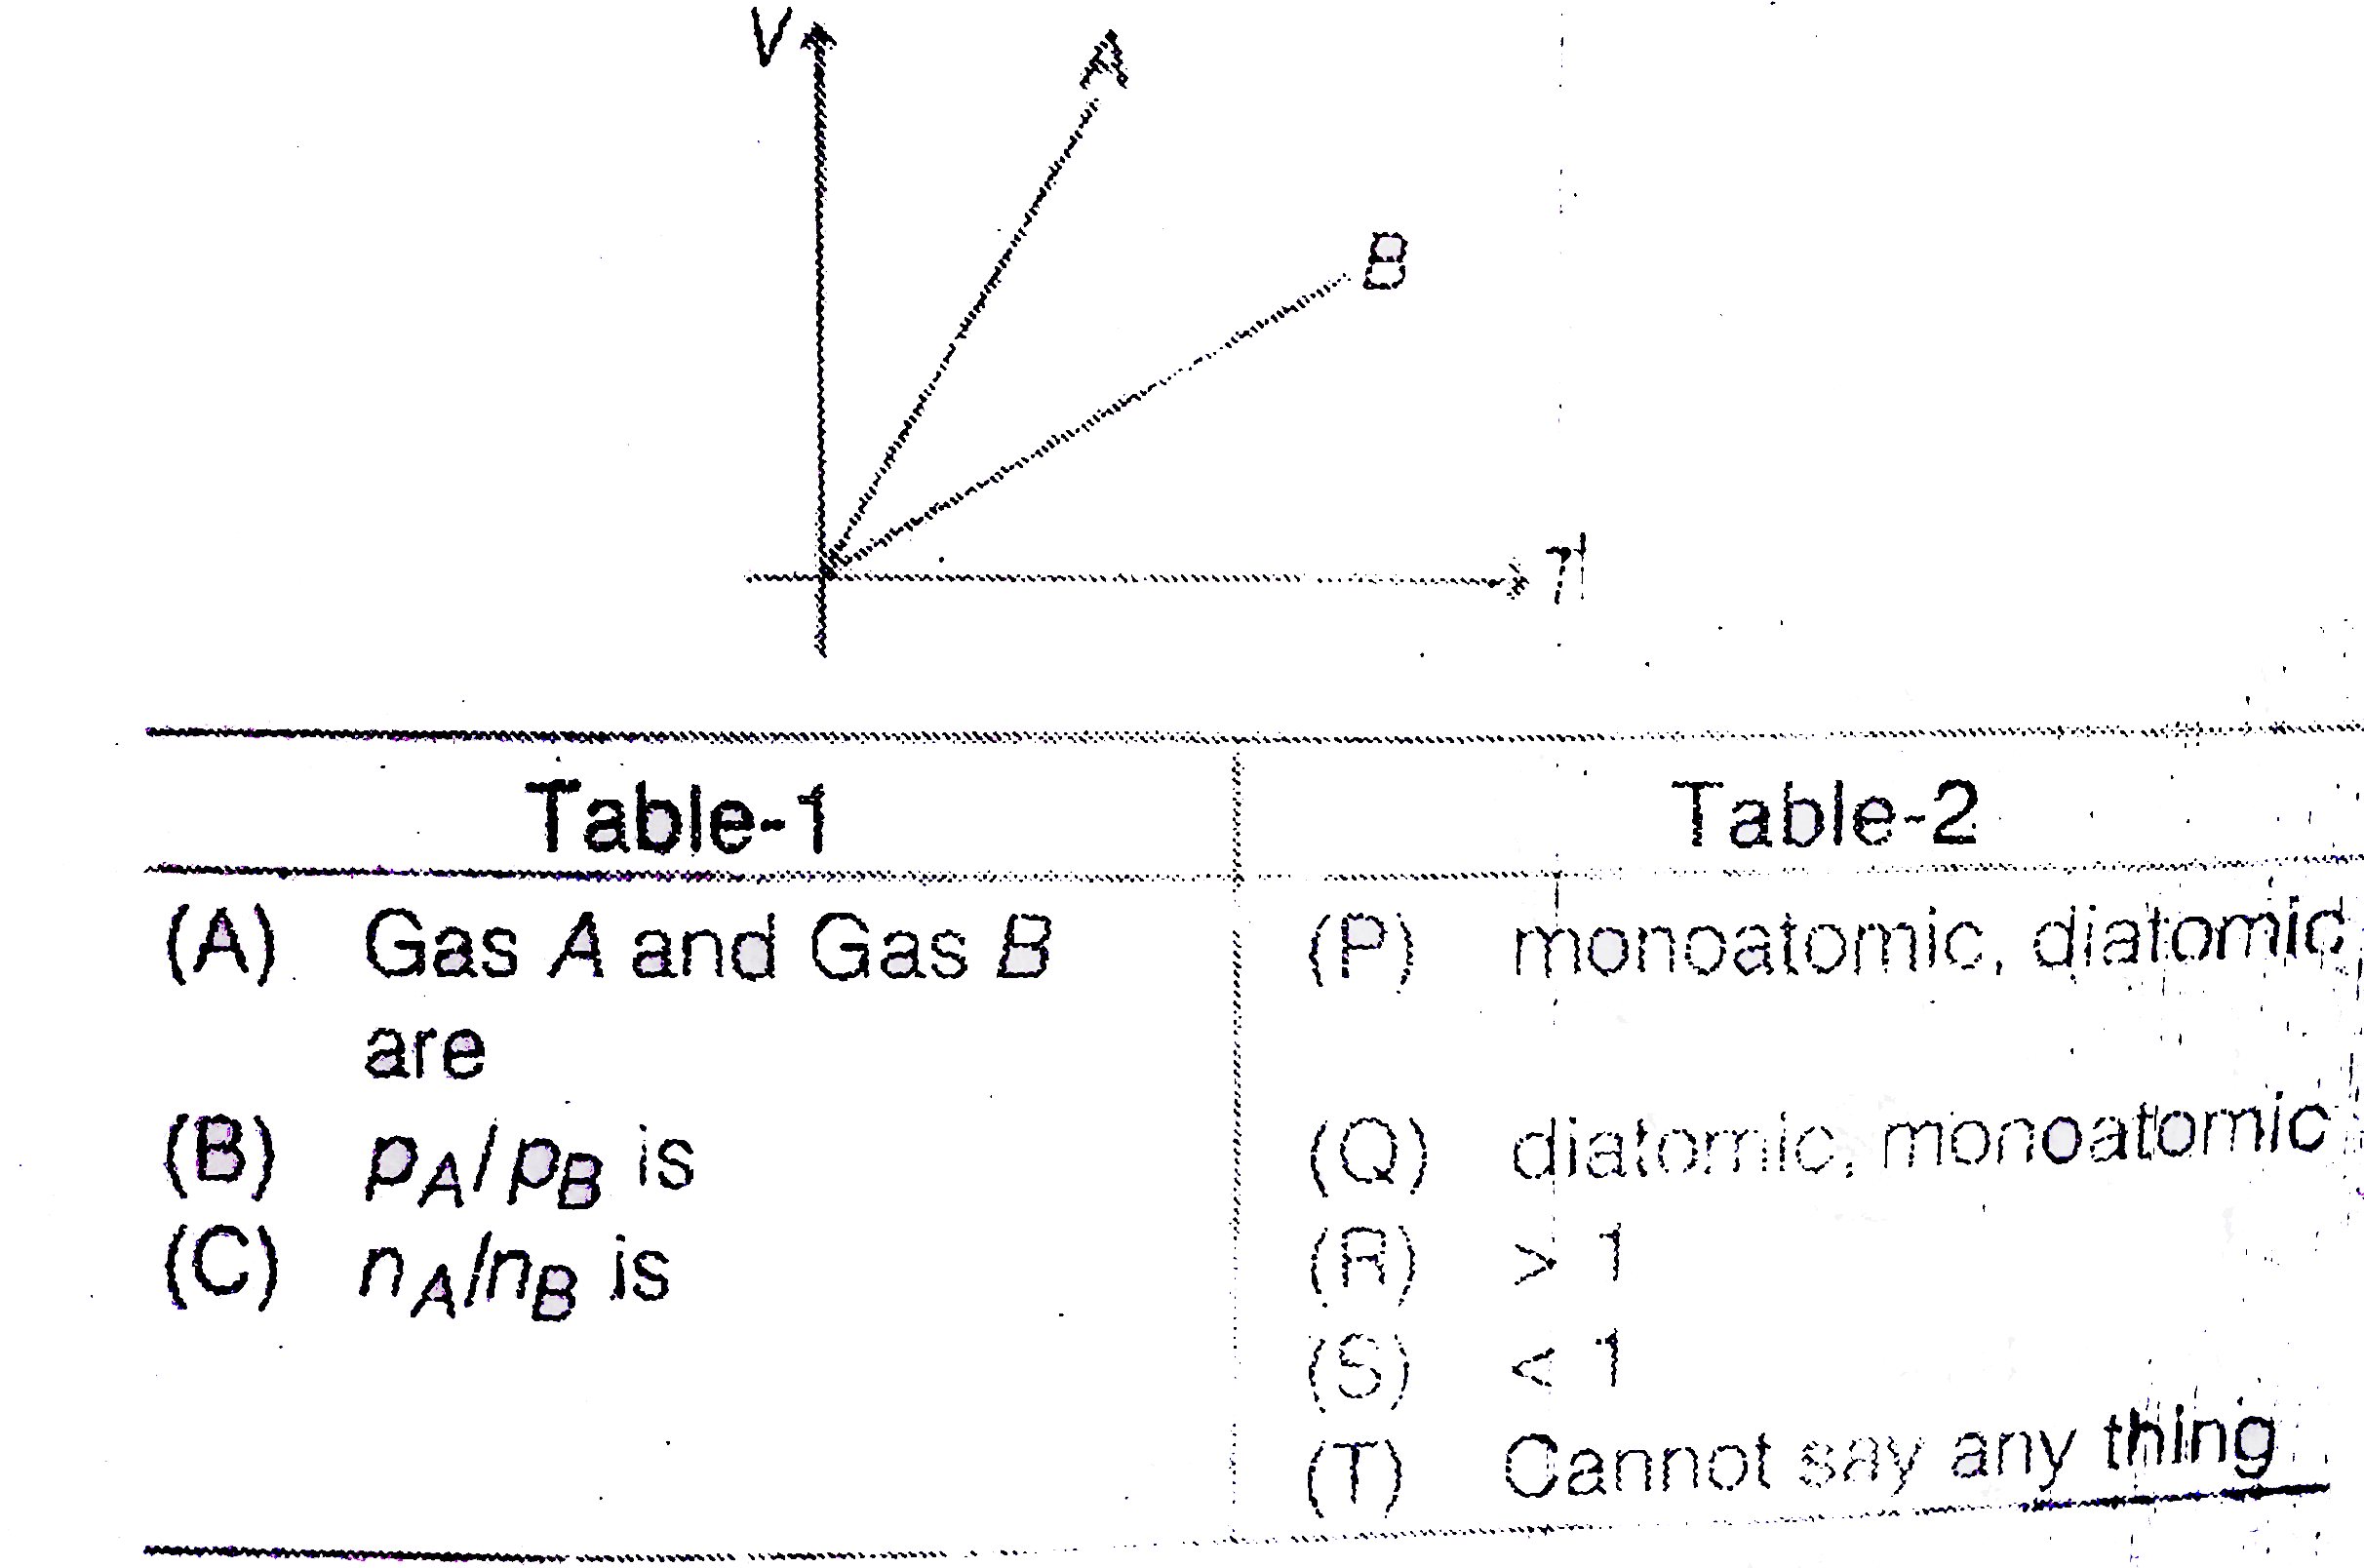
View SolutionIn the V-T graph shown in figure match the following.
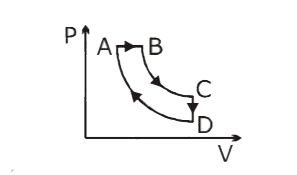
View SolutionFor P-V diagram of a thermodynamic cycle as shown in figure, process BC and DA are isothermal. Which of the corresponding graphs is correct?
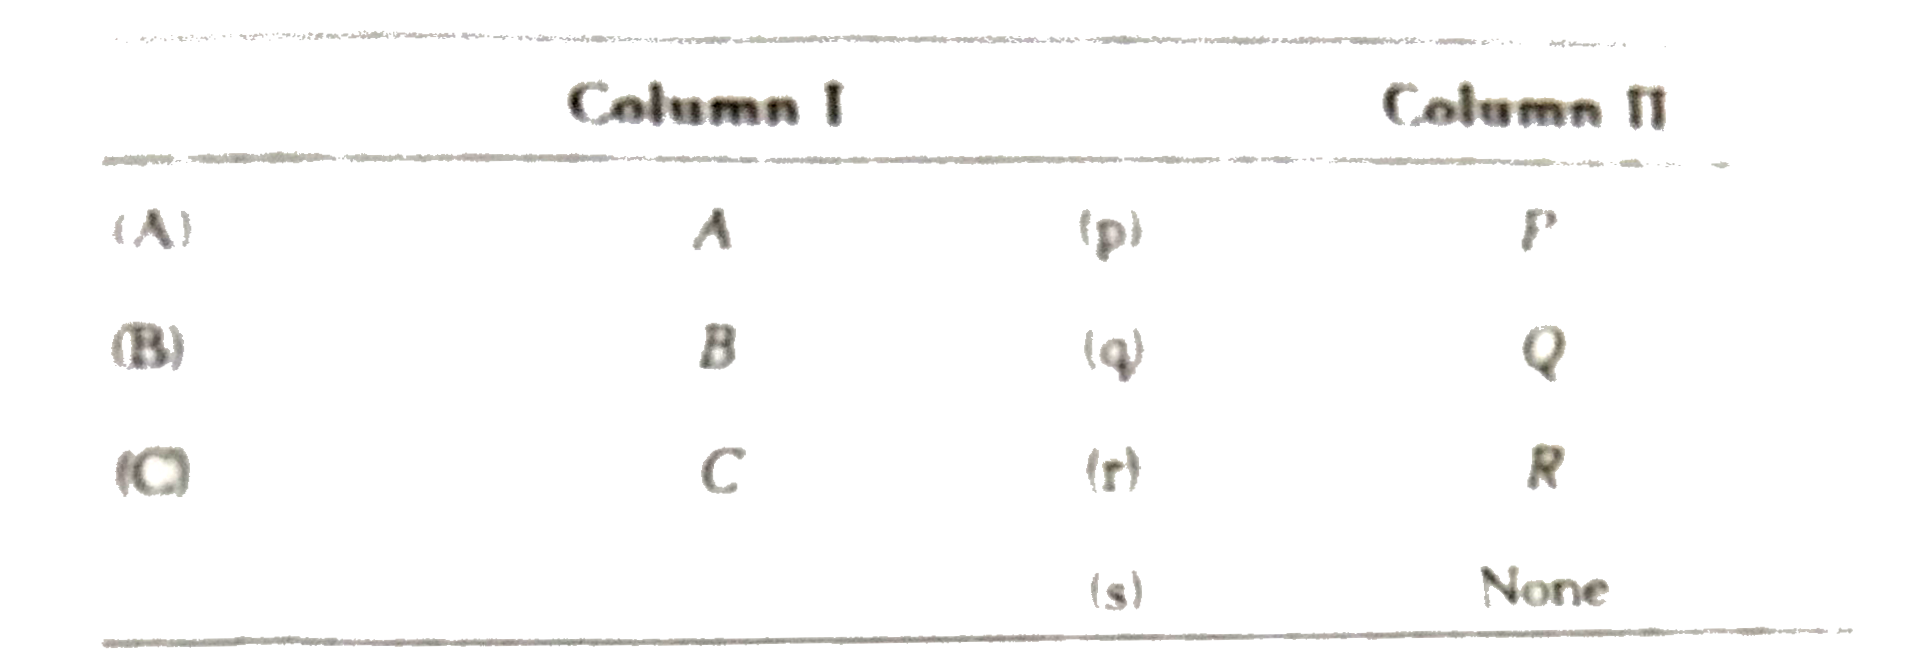
View SolutionF-x and corresponding U-x graph are as shown in figures. Three points A,B and C in F-x graph may be corresponding to P,Q and R in the U-x graph. Match the following.

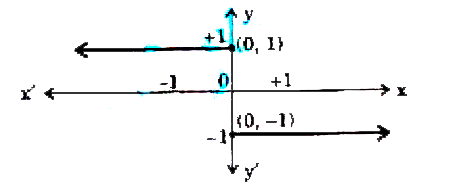
View SolutionThe equation of the graph shown here is
View Solution


