PROBABILITY for Class 9 MATHS
INTRODUCTION
Hello bachcho, aaj hum padhenge probability ke bare mai. Probability means possibility. Probability tell us how often some event will happen after many repeated trials.Probability is an essential tool in applied mathematics and mathematical modeling. You use probability in daily life to make decisions when you don't know for sure what the outcome will be. Probability can range between 0 and 1, where 0 probability means the event to be an impossible one and probability of 1 indicates a certain event.
Explanation
Hum apni daily life mai kahi tarah ki statement dekhte hai aur jinke bare mai hum sure nahi hote hai jaise ki aaj baarish hogi, ya aaj share market ka price kam hoga. Iss tarah se hum apni apni prediction karte hai. Toh ye chapter yani probability kahi na kahi hamari practical life se connected hai.
PROBABILITY
A probability is a number that reflects the chance or likelihood that a particular event will occur.
Probability — A Theoretical Approach
Toh baccho probability ko samajhne ke liye ek situation lete hai. Suppose kare ki humne randomly ek coin ko toss kara hai. Jab bhi hum coin ki baat karte hai toh iska matlab hai ki ek fair coin (unbiased). By the phrase ‘random toss’, we mean that the coin is allowed to fall freely without any bias or interference. Hum jante hai ki coin ke 2 possible outcomes hai one is head and another one is tail . We can reasonably assume that each outcome, head or tail, is as likely to occur as the other. We refer to this by saying that the outcomes head and tail, are equally likely.
For another example of equally likely outcomes, Suppose kare ki hum ek dice ko throw kar rahe hai. For us, a die will always mean a fair die. For us, a die will always mean a fair die.
They are 1,2,3,4,5,6.
Each number has the same possibility of showing up. So the equally likely outcomes of throwing a die are 1,2,3,4,5 and 6.
However, in this chapter, from now on, we will assume that all the experiments have equally likely outcomes. In Class IX, we will define the experimental or empirical probability P(E) of an event E as
P(E) = Number of trials in which the event happenedTotal number of trials
P(E) = Number of outcomes favourable to E Number of all possible outcomes of the experiment
Where we assume that the outcomes of the experiment are equally likely. The event E , representing ‘not E’, is called the complement of the event E. We also say that E and ¯¯¯E are complementary events.
The probability of an event which is impossible to occur is 0. Such an
event is called an impossible event.
The probability of an event which is sure (or certain) to occur is 1. Such an event is called a sure event or a certain event.
0≤P(E)≤1 Aapne apni life mai kabhi na kabhi to cards zarur hi khele honge. Toh aaj hum cards ke bare mai hi thoda janege. There is 52 cards in a deck.
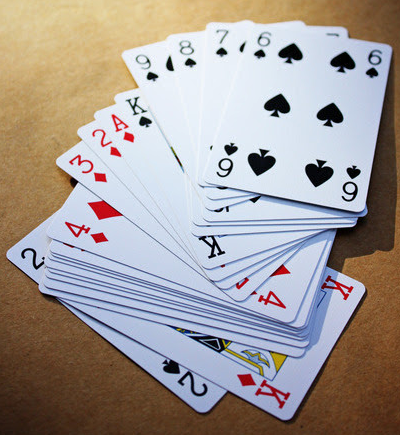
There are two colors of cards in each deck:
(i) RED
(ii) BLACK
There are 26 red cards and 26 black cards.
The types of cards in a deck are:
- Spades
- Hearts
- Diamonds
- Clubs
- Face cards
- Number cards
- Aces
Suits in a deck of cards are the representations of red and black color on the cards.
SPADES

HEARTS

DIAMONDS

CLUBS

Each card can be categorized into 4 suits constituting 13 cards each. There is one more categorization of a deck of cards:
Face Cards
These cards are also known as court cards. They are Kings, Queens, and Jacks in all 4 suits.

Number Cards
All the cards from 2 to 10 in any suit are called the number cards. These cards have numbers on them along with each suit being equal to the number on number cards.
Aces
There are 4 Aces in every deck, 1 of every suit.

Tips and Tricks

Example 1
A spinner is coloured by 3 different colours-yellow, blue and red in 12 equal sectors. After spinning the wheel, what is the probability that
(i) wheel stops at yellow colour.
(ii) wheel stops at red colour.
(iii) wheel stops at blue colour.
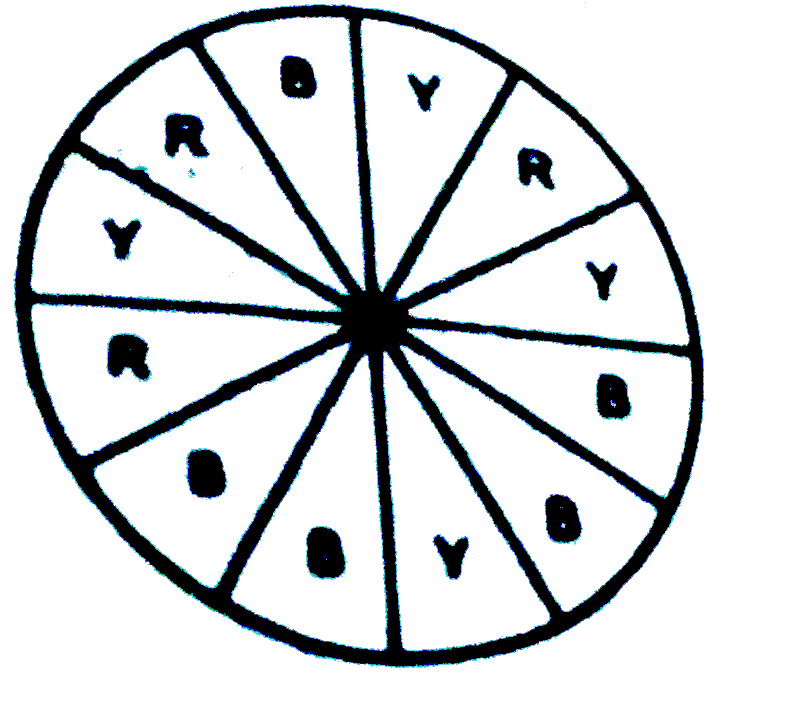
(i) P(wheel stops at yellow colour)=n(Y)n(S)=412=13
(ii)P(wheel stops at red colour)=n(R)n(S)=312=14
(iii) P(wheel stops at blue colour)=n(B)n(S)=512
or P(blue)=1−(13+14)=1−712=512
Example 2
A bag contains 5 red balls and some blue balls. If the probability of drawing a blue ball is double that of a red ball, find the number of blue balls in the bag.
Number of red balls in a bag = 5
Suppose the number of blue balls in the bag = x " "|ul({:(R,B),(5,x):})|
∴ Total number of balls in the beg=5+x
∴ P(red ball)=55+x
P(blue ball)=x5+x
Now, P(blue ball) = 2 P(red ball) (given)
⇒ x5+x=2×55+x
⇒ x=10
Therefore, the number of blue balls in the bag are 10.
Example 3
A die is thrown 250 times and the outcomes are noted as given below :
∣∣∣Outcomes 1 2 3 4 5 6Frequency 60 50 40 20 30 50∣∣∣
If a die is thrown at random, find the probability of getting.
(i)1 (ii)2 (iii) 3 (iv) 4 (v) 5 (vi) 6
Total number of trials = 250
In a random throw of a dia, let E1,E2,E3,E4,E5andE6 be the events of getting 1, 2, 3, 4, 5 and 6, respectively.
(i) P (getting 1)=P(E1)=number of times 1 appeartotal number of trials=6025=625
(ii) P (getting 2)=P(E2)=number of times 2 appearstotal number of trials=5025=15
(iii) P (getting 3)=P(E3)=number of times 3 appearstotal number of trials=40250=425
(iv) P (getting 4)=P(E4)=number of times 4 appearstotal number of trials=20250=225
(v) P (getting 5)=P(E5)=number of times 5 appearstotal number of trials=30250=325
(iv) P (getting 6)=P(E6)=number of times 6 appearstotal number of trials=50250=15
Example 4
1000 families with 2 children were selected randomly and the following data were recorded.
∣∣∣Number of boys in a family 0 1 2Number of families 140 560 300∣∣∣
If a family is chosen at random, find the probability that it has (i) no boy (ii) one boy (iii) two boys (iv) at least one boy (v) at most one boy.
(i) No of families having no boy child = 140
∴ P(getting a family with no child)=number of families with no boy childtotal number of families
=1401000=750
(ii) Number of families having one boy child = 560
∴ P(getting a family with one boy child)=5601000=1425
(iii) Number of families having two boy children = 300
∴ P(getting a family with two boy children)=3001000=310
(iv) Number of families having at least one boy child = 560 + 300 = 860
∴ P(getting a families having at least one boy child)=8601000=0.86
(v) Number of families having at most one boy child = 140 + 560 = 700
∴ P(getting a family with at most one boy child)=7001000=0.7
Basic Probability Rules
- Probability Rule One (For any event A,0≤P(A)≤1)
- Probability Rule Two (The sum of the probabilities of all possible outcomes is 1)
- Probability Rule Three (The Complement Rule)
- Probabilities Involving Multiple Events.
- Probability Rule Four (Addition Rule for Disjoint Events)
Summary
In this chapter, you have studied the following points :
- The difference between experimental probability and theoretical probability.
- The theoretical (classical) probability of an event E, written as P(E), is defined as
P(E) = Number of outcomes favourable to ENumber of all possible outcomes of the experiment
where we assume that the outcomes of the experiment are equally likely. - The probability of a sure event (or certain event) is 1
- The probability of an impossible event is 0.
- The probability of an event E is a number P(E) such that
0≤P(E)≤1 - An event having only one outcome is called an elementary event. The sum of the probabilities of all the elementary events of an experiment is 1.
- For any event E,P(E)+P(E)=1, where E stands for ‘not E’. E and E are called complementary events.