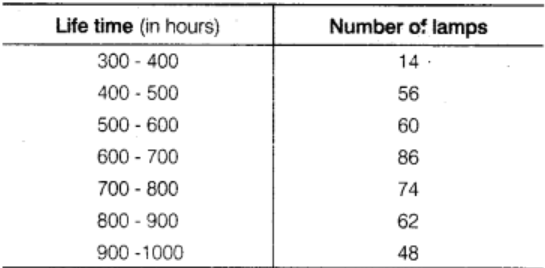
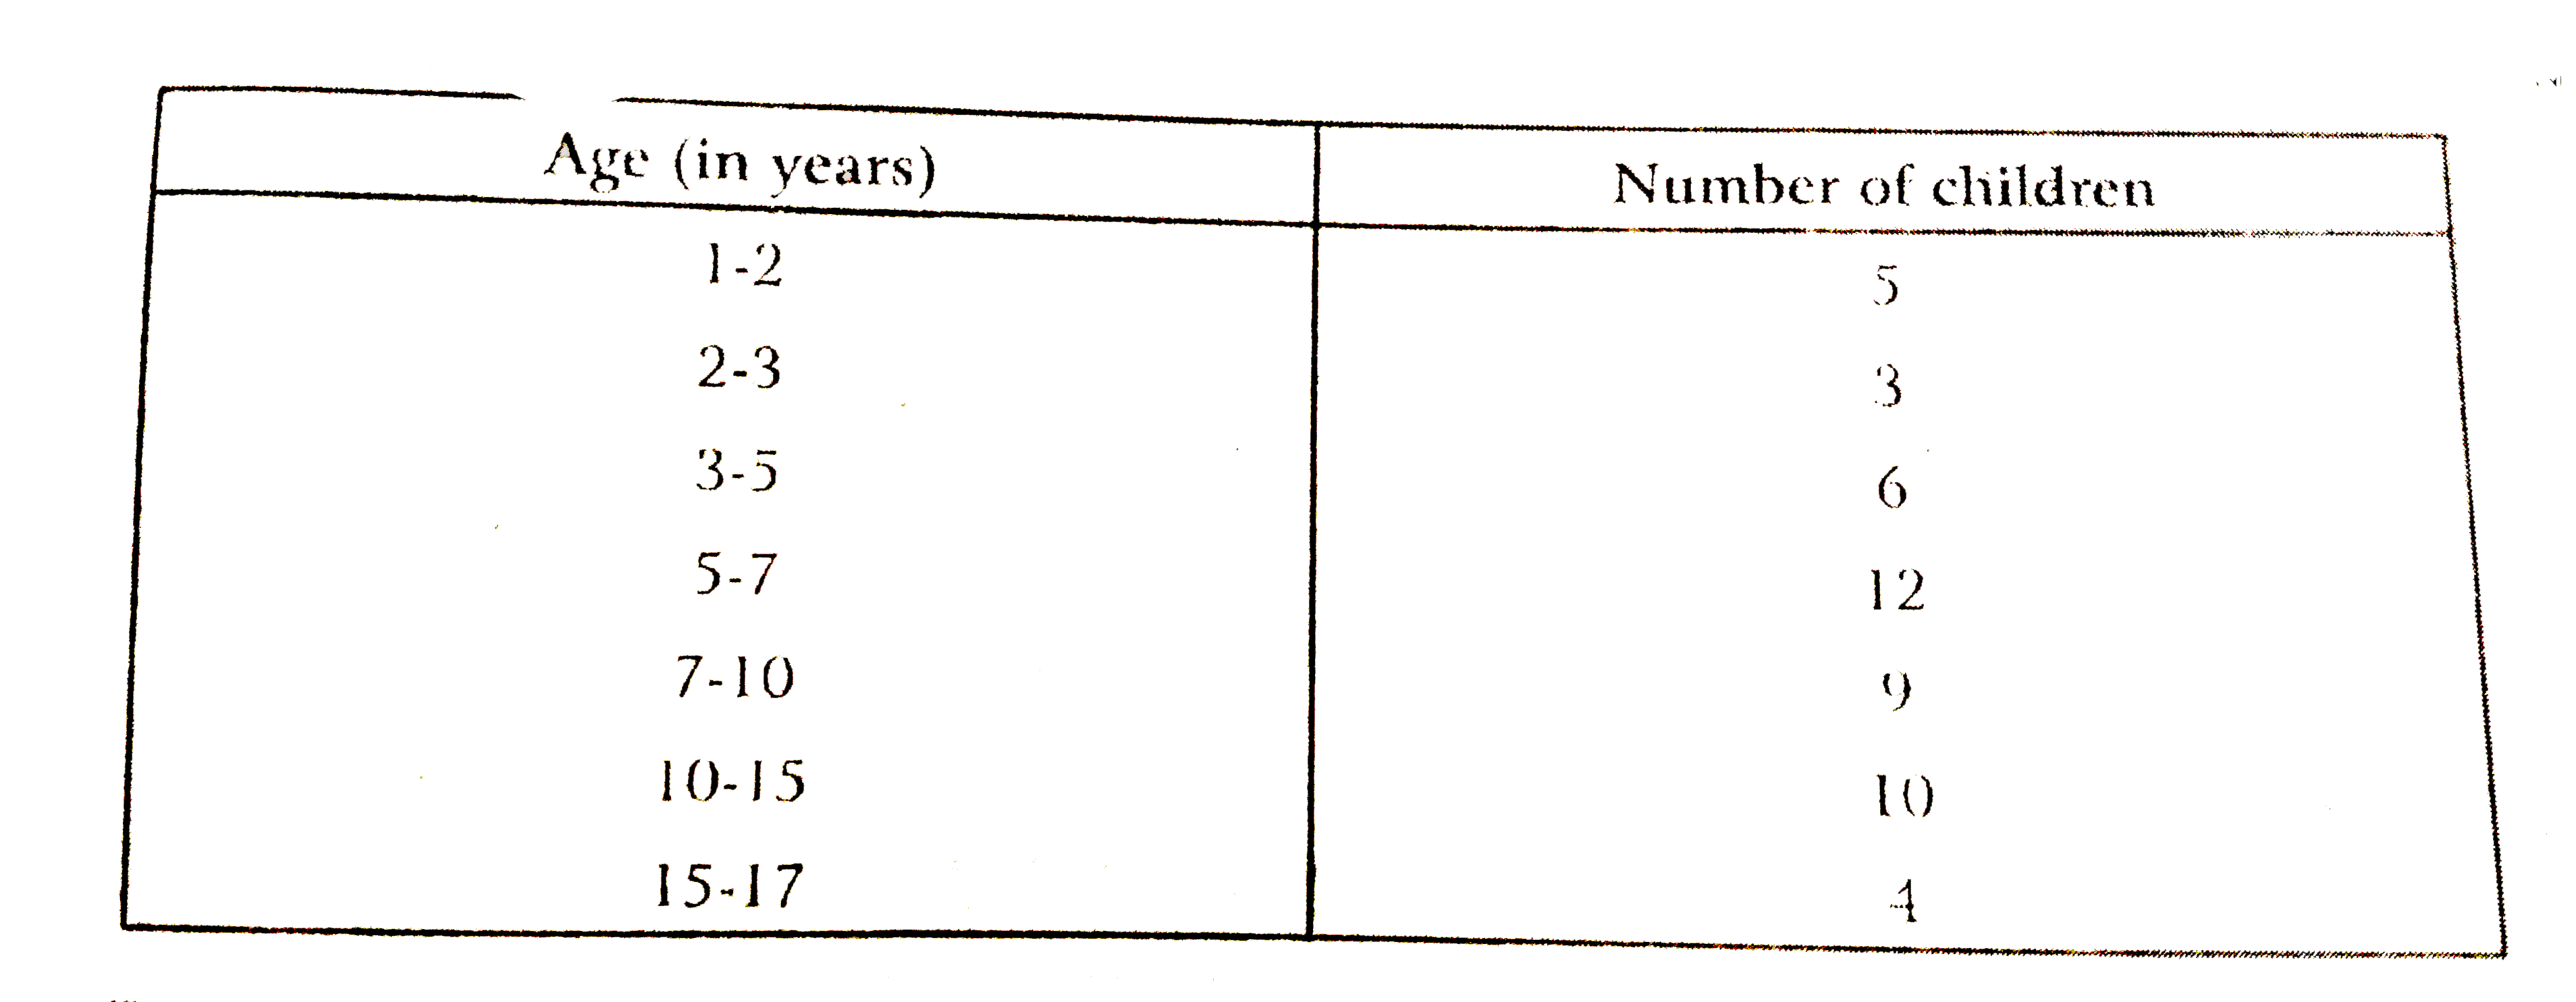
EXERCISE 14.3 from NCERT MATHEMATICS(ENGLISH) Chapter 141:STATISTICS for Class 9
| Class 9 | MATHS |
| Chapter | STATISTICS |
| NCERT MATHEMATICS(ENGLISH) | EXERCISE 14.3 |
| Medium | English |
| Academic Year | 2023-2024 |
Question 4
The length of 40 leaves of a plant are measured correct to one millimetre, and the obtained data is represented in the following table: (i) Draw a histogram to represent the given data.(ii) Is there any other suitable graphical representation for the same data?(iii) Is it correct to conclude that the maximum number of leaves are 153 mm long?Why?View SolutionQuestion 6
The following table gives the distribution of students of two sections according to the marks obtained by them

Represent the marks of the students of both the sections on the same graph by two frquency polygons. From the two polygons compare the performance of the two sections.View SolutionQuestion 7
The runs scored by two teams A and B in first 10 overs are given below: Overs, I, II, III, IV, V, VI, VII, VIII, IX, X Team A:, 2, 1, 8, 9, 4, 5, 6, 10, 6, 2 Team B:, 5, 6, 2, 10, 5, 6, 3, 4, 8, 10 Draw a graph depicting the data, making the graphs on the same axes in each case in two different ways as a graph and as a bar chart.View SolutionQuestion 9
100 surnames were randomly picked up from a local telephone directly and the frequency distribution of the number of letters in the English alphabets in the surnames was obtained as follows: Number of letters: 1-4 4-7 7-10 10-13 13-16 16-19 Number surnames 6 30 40 16 4 4 Determine the median number of letters in the surnames. Find the mean number of letters in the surnames. Also, find the modal size of the surnames.View Solution

