Exercise (true (T) or false (F)) from NCERT EXEMPLAR DATA HANDLING for Class 6
| Class 6 | MATHS |
| Chapter | DATA HANDLING |
| NCERT EXEMPLAR | Exercise (true (T) or false (F)) |
| Medium | English |
| Academic Year | 2023-2024 |
Question 4
The choices of the fruits of 42 students in a class are as follows:
A,O,B,M,A,G,B,G,A,G,
B,M,A,G,M,A,B,G,M,B,
A,O,M,O,G,B,O,M,G,A,
A,B,M,O,M,G,B,A,M,O,M,O,
Where A, B, G, M and O stand for the fruits Apple, Banana, Grapes, Mango and Orange respectively.
Which two fruits are liked by an equal number of students?View SolutionQuestion 5
According to data, which fruit is liked by most of the students? The choices of the fruits of 42 students in a class are as follows:
A,O,B,M,A,G,B,G,A,G,
B,M,A,G,M,A,B,G,M,B,
A,O,M,O,G,B,O,M,G,A,
A,B,M,O,M,G,B,A,M,O,M,O,
Where A, B, G, M and O stand for the fruits Apple, Banana, Grapes, Mango and Orange respectively.
View SolutionQuestion 23
The number of two wheelers owned individually by each of 50 families are listed below. Make a table using tally marks.
1, 1, 2, 1, 1, 1, 2, 1, 2, 1, 0, 1, 1, 2, 3, 1, 2, 1, 1, 2, 1, 2, 3,
1, 0, 2, 1, 0, 2, 1, 2, 1, 2, 1, 1, 4, 1, 3, 1, 1, 2, 1, 1, 1, 1,
2, 3, 2, 1, 1
Find the number of families having two or more, two wheelers.View SolutionQuestion 24
The lengths in centimetres (to the nearest centimetre) of 30 carrots are given as follows:
15, 22, 21, 20, 22,15, 15, 20, 20,15, 20, 18, 20, 22, 21,
20, 21, 18, 21, 18, 20, 18, 21, 18, 22, 20,
15, 21, 18, 20
Arrange the data given above in a table using tally marks and answer the following questions.
What is the number of carrots which have length more than 20 cm?View SolutionQuestion 25
The lengths in centimetres (to the nearest centimetre) of 30 carrots are given as follows:
15, 22, 21, 20, 22,15, 15, 20, 20,15, 20, 18, 20, 22, 21,
20, 21, 18, 21, 18, 20, 18, 21, 18, 22, 20,
15, 21, 18, 20
Arrange the data given above in a table using tally marks and answer the following questions.
Which length of the carrots occur maximum number of times?Minimum number of times?View SolutionQuestion 26
Thirty students were interviewed to find out what they want to be in future. Their responses are listed as below:
doctor, engineer, doctor, pilot, officer, doctor, engineer, doctor, pilot, officer, pilot, engineer, officer, pilot, doctor, engineer, pilot, officer, doctor, officer, doctor, pilot, engineer, doctor, pilot, officer, doctor, pilot, doctor, engineer
Arrange the data in a table using tally marks.View SolutionQuestion 27
Following are the choices of games of 40 students of Class VI:
football, cricket, football, kho-kho, hockey, cricket, hockey, kho-kho,
tennis, tennis, cricket, football, football, hockey, kho-kho, football,
cricket, tennis, football, hockey, kho-kho, football, cricket, cricket,
football, hockey, kho-kho, tennis, football, hockey, cricket, football,
hockey, cricket, football, kho-kho, football, cricket, hockey, football.
Arrange the choices of games in a table using tally marks.View SolutionQuestion 28
Following are the choices of games of 40 students of Class VI:
football, cricket, football, kho-kho, hockey, cricket, hockey, kho-kho,
tennis, tennis, cricket, football, football, hockey, kho-kho, football,
cricket, tennis, football, hockey, kho-kho, football, cricket, cricket,
football, hockey, kho-kho, tennis, football, hockey, cricket, football,
hockey, cricket, football, kho-kho, football, cricket, hockey, football.
Which game is liked by most of the students?View SolutionQuestion 29
Following are the choices of games of 40 students of Class VI:
football, cricket, football, kho-kho, hockey, cricket, hockey, kho-kho,
tennis, tennis, cricket, football, football, hockey, kho-kho, football,
cricket, tennis, football, hockey, kho-kho, football, cricket, cricket,
football, hockey, kho-kho, tennis, football, hockey, cricket, football,
hockey, cricket, football, kho-kho, football, cricket, hockey, football.
Which game is liked by minimum number of students?View SolutionQuestion 35
Students of Class VI in a school were given a task to count the number of articles made of different materials in the school. The information collected by them is represented as follows:

Observe the pictograph and answer the following questions:
Which material is used in maximum number of articles?View SolutionQuestion 36
Students of Class VI in a school were given a task to count the number of articles made of different materials in the school. The information collected by them is represented as follows:
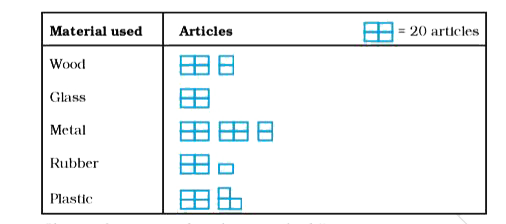
Observe the pictograph and answer the following questions:
Which material is used in minimum number of articles?View SolutionQuestion 37
Students of Class VI in a school were given a task to count the number of articles made of different materials in the school. The information collected by them is represented as follows:

Observe the pictograph and answer the following questions:
Which material is used in exactly half the number of articles as those made up of metal?View SolutionQuestion 38
Students of Class VI in a school were given a task to count the number of articles made of different materials in the school. The information collected by them is represented as follows:

Observe the pictograph and answer the following questions:
What is the total number of articles counted by the students?View SolutionQuestion 54
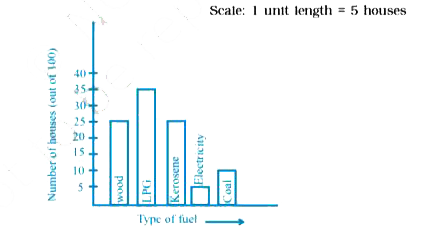
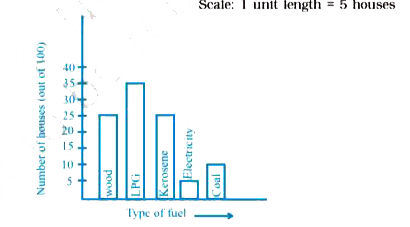
The following bar graph shows the number of houses (out of 100) in a town using different types of fuels for cooking.
Read the bar graph and answer the following questions:
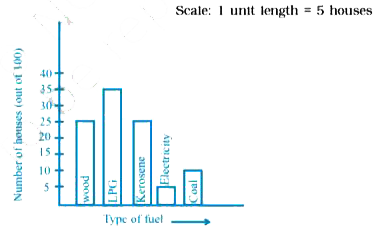
Suppose that the total number of houses in the town is 1 lakh. From the above graph estimate the number of houses using electricity. View SolutionQuestion 60
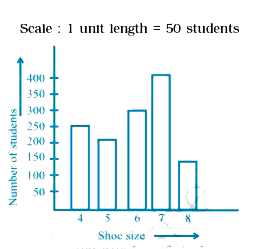
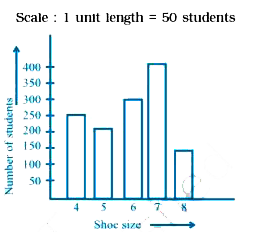
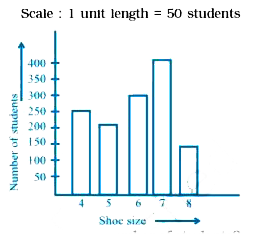
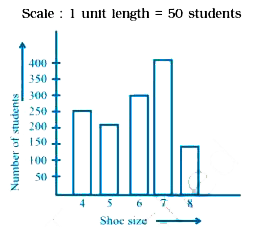
The following bar graph represents the data for different sizes of shoes worn by the students in a school. Read the graph and answer the following questions.
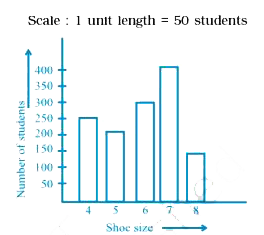
State whether true or false:
The total number of students wearing shoe sizes 5 and 8 is the same as the number of students wearing shoe size 6. View SolutionQuestion 64
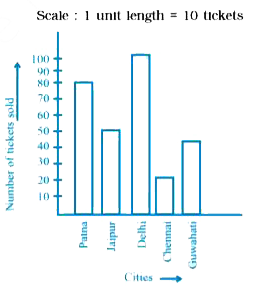
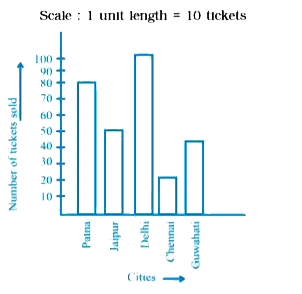
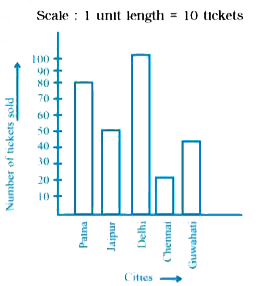
The following graph gives the information about the number of railway tickets sold for different cities on a railway ticket counter between 6.00 am to 10.00 am. Read the bar graph and answer the following questions.
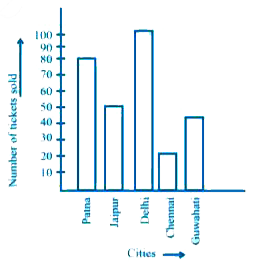
Name the cities for which the number of tickets sold is more than 20. View SolutionQuestion 65
The following graph gives the information about the number of railway tickets sold for different cities on a railway ticket counter between 6.00 am to 10.00 am. Read the bar graph and answer the following questions.
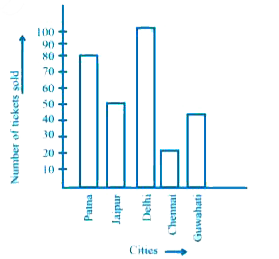
Fill in the blanks:
Number of tickets sold for Delhi and Jaipur together exceeds the total number of tickets sold for Patna and Chennai by _____View Solution
 represents 50 books in a library shelf, then the symbol
  represents how many books?
 represents 20 flowers in a basket then
  stands for ________ flowers.