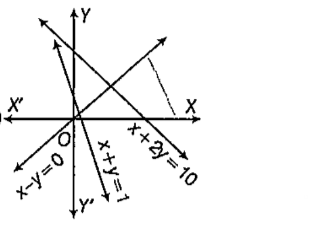
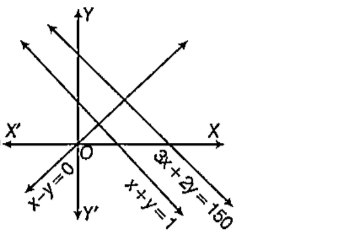
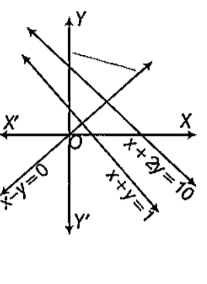
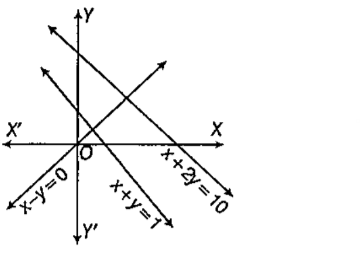
x+2y≤10,x+y≥1,x−y≤0,x≥0,y≥0
The correct Answer is:N/a
To solve the given inequalities graphically, we will follow these steps:
Step 1: Convert Inequalities to Equations
We start by converting each inequality into an equation to find the boundary lines.
1. First Inequality: x+2y≤10 becomes x+2y=10.
2. Second Inequality: x+y≥1 becomes x+y=1.
3. Third Inequality: x−y≤0 becomes x−y=0.
4. Fourth Inequality: x≥0.
5. Fifth Inequality: y≥0.
Step 2: Find Intercepts for Each Line
Next, we find the intercepts for each equation to plot them.
1. For x+2y=10:
- Let x=0: 2y=10 → y=5 (Point: (0,5))
- Let y=0: x=10 (Point: (10,0))
2. For x+y=1:
- Let x=0: y=1 (Point: (0,1))
- Let y=0: x=1 (Point: (1,0))
3. For x−y=0:
- Let x=0: y=0 (Point: (0,0))
- Let y=0: x=0 (Point: (2,2))
Step 3: Plot the Lines
Now we plot the lines based on the points obtained:
1. Line for x+2y=10: Connect points (0,5) and (10,0).
2. Line for x+y=1: Connect points (0,1) and (1,0).
3. Line for x−y=0: Connect points (0,0) and (2,2).
Step 4: Determine the Shading Region
Next, we determine which side of each line to shade based on the inequality:
1. For x+2y≤10: Test point (0,0):
- 0+2(0)≤10 → True, so shade below the line.
2. For x+y≥1: Test point (0,0):
- 0+0≥1 → False, so shade above the line.
3. For x−y≤0: Test point (10,0):
- 10−0≤0 → False, so shade below the line.
4. For x≥0 and y≥0: Shade in the first quadrant.
Step 5: Identify the Feasible Region
The feasible region is where all shaded areas overlap. This region will be bounded by the lines and will be in the first quadrant.
Final Graph
Draw the axes, plot the lines, and shade the feasible region based on the above conditions.
---
We start by converting each inequality into an equation to find the boundary lines.
2. Second Inequality: x+y≥1 becomes x+y=1.
3. Third Inequality: x−y≤0 becomes x−y=0.
4. Fourth Inequality: x≥0.
5. Fifth Inequality: y≥0.
Next, we find the intercepts for each equation to plot them.
- Let x=0: 2y=10 → y=5 (Point: (0,5))
- Let y=0: x=10 (Point: (10,0))
- Let x=0: y=1 (Point: (0,1))
- Let y=0: x=1 (Point: (1,0))
- Let x=0: y=0 (Point: (0,0))
- Let y=0: x=0 (Point: (2,2))
Now we plot the lines based on the points obtained:
2. Line for x+y=1: Connect points (0,1) and (1,0).
3. Line for x−y=0: Connect points (0,0) and (2,2).
Next, we determine which side of each line to shade based on the inequality:
- 0+2(0)≤10 → True, so shade below the line.
2. For x+y≥1: Test point (0,0):
- 0+0≥1 → False, so shade above the line.
- 10−0≤0 → False, so shade below the line.
The feasible region is where all shaded areas overlap. This region will be bounded by the lines and will be in the first quadrant.
Draw the axes, plot the lines, and shade the feasible region based on the above conditions.
Topper's Solved these Questions
- BOOK - NAGEEN PRAKASHANCHAPTER - LINEAR INEQUALITIESEXERCISE - NCERT QUESTION51videos
LINEAR INEQUALITIES
- BOOK - NAGEEN PRAKASHANCHAPTER - LINEAR INEQUALITIESEXERCISE - MISCELLANEOUS EXERCISE14videos
LINEAR INEQUALITIES
- BOOK - NAGEEN PRAKASHANCHAPTER - LINEAR INEQUALITIESEXERCISE - MISCELLANEOUS EXERCISE14videos
LINEAR INEQUALITIES
- BOOK - NAGEEN PRAKASHANCHAPTER - LIMITS AND DERIVATIVESEXERCISE - Miscellaneous Exercise30videos
LIMITS AND DERIVATIVES
- BOOK - NAGEEN PRAKASHANCHAPTER - MATHEMATICAL REASONING EXERCISE - Misellaneous exercise7videos
MATHEMATICAL REASONING
Similar Questions
Knowledge Check
- Question 1 - Select One
The graphical solution of the inequalities x+2y≤10,x+y≥1,x−y≤0,x≥0,y≥0 is
A B
B C
C D
D
