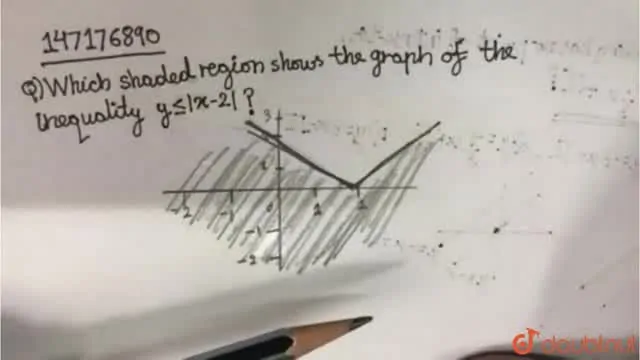
Which of the following shaded regions shows the graph of the inequality ?
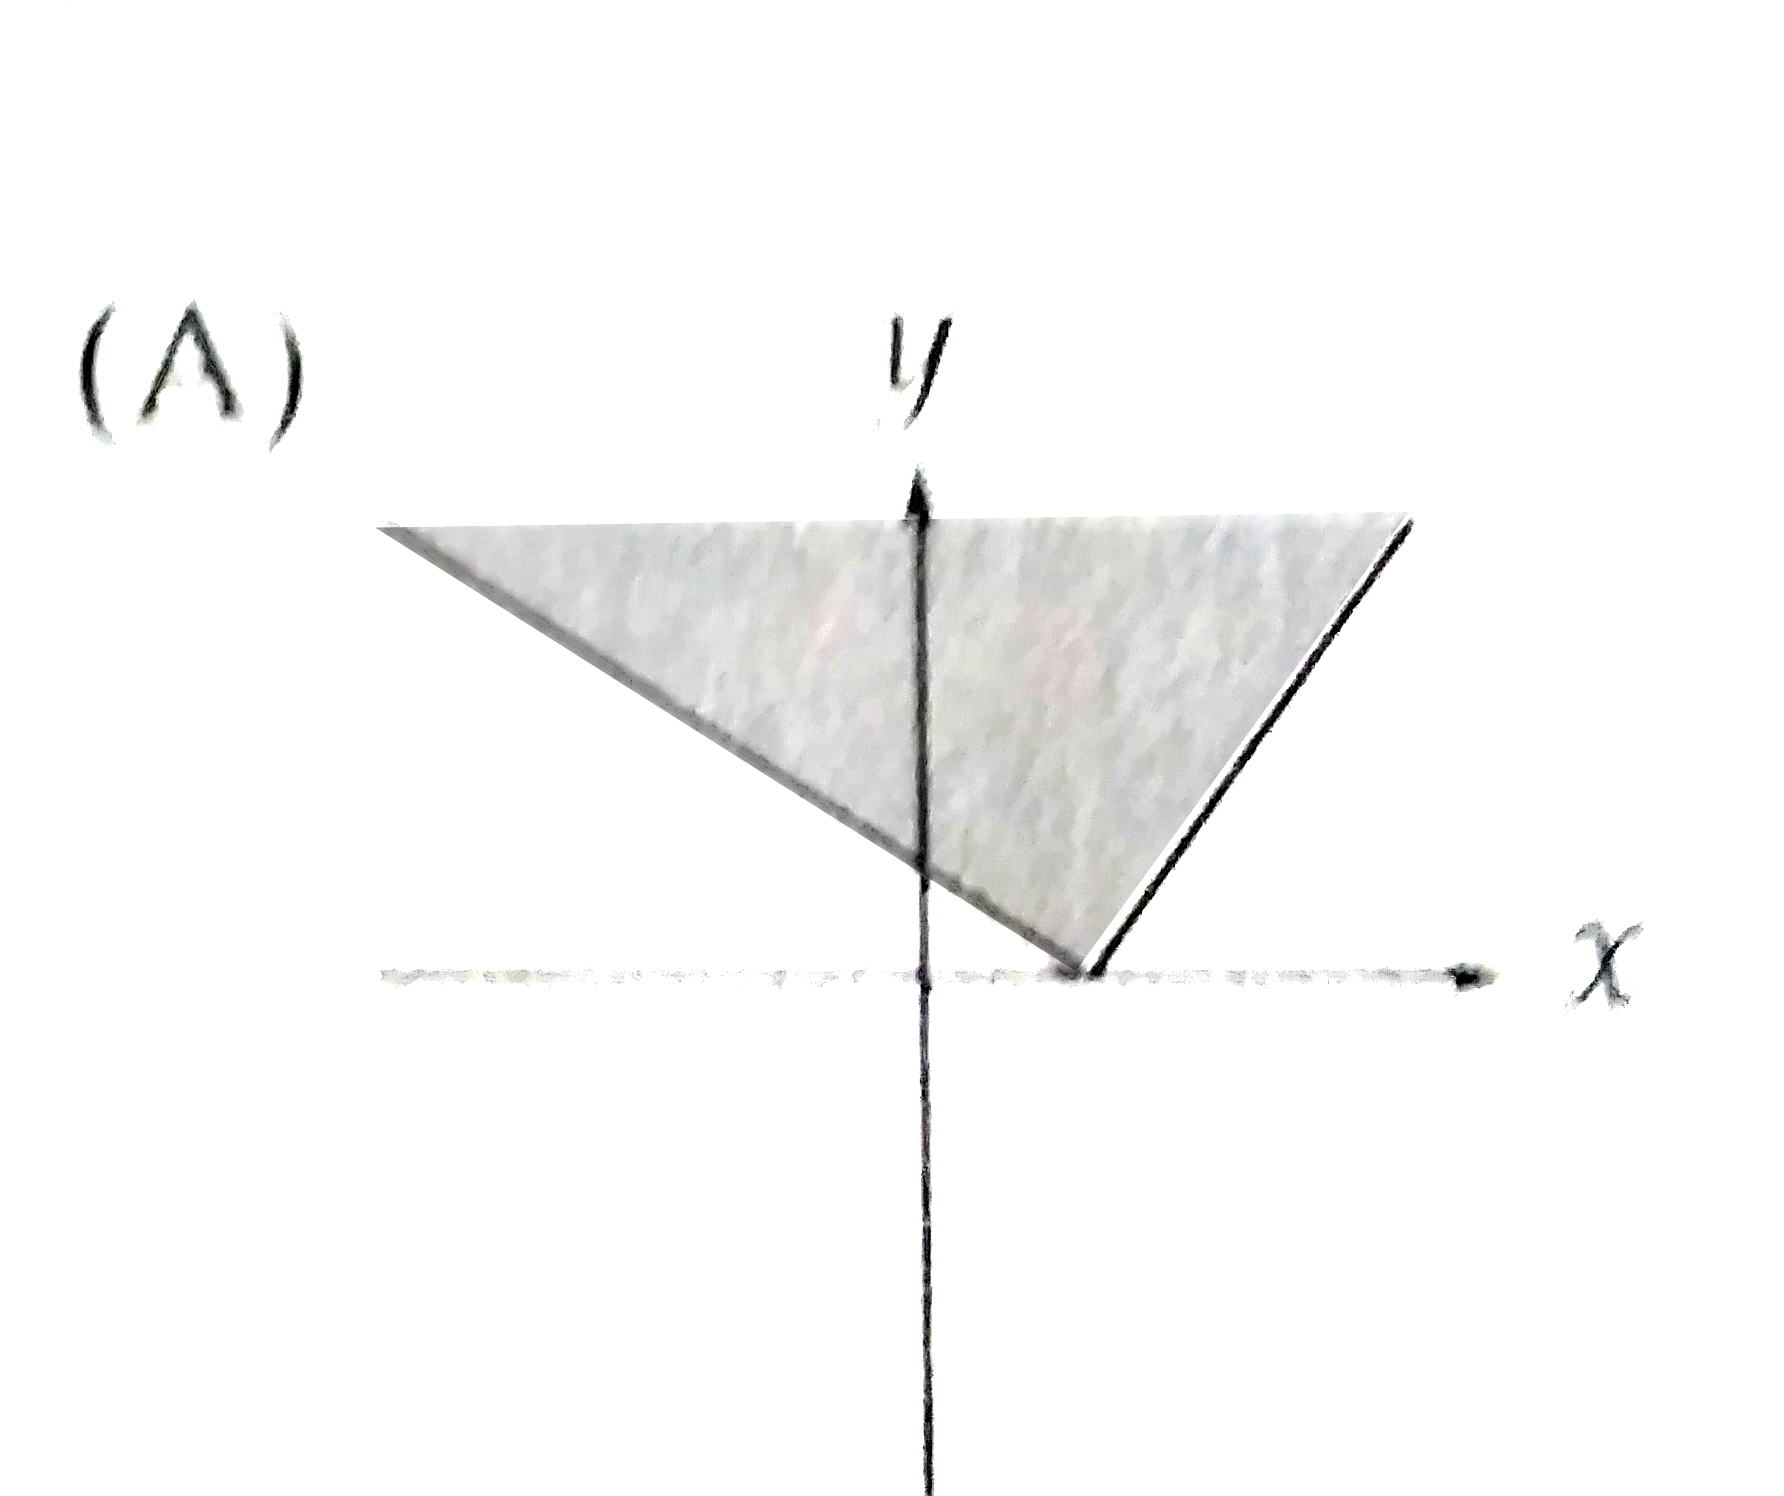
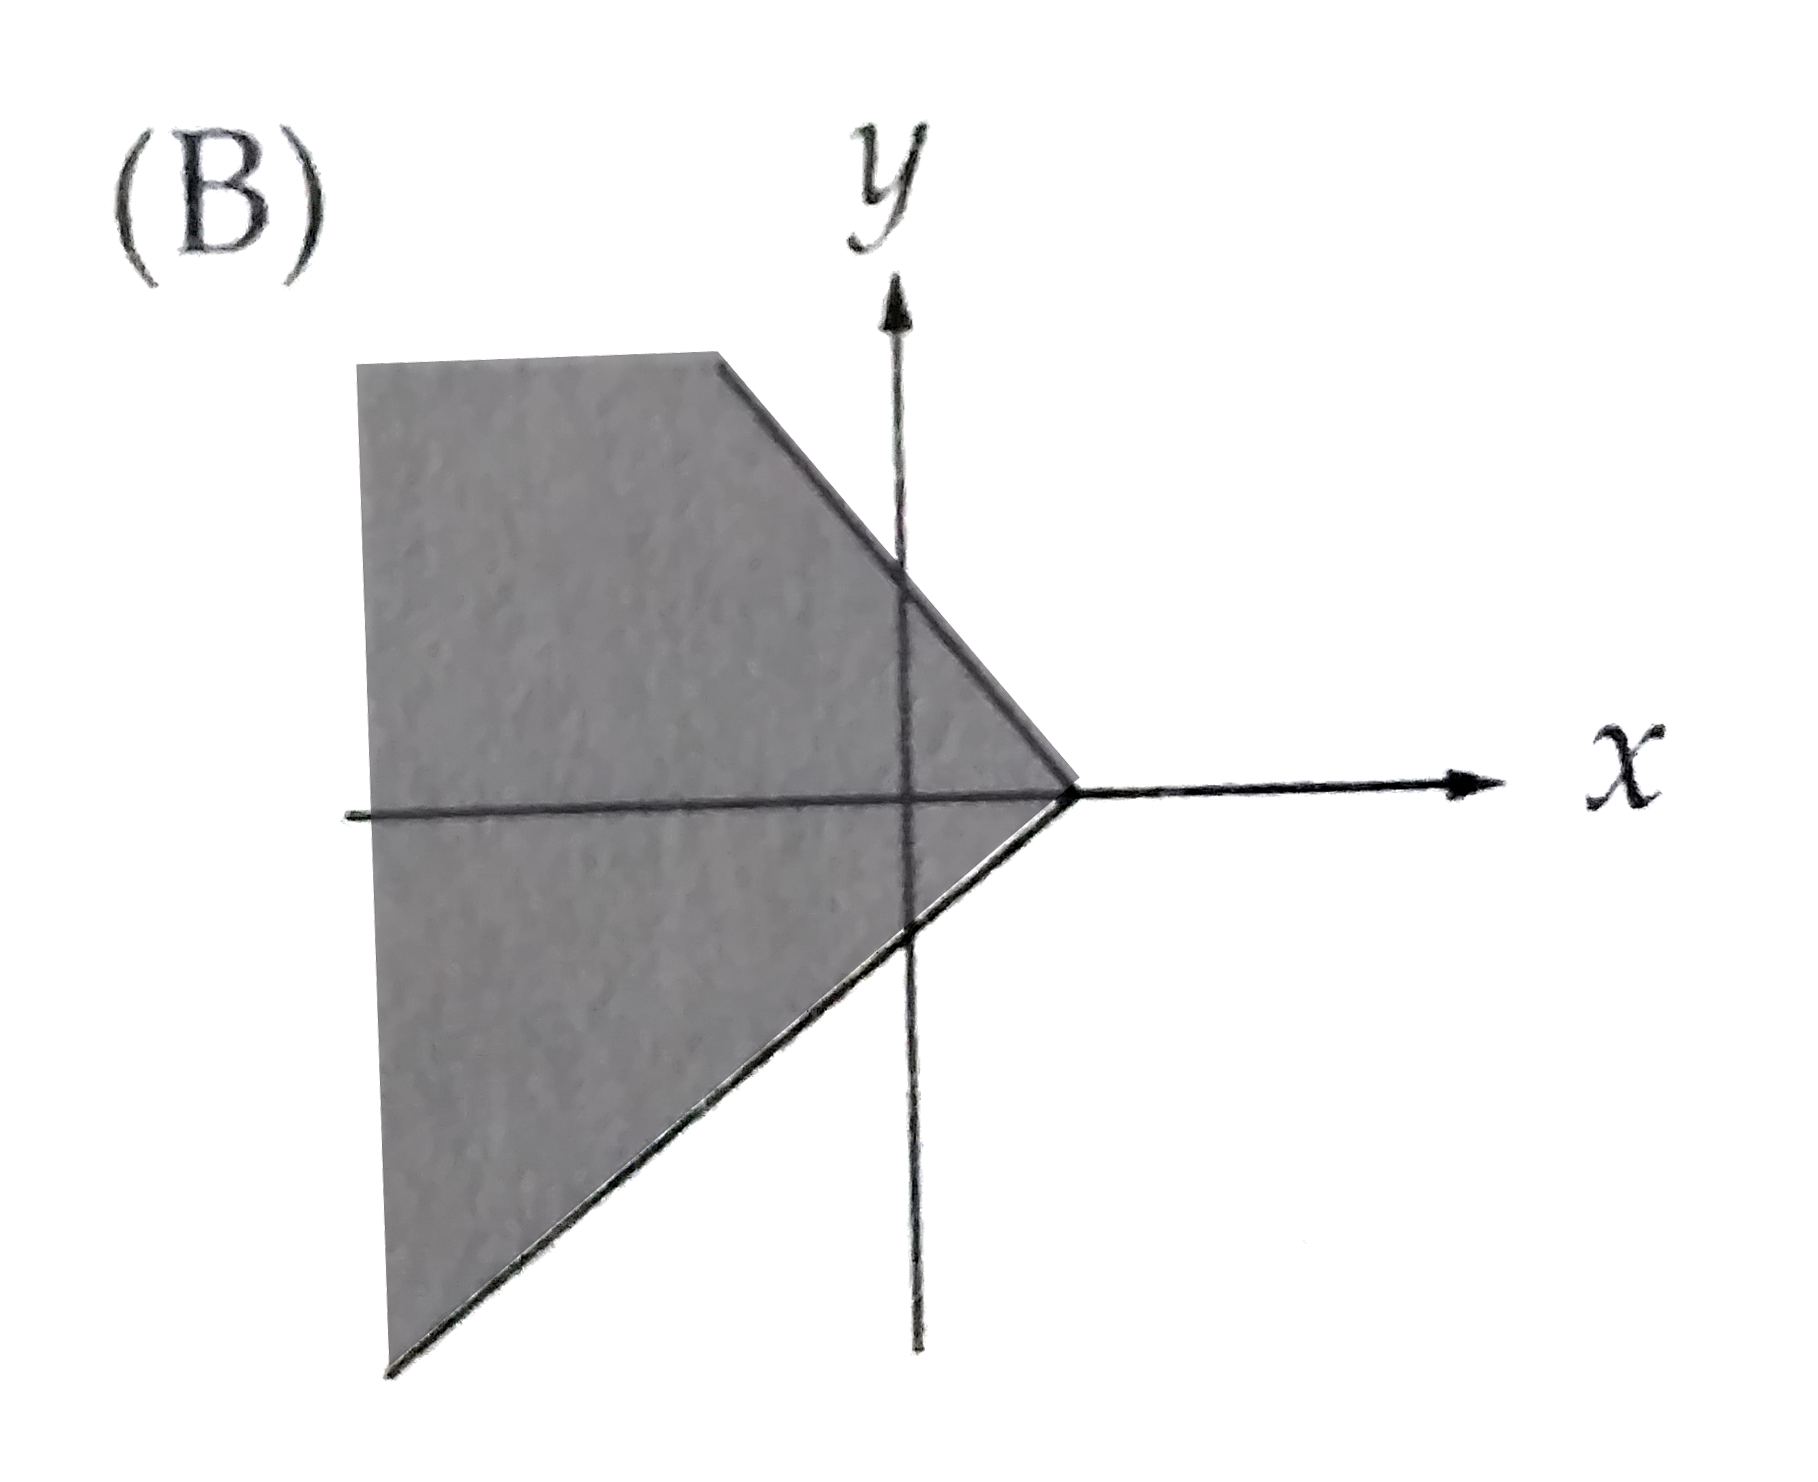
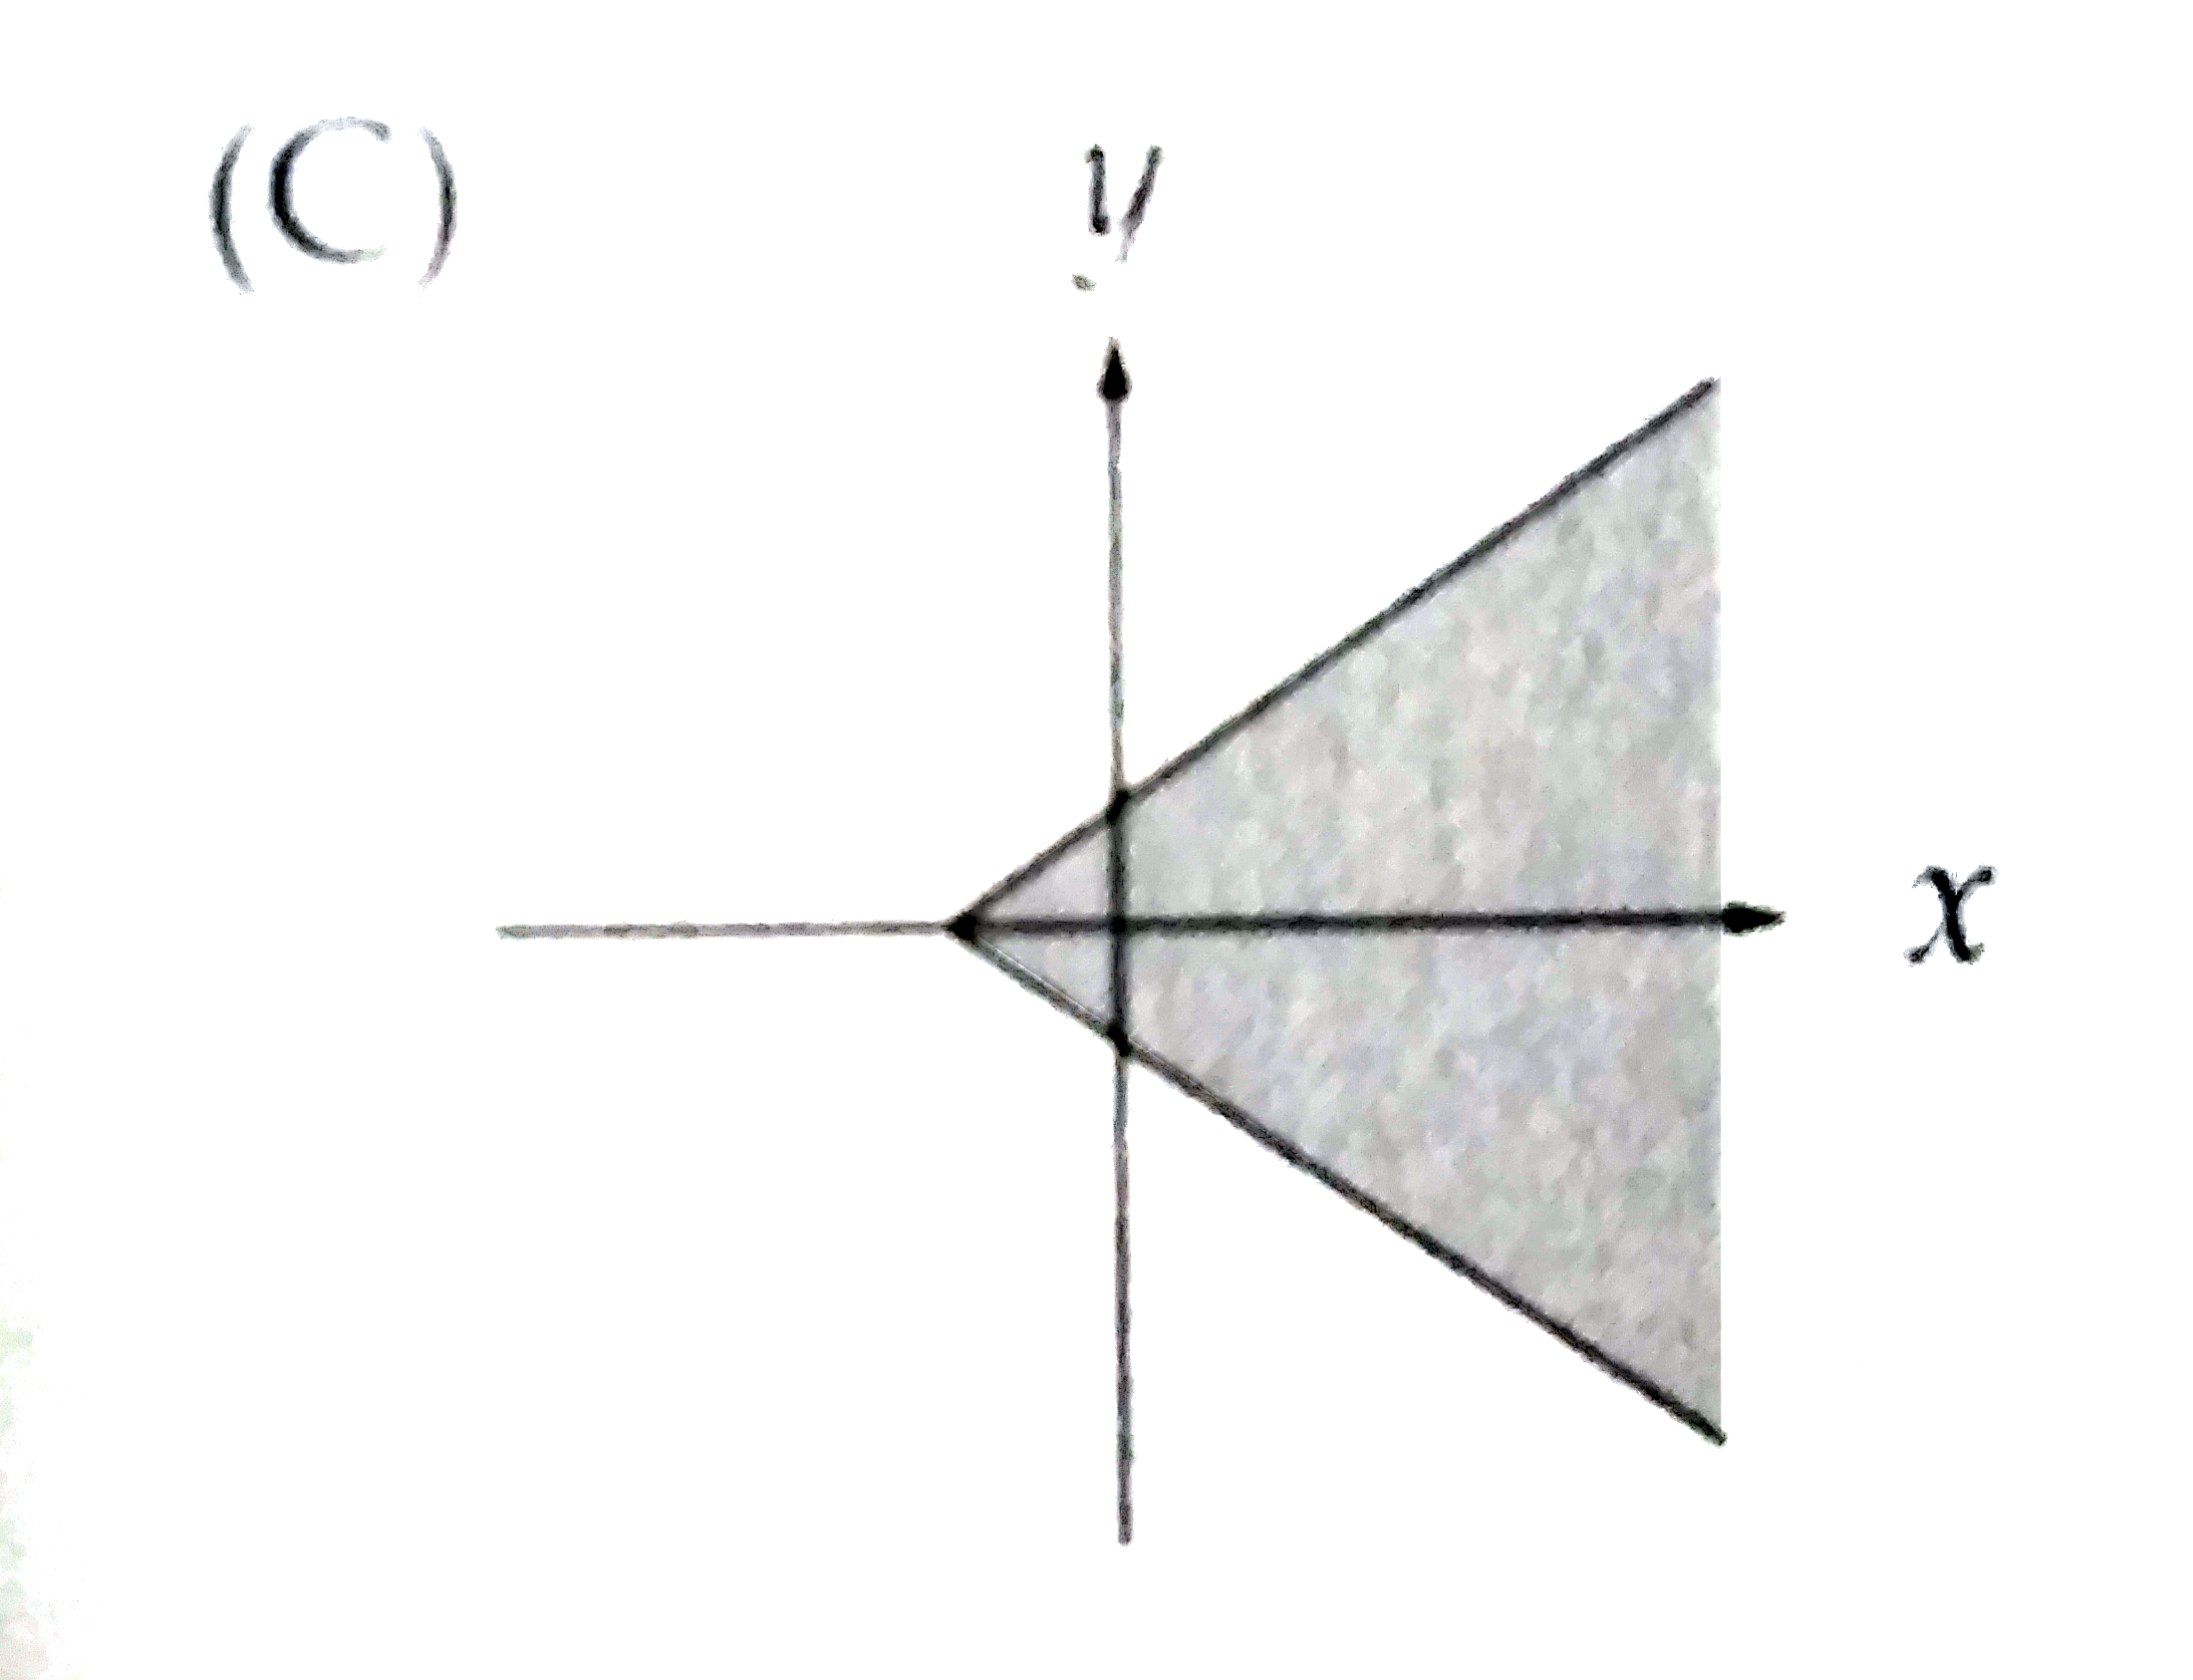
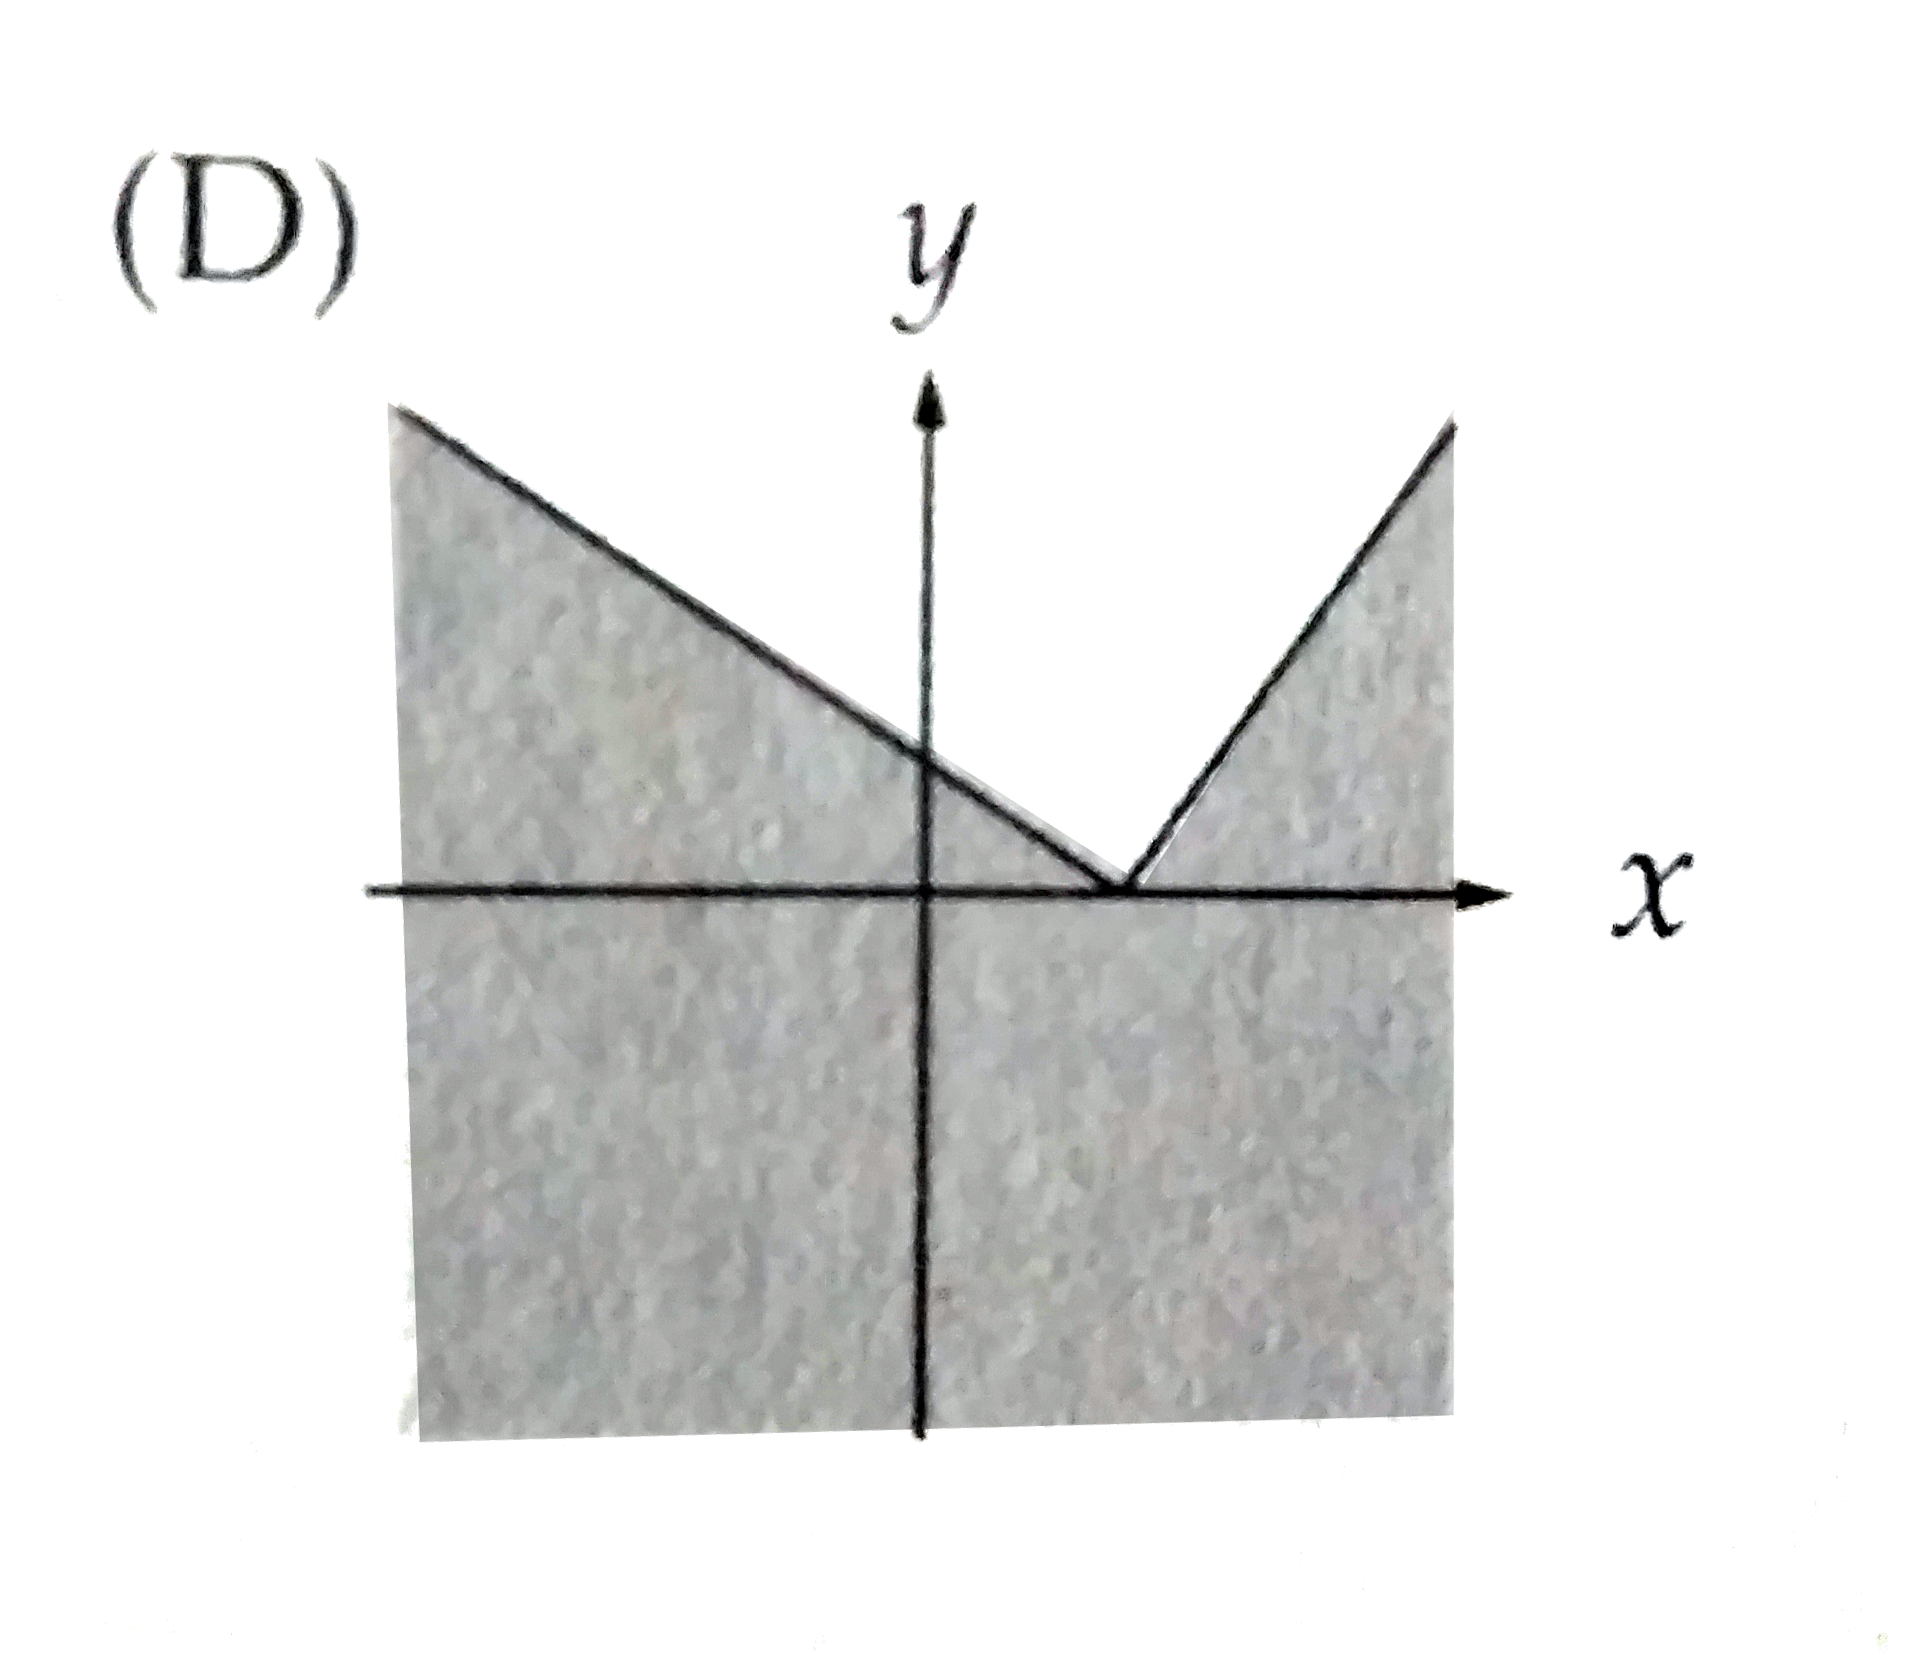
The correct Answer is:D
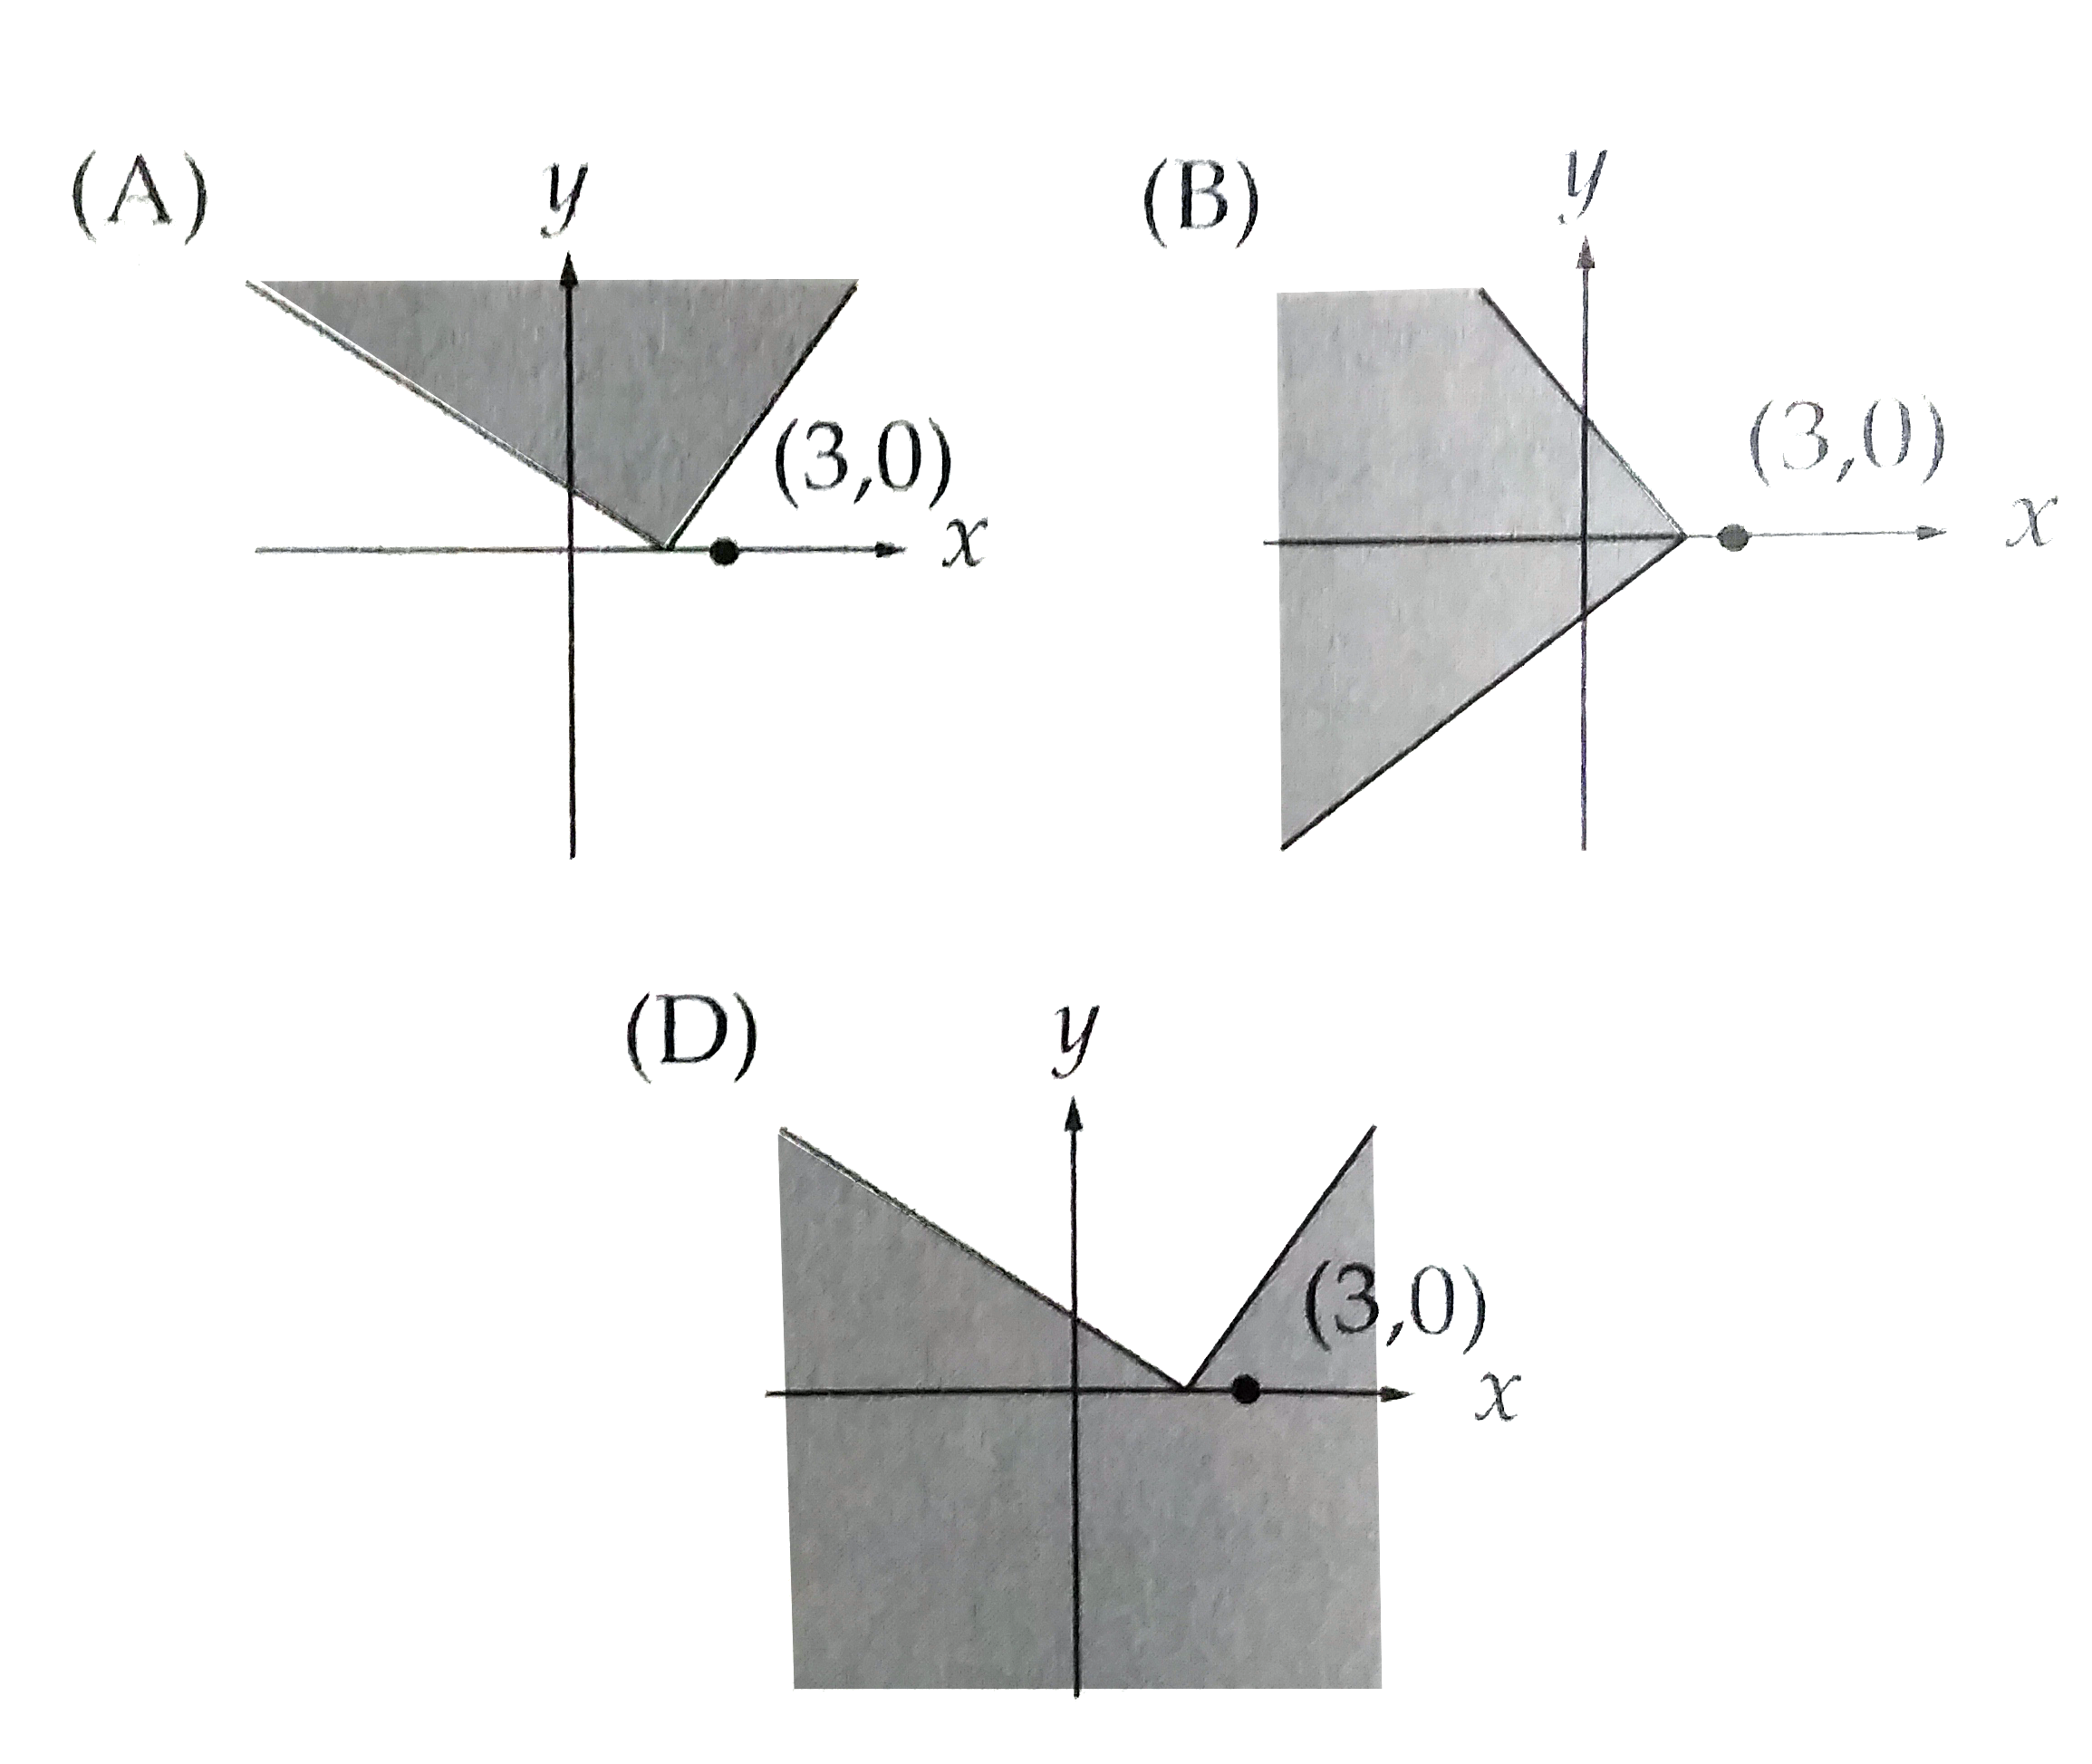
The way to handle an inequality is to think of it as an equation first, plot the line, and then figure out which side of the line to shape. This inequality is extra complicated because of the absolute value. When you graph an equation with abasolute value, you generally get a line with a sharp bend, as in all of the answer choices above. To find the graph of an absolute value equation, figure out where that bend is. In this case, has a turning - point value of 0, which happens when x = 2. So the bend is at the point (2, 0). That narrows the choices down to (A), (B), and (D).
Next, figure out which side gets shaded. Pick a convenient point on either side and see whether that point's coordinates fir the given inequality. The point (3, 0) is an easy one to work with.
Do those coordinates satisfy the inequality ?
Yes. The point (3, 0) must be on the shaded side of the bent line. The answer is (D).
Related Playlists
- BOOK - KAPLANCHAPTER - COORDINATE GEOMETRY EXERCISE - COORDINATE GEOMETRY FOLLOW - UP TEST6videos
COORDINATE GEOMETRY
- BOOK - KAPLANCHAPTER - CIRCLESEXERCISE - Multiple Choice Question12videos
CIRCLES
- BOOK - KAPLANCHAPTER - EXPONENTS, RADICALS, POLYNOMIALS, AND RATIONAL EXPRESSIONS EXERCISE - Multiple Choice Question20videos
EXPONENTS, RADICALS, POLYNOMIALS, AND RATIONAL EXPRESSIONS
Similar Questions
x<4−2y
y≤−2x+1
Which of the following orfdered pairs satisfies both of the inequalities above ?View SolutionConsider the inequality y≥ax2+bx+c, where a , b and c are all positive . Which of the following regions could be the solution set of the inequality ?
View Solution−2y≤8
y−3≤x
−13y+1≥x
Which of the following graphs shows the solutions to the system of inequalities above?View SolutionSolve the inequation 2≤|x−3|≤4
View Solutiony≥x+2
2x+3y≤6
In which of the following does the shaded region represent the solution set in the xy-plane to the system of inequalities above?View SolutionWhenever a>0 , which of the following number line graphs represents the solutions for x to the inequality |x−a|≤3 ?
View Solutiony≤3x+1
x−y>1
Which of the following ordered pairs (x,y) satisfies the system of inequalities above?View SolutionSolve the inequation: |x−2|≤5
View SolutionIf 0≤t≤1, which of the following graphs is the graph of y versus x where x and y are related by the parametric equations y=t2 and x=√t ?
View SolutionSolve the inequation: 1≤|x+1|≤2
View Solution

