Use the tables below to draw line graphs.
The number of days a hill side city received snow in different years.

Step by step video & image solution for Use the tables below to draw line graphs. The number of days a hill side city received snow in different years. by Maths experts to help you in doubts & scoring excellent marks in Class 8 exams.
Related Playlists
- BOOK - MTG IIT JEE FOUNDATIONCHAPTER - INTRODUCTION TO GRAPHS EXERCISE - NCERT SECTIONS (15.2)6videos
INTRODUCTION TO GRAPHS
- BOOK - MTG IIT JEE FOUNDATIONCHAPTER - INTRODUCTION TO GRAPHS EXERCISE - NCERT SECTIONS (15.3)4videos
INTRODUCTION TO GRAPHS
- BOOK - MTG IIT JEE FOUNDATIONCHAPTER - INTRODUCTION TO GRAPHS EXERCISE - SOLVED EXAMPLES25videos
INTRODUCTION TO GRAPHS
- BOOK - MTG IIT JEE FOUNDATIONCHAPTER - FOOTSTEPS TOWARDS JEE MAINEXERCISE - Section B (Numerical Value Type Questions)9videos
FOOTSTEPS TOWARDS JEE MAIN
- BOOK - MTG IIT JEE FOUNDATIONCHAPTER - LINEAR EQUATIONS IN ONE VARIABLEEXERCISE - Olympiad/HOTS Corner15videos
LINEAR EQUATIONS IN ONE VARIABLE
Knowledge Check
- Question 1 - Select One
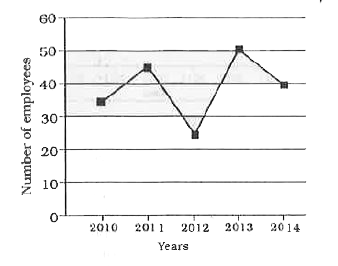
Study the following line chart carefully and answer the questions given below it. The following line chart represents the number of employees recrulted in different years in a company.

What was the ratio of number of employees recruited in the year 2011 to that in the year 2013?A2:3B9:10C10:9D5:9 - Question 1 - Select One
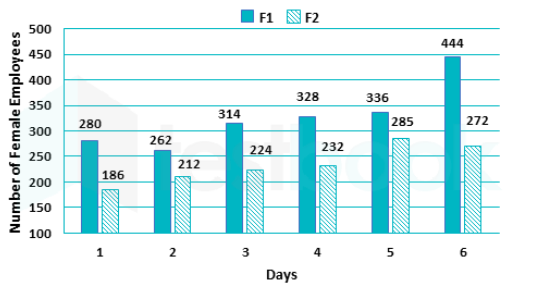
The Bar graph given below presents the number of female employees working in two factories on six different days of a week.

On which day the number of female workers in the factories Fl and F2, taken together, is the second highest?AA) D3BB) D6CC) D5DD) D4
Similar Questions
Use the tables below to draw linear graphs. (a) The number of days a hill side city received snow in different years. Years 2003,2004,2005and2006 and Days 8,10,5,and12 (b) Population (in thousands) of men and women in a village in different years.
View SolutionIn the table below, write the number of sides the polygon has :
 View Solution
Use the table given below to draw the graph.Use the graph drawn to find the value of a and b.
View SolutionTo draw the graph of a line, the least number of points required is
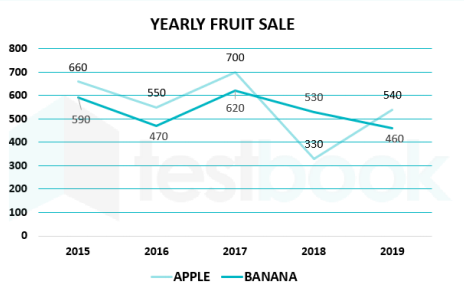
View SolutionDirection: Read the Graph carefully and answer the following quesitons: The following Line graph shows the number of Fruits (Apple and Banana) sold in five different years.

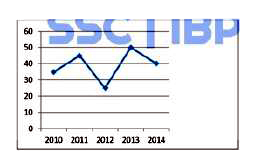
In which year is the difference between the sale of apple and banana recorded the most?View SolutionStudy the following line chart carefuly and answer the question given below. The following line chart represents the number of employee recruited in different years in a company.

What was the ratio of number of employees recruited in year 2011 to that in year 2013?View SolutionStudy the table given below and draw a line graph for it.

Is the graph drawn, a linear graph ?View SolutionStudy the table given below and draw a line graph for it.

Is the graph drawn, a linear graph ?View Solution

