The two graphs below compare Car A and Car B. The left graph shows the relationship between age and value. The right graph shows the relationship between size and maximum speed.
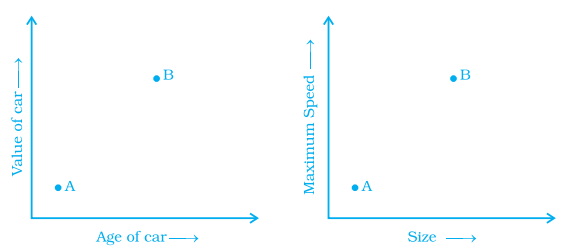
Use the graphs to determine whether each statement is true or false, and explain your answer.
(a) The older car is less valuable.
(b) The faster car is larger.
(c) The larger car is older.
(d) The faster car is older.
(e) The more valuable car is slower.
Step by step video & image solution for The two graphs below compare Car A and Car B. The left graph shows the relationship between age and value. The right graph shows the relationship between size and maximum speed. Use the graphs to determine whether each statement is true or false, and explain your answer. (a) The older car is less valuable. (b) The faster car is larger. (c) The larger car is older. (d) The faster car is older. (e) The more valuable car is slower. by Maths experts to help you in doubts & scoring excellent marks in Class 8 exams.
Related Playlists
- BOOK - NCERT EXEMPLARCHAPTER - INTRODUCTION TO GRAPHS EXERCISE - THINK AND DISCUSS4videos
INTRODUCTION TO GRAPHS
- BOOK - NCERT EXEMPLARCHAPTER - EXPONENTS AND POWERSEXERCISE - EXERCISE195videos
EXPONENTS AND POWERS
- BOOK - NCERT EXEMPLARCHAPTER - LINEAR EQUATIONS IN ONE VARIABLEEXERCISE - THINK AND DISCUSS3videos
LINEAR EQUATIONS IN ONE VARIABLE
Knowledge Check
- Question 1 - Select One
The graph given here shows a car following the linear path with uniform speed. Study the graph and answer the questions.
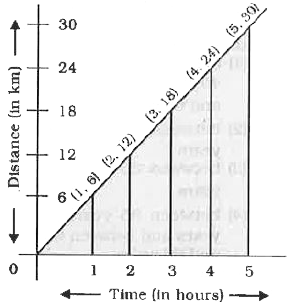
The speed of the car isA12 km/hrB6 km/hrC18 km/hrD24 km/hr - Question 1 - Select One
The graph given here shows a car following the linear path with uniform speed. Study the graph and answer the questions.
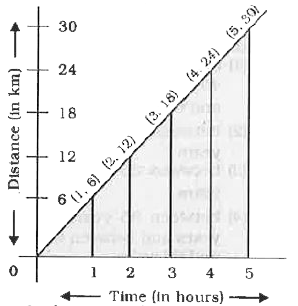
The distance travelled by the car in 4.5 hours isA27 kmB30 kmC36 kmD40 km - Question 1 - Select One
The given graph shows Nisha’s trip to a mall by a car. Observe the graph carefully and find what was she doing between 5 pm and 7 pm?
ADriving to the mall.BDriving back home.CWas not driving.DNot enough data to answer - Question 1 - Select One
The graph given here shows a car following the linear path with uniform speed. Study the graph and answer the questions.
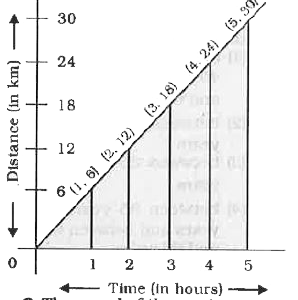
The speed of the car (in metres per minute) isA60B100C600D1000 - Question 1 - Select One
The graph given here shows a car following the linear path with uniform speed. Study the graph and answer the questions.
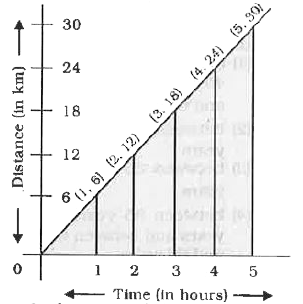
The car covers a distance of 15 kilometres inA3 hoursB2 hoursC1.5 hoursD2.5 hours - Question 1 - Select One
Figure shows position-time graph of two cars A and B.
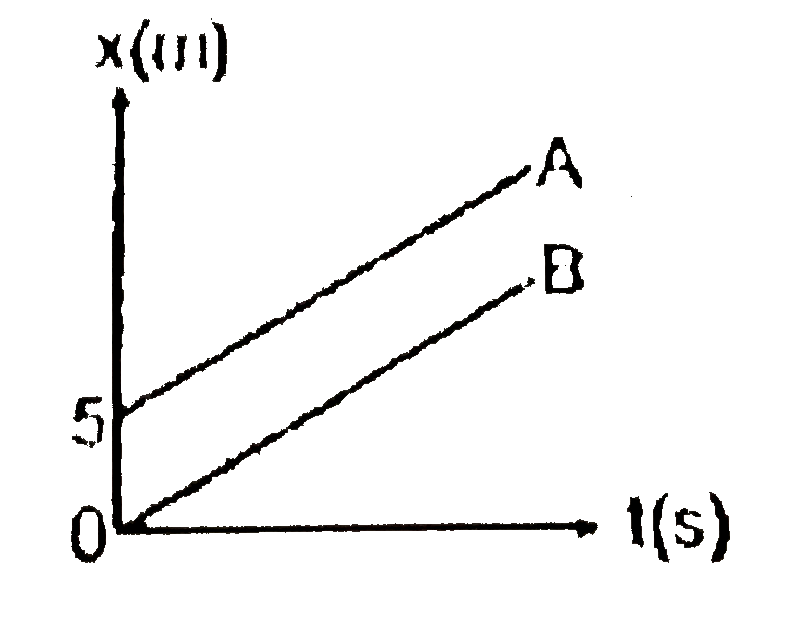 ACar A is faster than car B.BCar B is faster than car A.CBoth cars are moving with same velocity.DBoth cars have positive acceleration.
Similar Questions
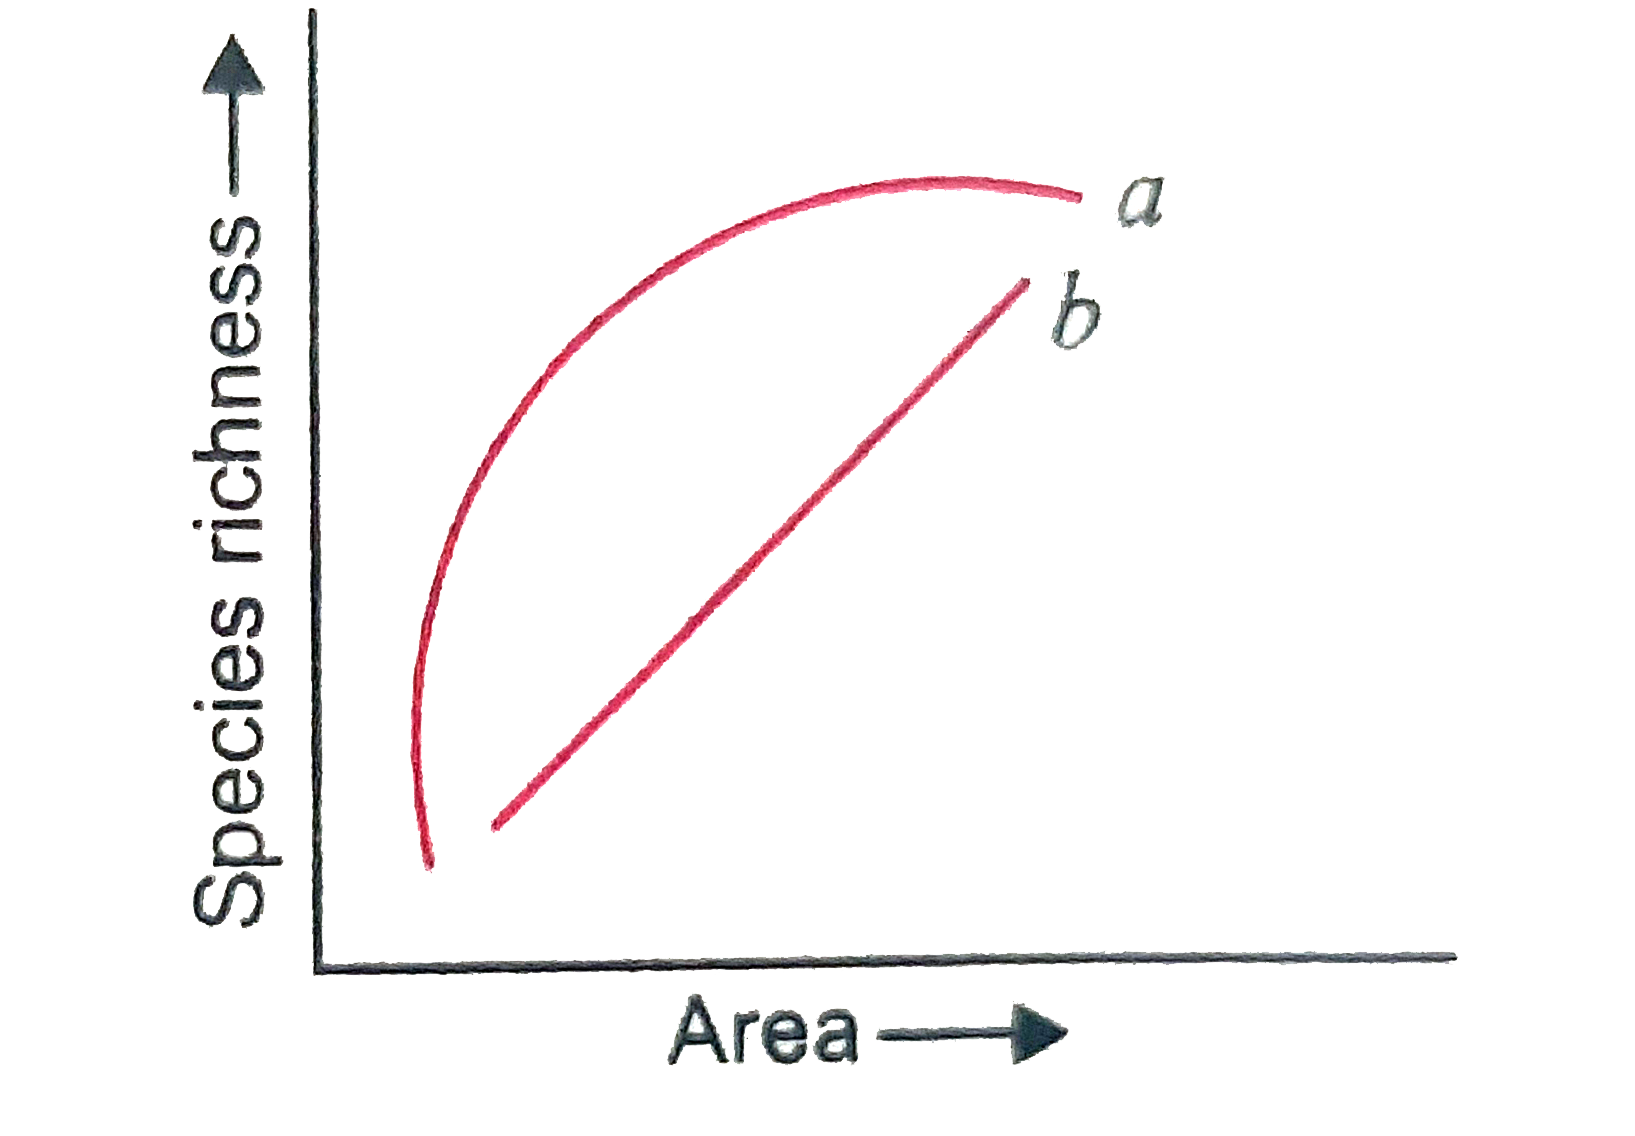
The given graph shows species-area relationship. Write the equation of the curve 'a' and explain.
 View Solution
From the data given below, draw a linear graph showing the relationship between the cost of trousers and the number of trousers.
 View Solution
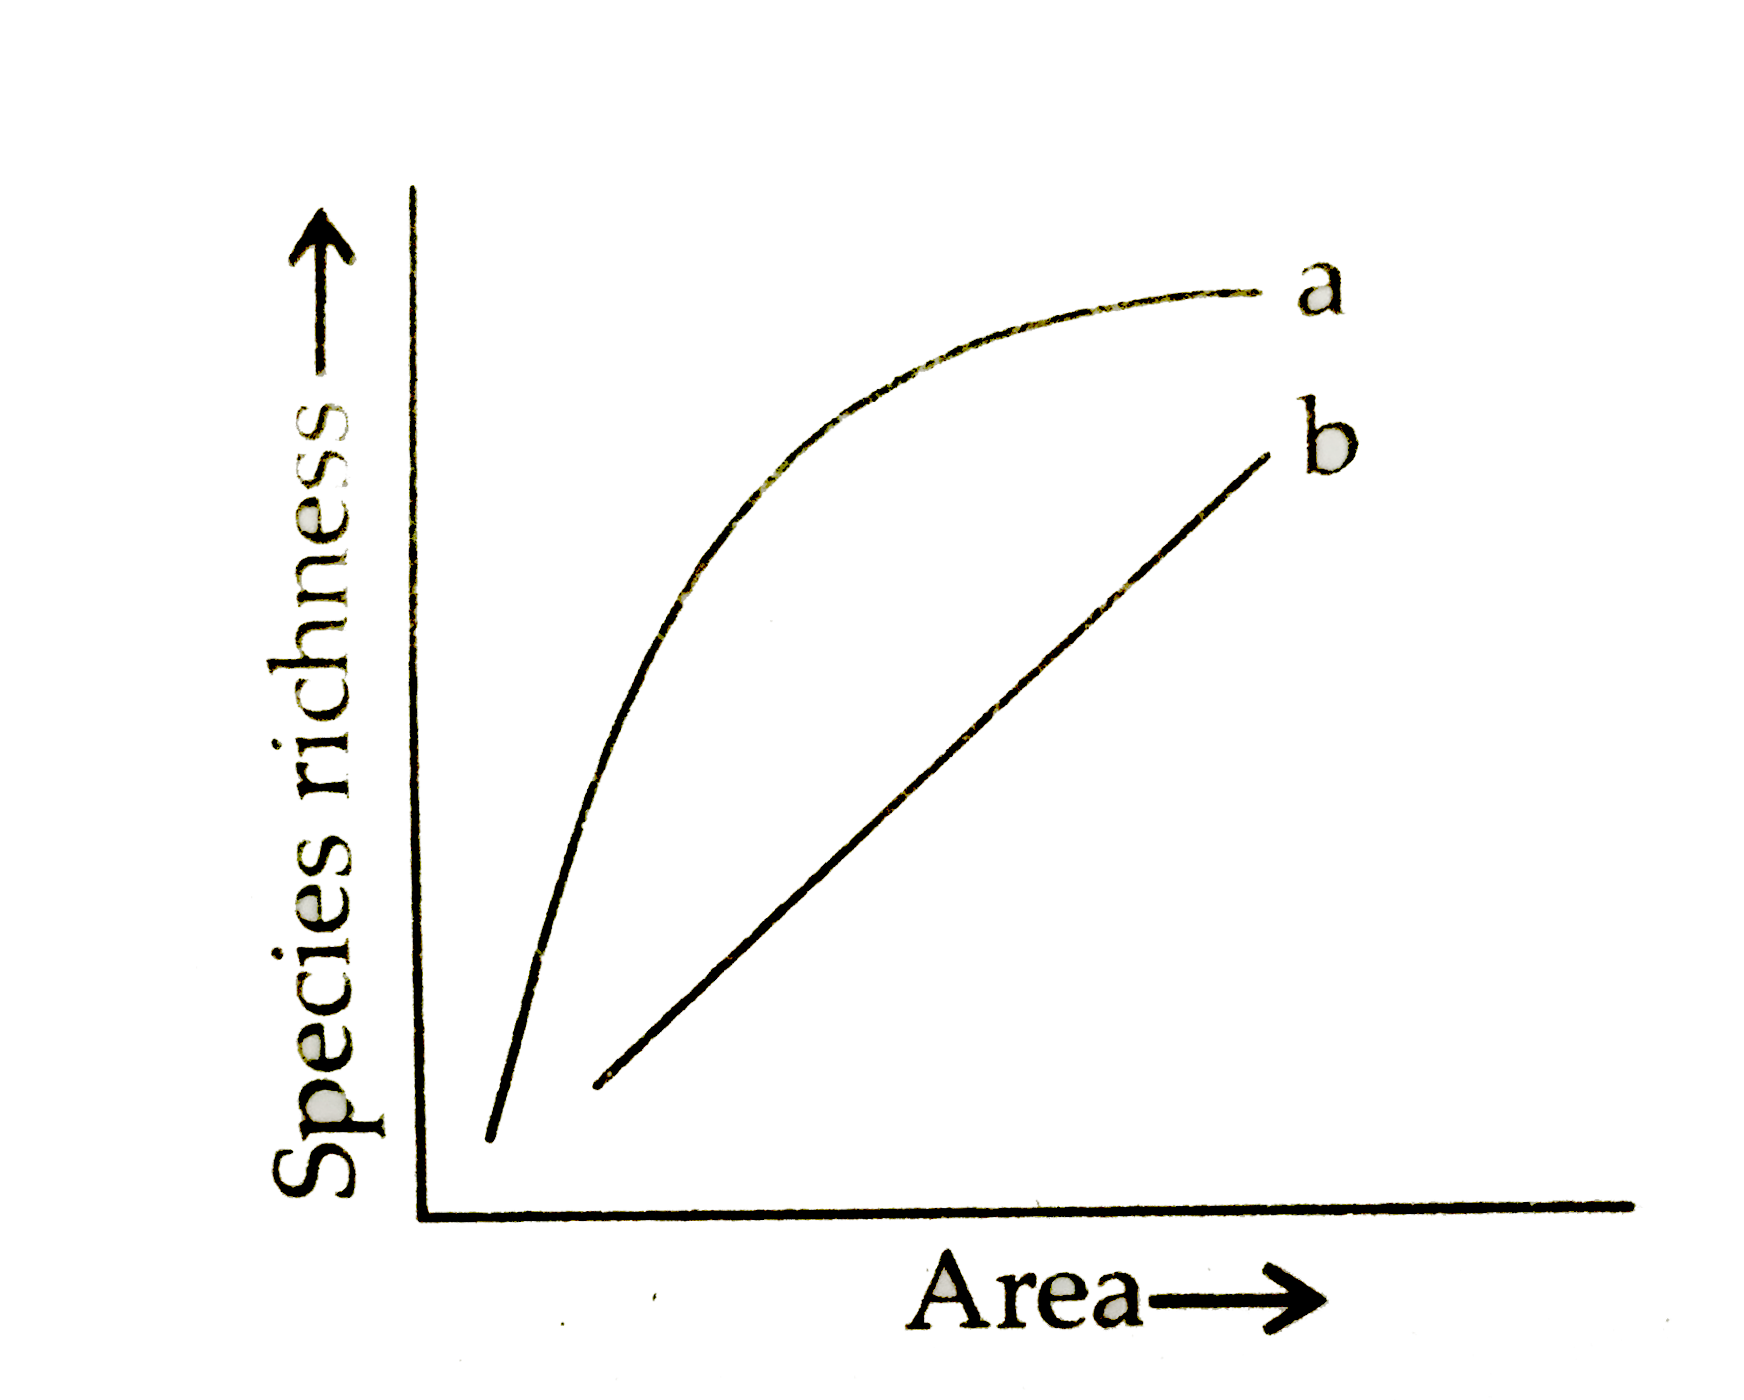
The above graph show Species-Area relationship. Write the equation of the curve a and explain.
 View Solution
The following graph shows the sales of cars (in thousands) in four cities in 4 years. Study the graph and answer the question.
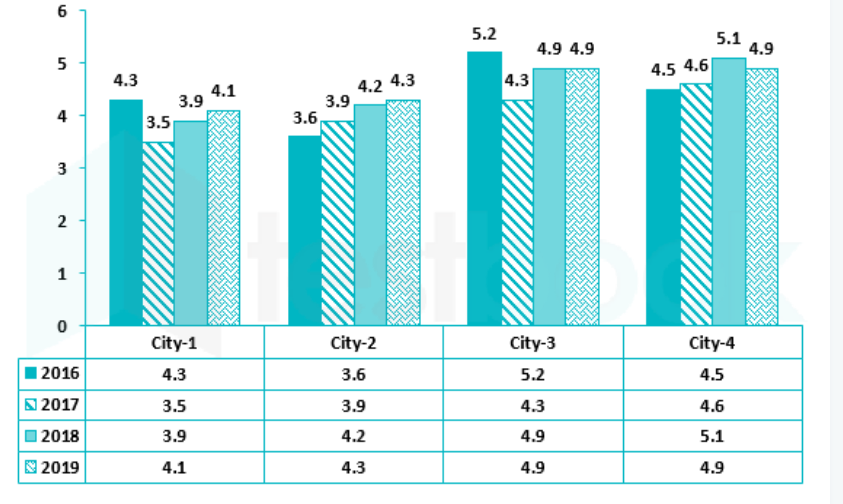
Which city has the highest percentage of sales, and in which year?View Solution

