The table given below shows the daily attendance in thousands at a certain exhibition over a period of one week.
WeekSunMonTueWedThurFrisatAttendance52486468527072
Calculate three day moving average and illustrate these and original information of the same graph using the same scales.
The correct Answer is:(##OSWISCSQPMATXIQP04_E01055_A01##)
Related Playlists
Similar Questions
The table given below shows the number of visitors (in hundreds) to a certain exhibition over a period of two weeks:

Calculate 6-day moving averages and illustrate these and original information on the same graph using the some scales.View SolutionThe following table shows the number of toys sold by a mart during a week. Draw a line graph to represent the given data.
WeekMonTueWedThursFriSatSunNumber of Toys21101724101620View SolutionThe table given below shows the number of visitors ( in hundreds ) to a certain exhibition over a period of two weeks :

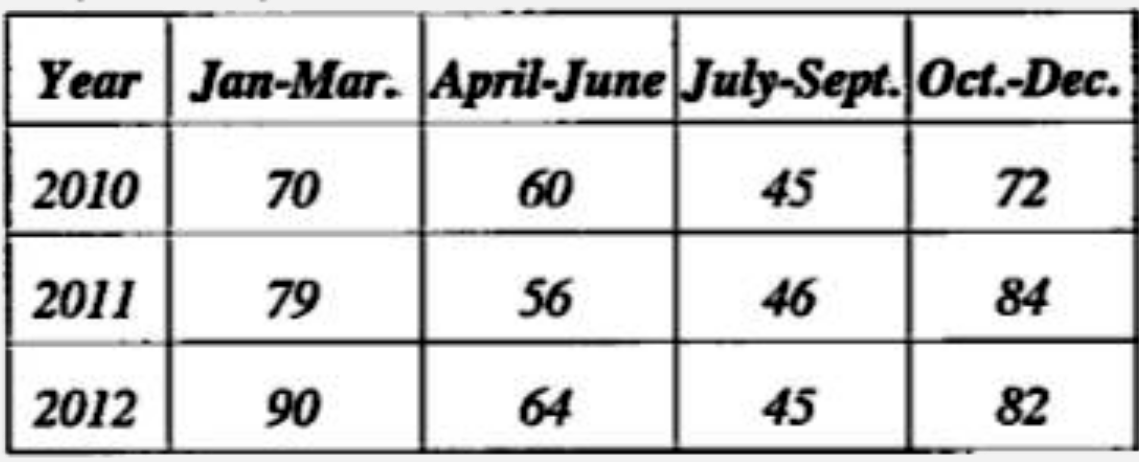
Calculate the 7 day moving averages and illustrate these and the original information on the same table.View SolutionThe number of road accidents in the city due to rash driving over a period of 3 years, is given in the following table :

Calculate four quarterly moving averages and illustrate them and original figures on one graph using the same axes for both.View SolutionThe following table shows the daily production of T.V. sets in an industry for 7 days of a week: Day, Mon, Tue, Wed, Thurs, Fri, Sat, Sun No. of T.V. Sets, 300, 400, 150, 250, 100, 350, 200 Represent the above information by a pictograph
View SolutionDaily absence from a school during three weeks is recorded as follows :

Draw a graph , illustrating the above data . Calculate the 5 - days moving average and plot them on the same graph .View SolutionThe water bills (in rupees) of 32 houses in a certain street for the period 1.1.98 to 31.3.98 are given below: 56,43,32,38,56,24,68,85,52,47,35,58,63,74,27,84,69,35,44,75,55,30,54,65,45,67,95,72,43,65,35,59 Tabulate the data and present the data as a cumulative frequency table using 70-79 as one of the class intervals.
View SolutionThe water bills (in rupees) of 32 houses in a certain street for the period 1.1.98 to 31.3.98 are given below: 56,43,32,38,56,24,68,85,52,47,35,58,63,74,27,84,69,35,44,75,55,30,54,65
,45,67,95,72, 43,65,35,59 Tabulate the data and present the data as a cumulative frequency table using 70-79 as one of the class intervals.View SolutionCrowdfunding is a popular way to raise money using the Internet The process sounds simple an artist, entrepreneur, or other innovator takes his or her ideas straight to the public via a crowdfunding webs. The innovator creates a video about the project and offers, in exchange for donations, a series of perks," from acknowledgment on a social media site to a small piece of art. Many crowdfunding programs are all-or-nothing, In other words, the innovator must garner 100 percent funding for the project or the money is refunded to the donors. At it's best, the system can give creators direct access to millions of potential backers. The home page of one leading crowdfunding site features a project to manufacture pinhole cameras on a 3-D printer. Ea The idea is obviously very attractive. An obscure method of photography may be made available to many with little expense. Within weeks, the project was 621 percent funded. in contrast, on the same page, a small Brooklyn performance venue is attempting to raise money for its current season. The venue features works of performance art showcased in a storefront window. Those who have seen the space consider it vital. low ever, that group may not be large enough, with iu•t fourteen days to go in the fund raising period, the campaign is only 46 percent funded.
Artists such as these Brooklyn performers find that crowdfunding exacerbates problems that already exist. El Work, that is easily understood and appreciated, is supported, while more complex work goes unnoticed. Time that could be used creating art is spent devising clever perks to draw the attention of potential contributors. 28 In addition, audiences may contain many 'free riders," they did not make contributions.
ironically, the success of crowdfunding may weaken overall funding for the arts if people begin to feel that paying for the art 30 loved by them is someone else's responsibility. til One innovative playwright has woven the deficiencies of the system into her crowdfunding model. 121 Though the price for her tickets was higher than that of tickets for comparable shows, it was still affordable to most theatergoers—and reflected the real cost of the performance. [3] She presented the total cost for producing her play on a crowdfunding site. [4] Then she divided the total cost by the number of people she expected to attend the performance. [5) The result of the calculation was the minimum donor price, and only donors who paid at least the minimum ticket price were allowed to attend the performance. [6) By subverting the presumption that money used for her project is an altruistic donation, the playwright showed that W our work has monetary value to those who enjoy It.

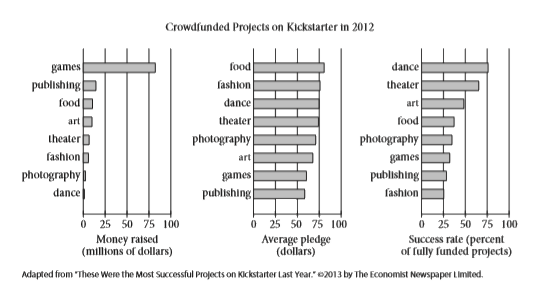
Which choice offers an accurate interpretation of the data in the graph?View SolutionCrowdfunding is a popular way to raise money using the Internet The process sounds simple an artist, entrepreneur, or other innovator takes his or her ideas straight to the public via a crowdfunding webs. The innovator creates a video about the project and offers, in exchange for donations, a series of perks," from acknowledgment on a social media site to a small piece of art. Many crowdfunding programs are all-or-nothing, In other words, the innovator must garner 100 percent funding for the project or the money is refunded to the donors. At it's best, the system can give creators direct access to millions of potential backers. The home page of one leading crowdfunding site features a project to manufacture pinhole cameras on a 3-D printer. Ea The idea is obviously very attractive. An obscure method of photography may be made available to many with little expense. Within weeks, the project was 621 percent funded. in contrast, on the same page, a small Brooklyn performance venue is attempting to raise money for its current season. The venue features works of performance art showcased in a storefront window. Those who have seen the space consider it vital. low ever, that group may not be large enough, with iu•t fourteen days to go in the fund raising period, the campaign is only 46 percent funded.
Artists such as these Brooklyn performers find that crowdfunding exacerbates problems that already exist. El Work, that is easily understood and appreciated, is supported, while more complex work goes unnoticed. Time that could be used creating art is spent devising clever perks to draw the attention of potential contributors. 28 In addition, audiences may contain many 'free riders," they did not make contributions.
ironically, the success of crowdfunding may weaken overall funding for the arts if people begin to feel that paying for the art 30 loved by them is someone else's responsibility. til One innovative playwright has woven the deficiencies of the system into her crowdfunding model. 121 Though the price for her tickets was higher than that of tickets for comparable shows, it was still affordable to most theatergoers—and reflected the real cost of the performance. [3] She presented the total cost for producing her play on a crowdfunding site. [4] Then she divided the total cost by the number of people she expected to attend the performance. [5) The result of the calculation was the minimum donor price, and only donors who paid at least the minimum ticket price were allowed to attend the performance. [6) By subverting the presumption that money used for her project is an altruistic donation, the playwright showed that W our work has monetary value to those who enjoy It.
Which choice most effectively combines the underlined sentences?View Solution

