The marks obtained (out of 100) by a class of 80 students are given below
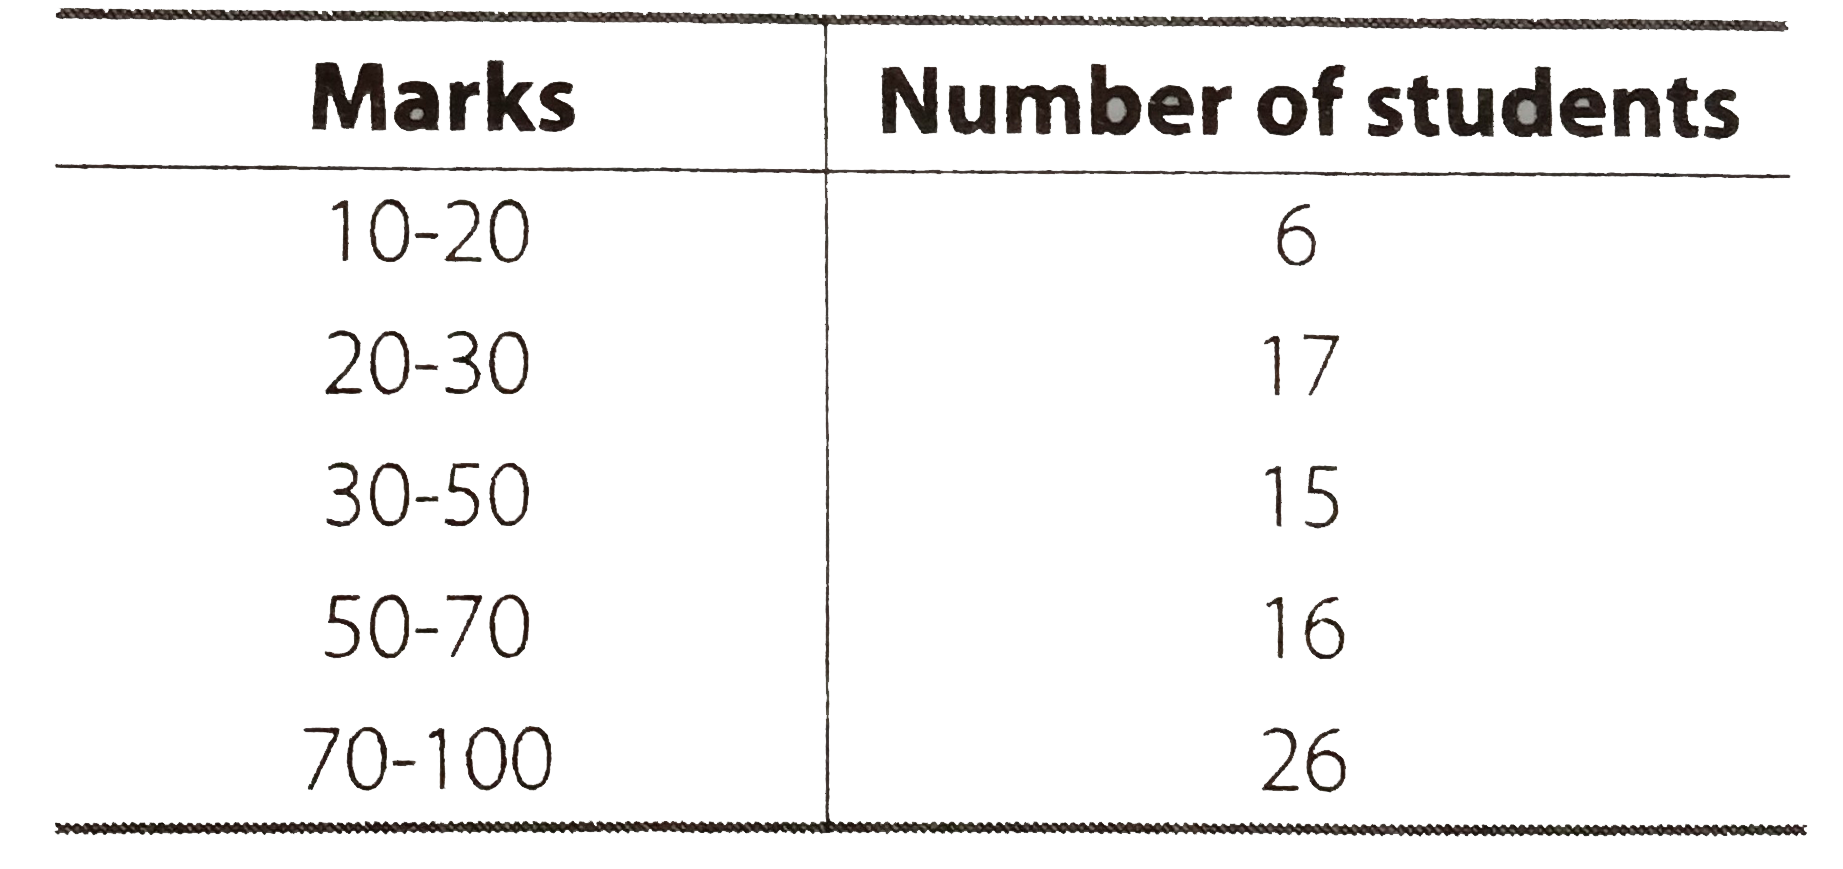
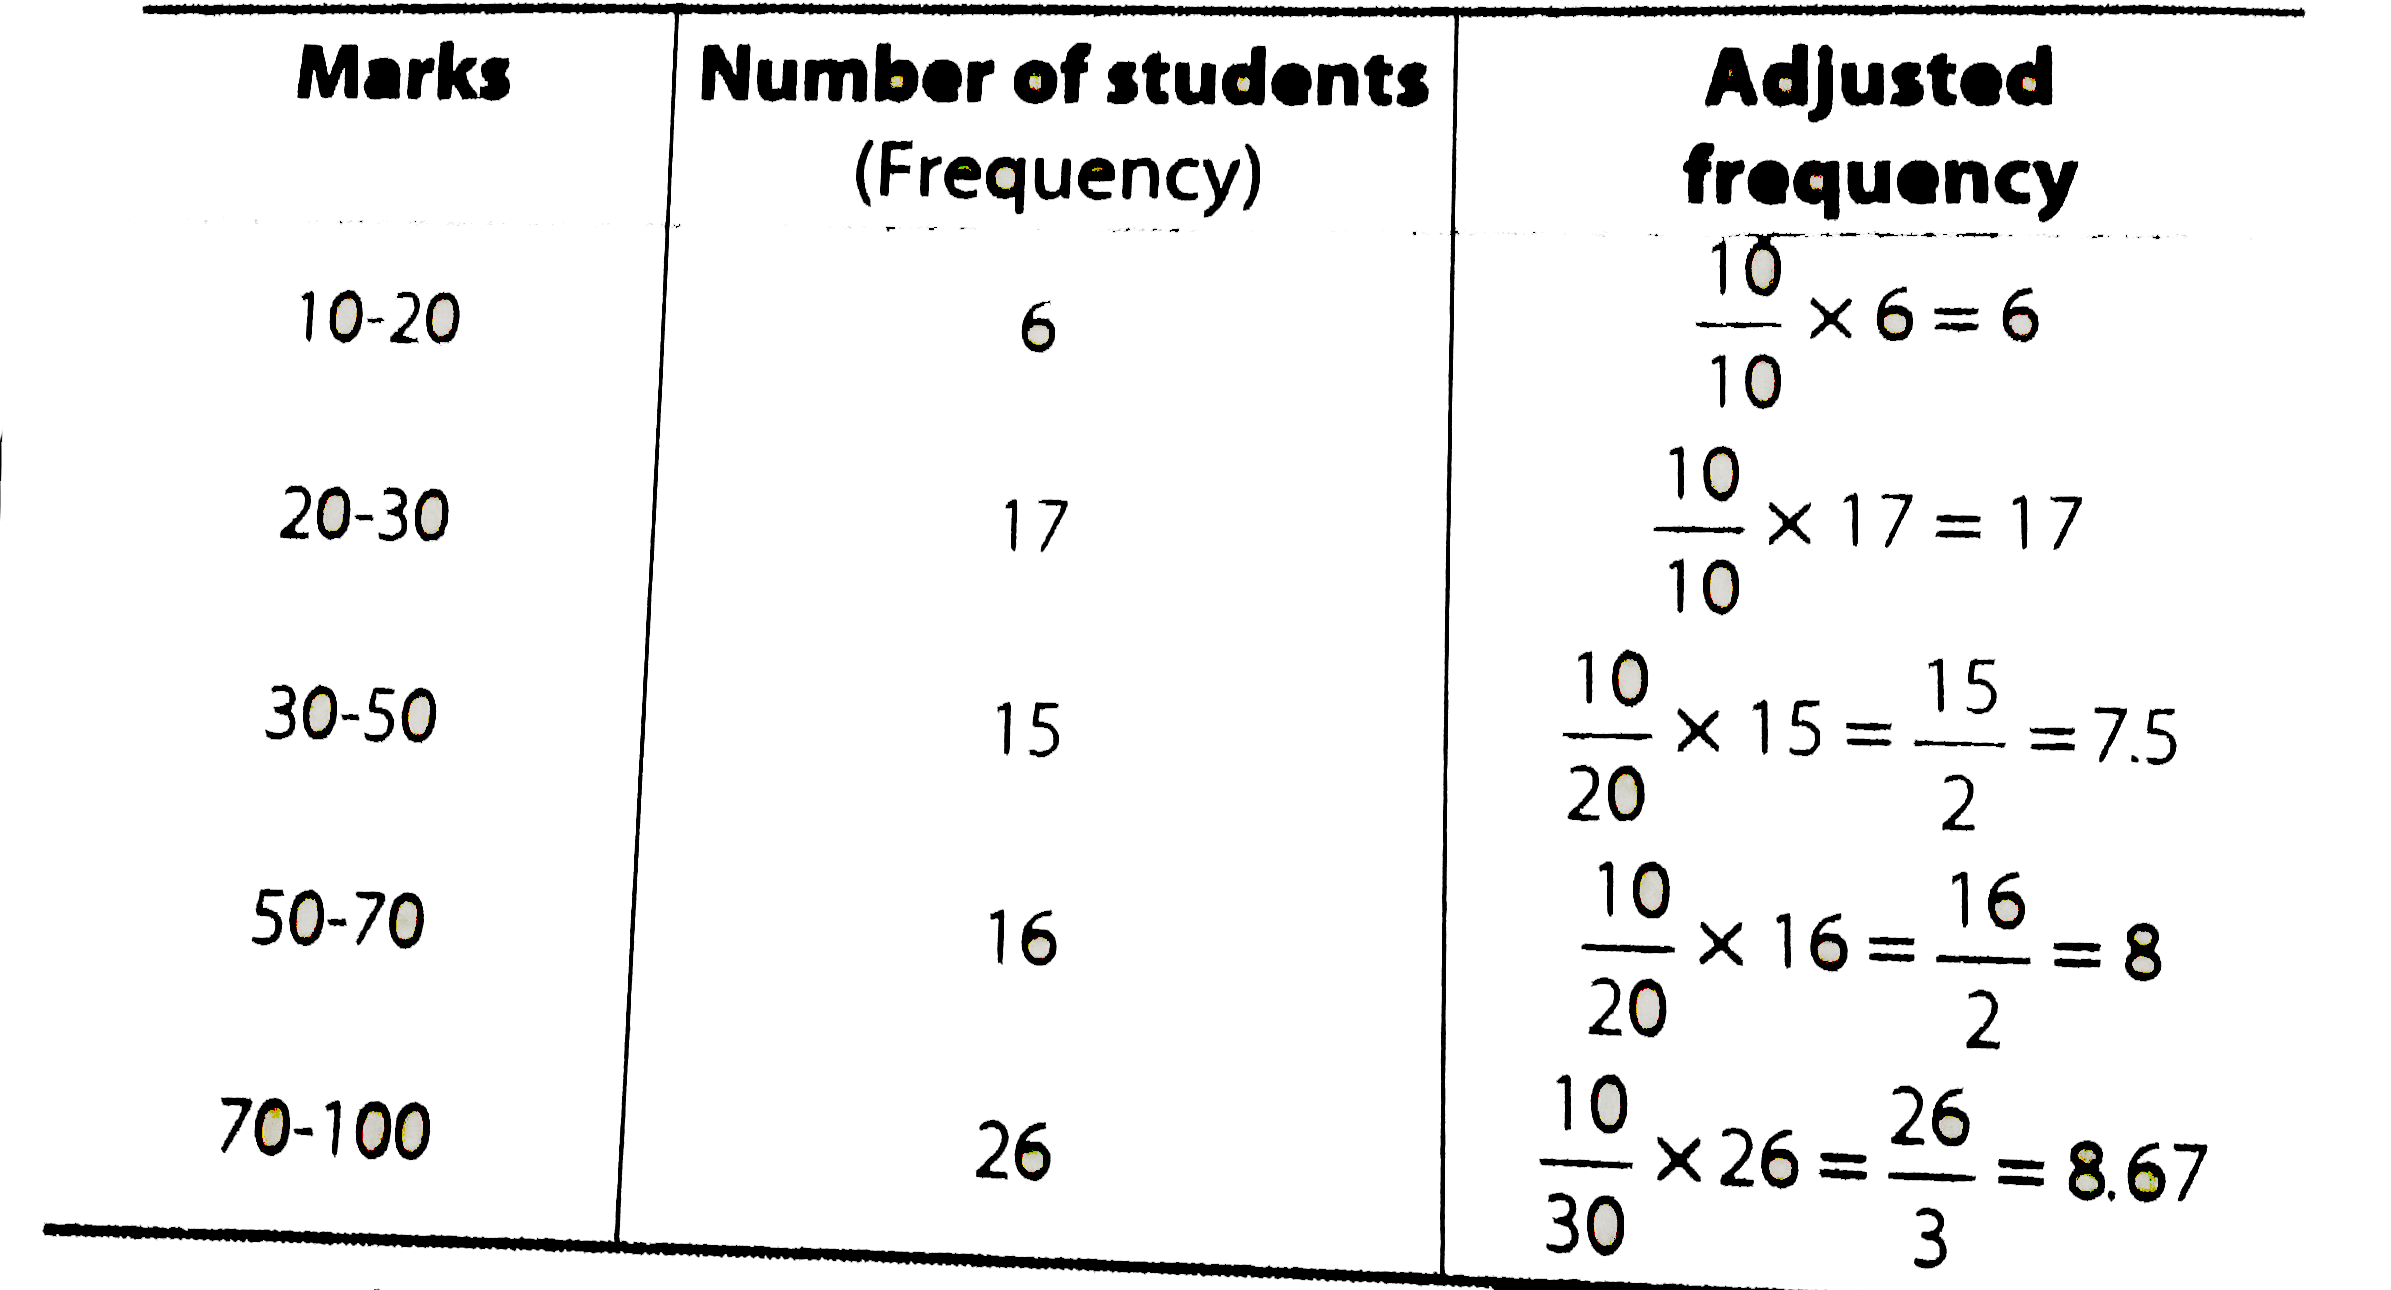
In the given frequency distribution, class sizes are different. So, we calculate the adjusted frequency for each class,
Here, minimum size=20-10=10
We use the formula,
Adjusted frequency of a class = Minimum class sizeClass size of this class×its frequency
The modified table for frequency distribution is given below.
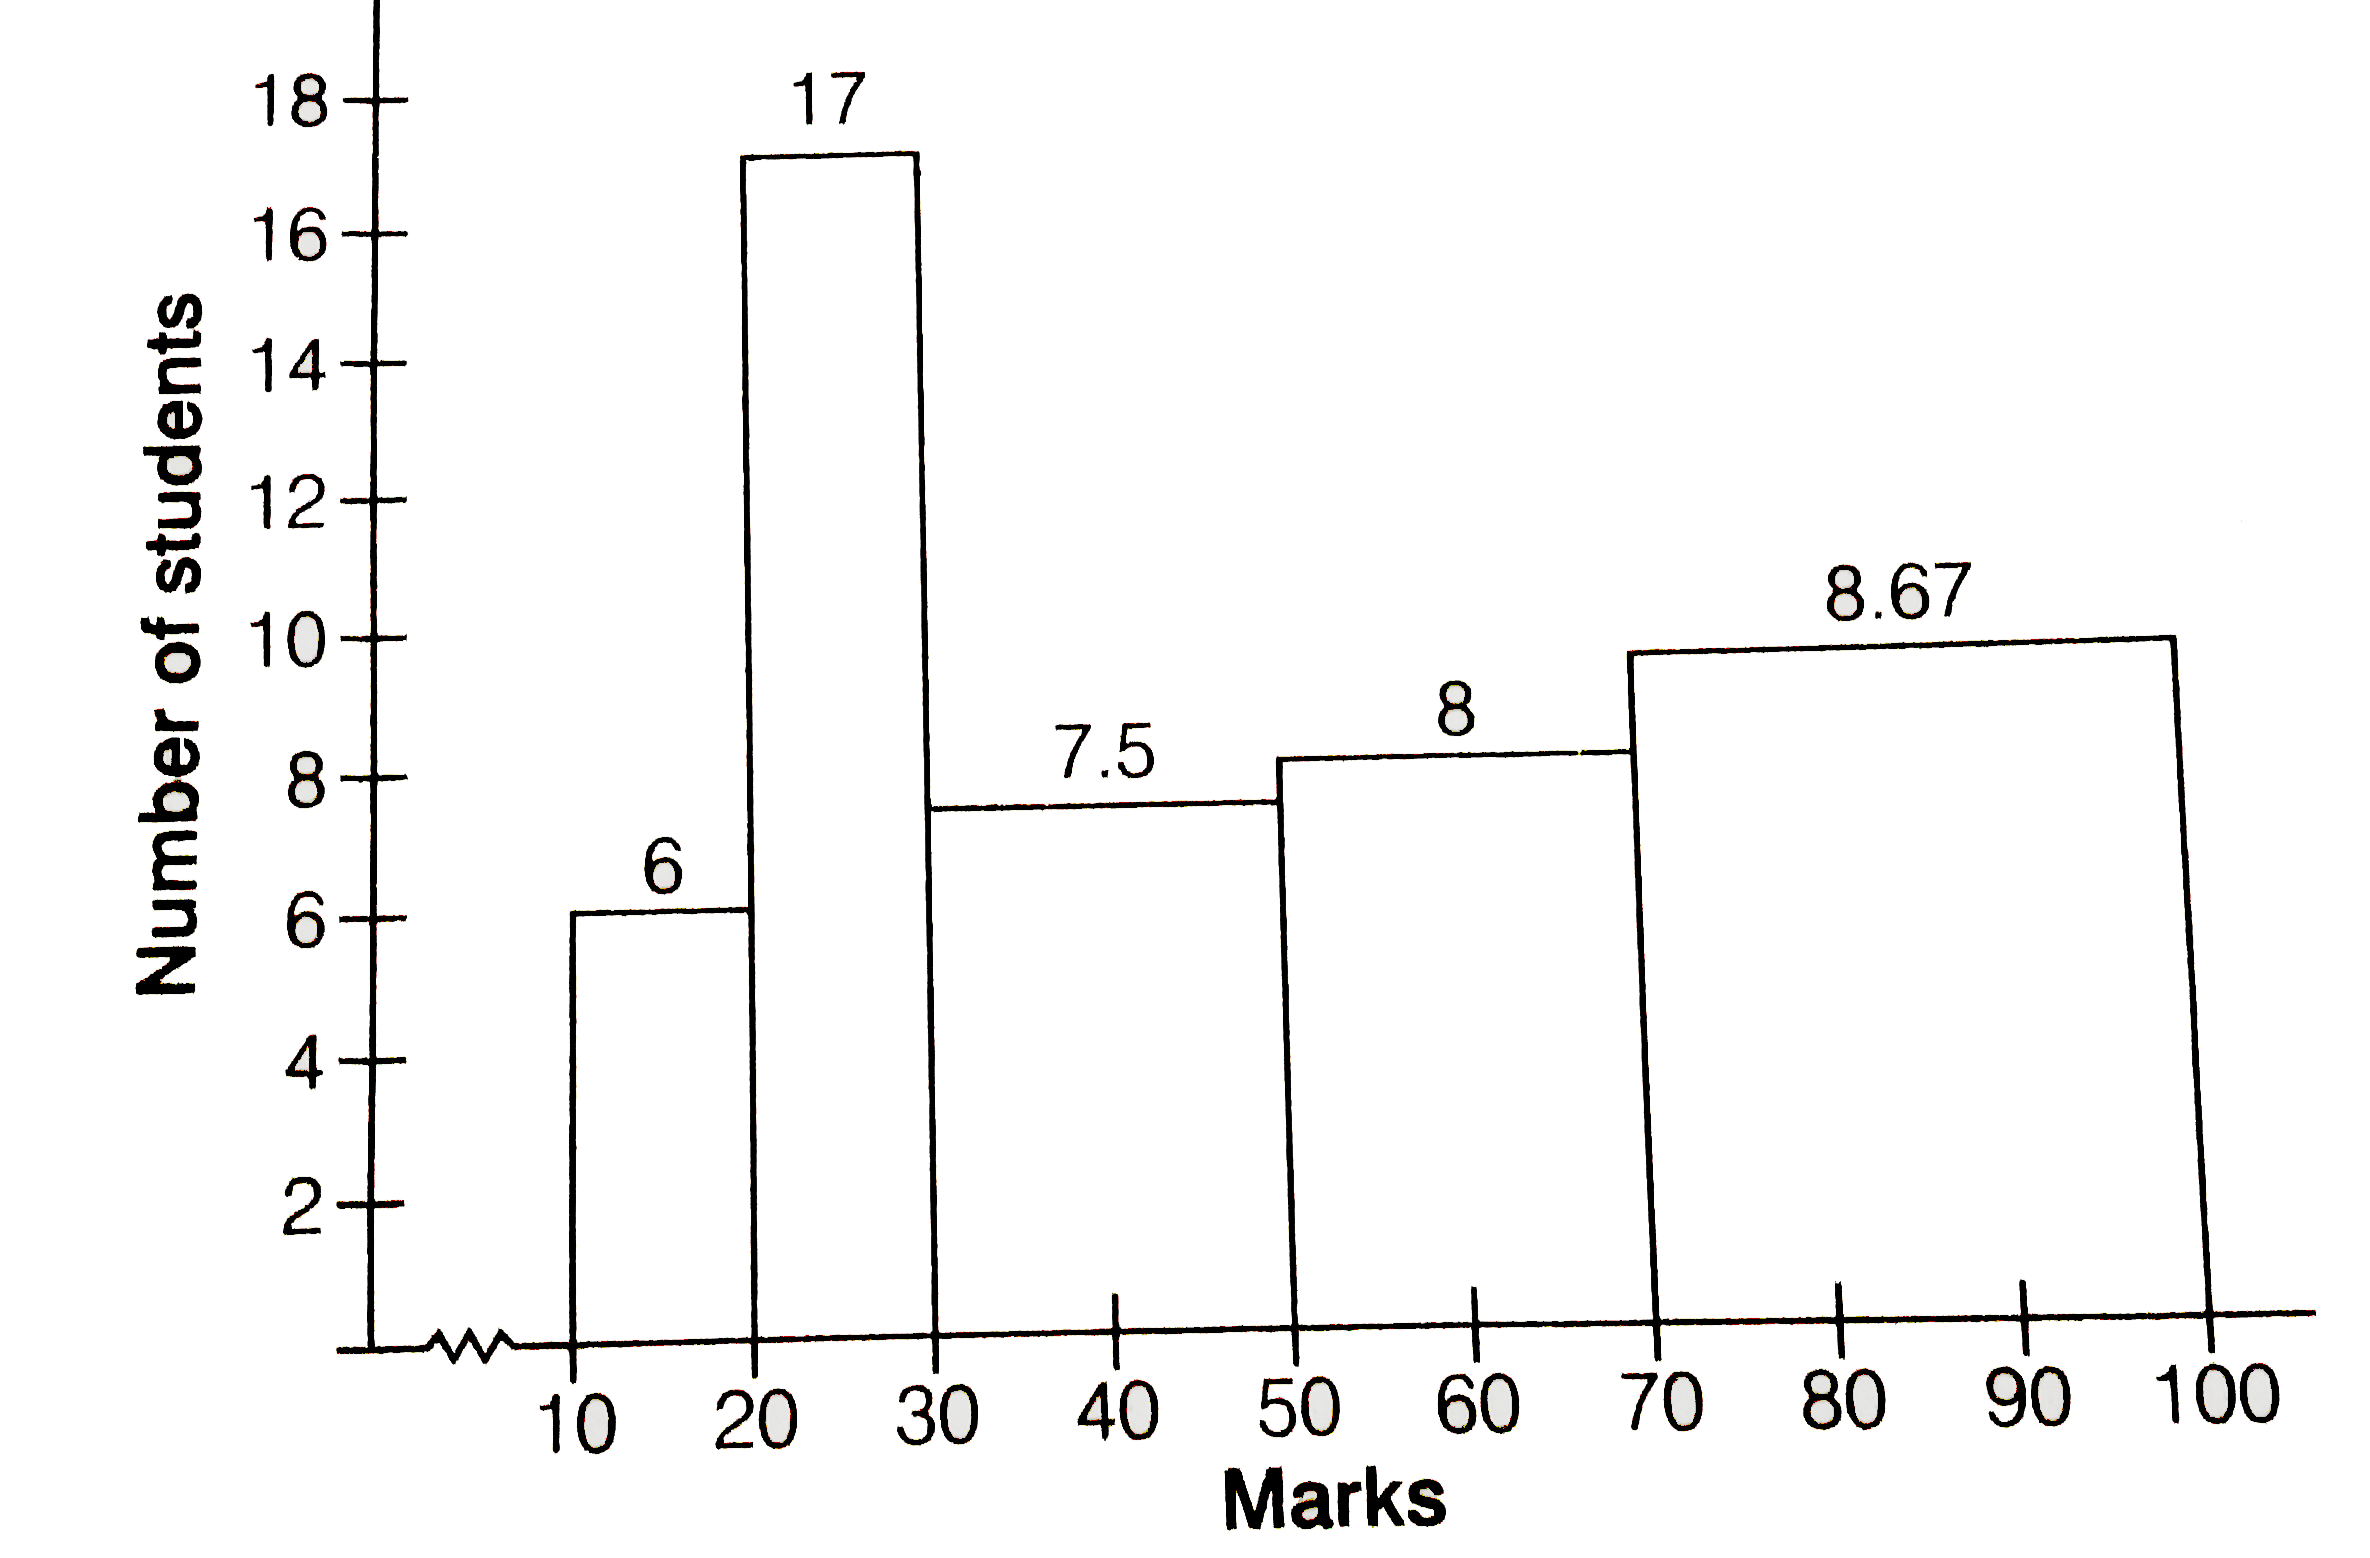
Along the horizontal axis, we represent the class intervls marks on some suitable scale. The corresponding frequencies of number of students are represented along the vertical axis on a suitable scale.
Since, the given intervals start with 10-20. It means that, there is some break indicated near the origin to slightly the graph is drawn with a scale beginning at 10.
Now, we draw rectangles with class intervals as the bases and the corresponding adjusted frequencies as heights.
A histogram of the given distribution is given below.
Related Playlists
Similar Questions
The marks obtained (out of 100) by 400 students in an examination are given below:
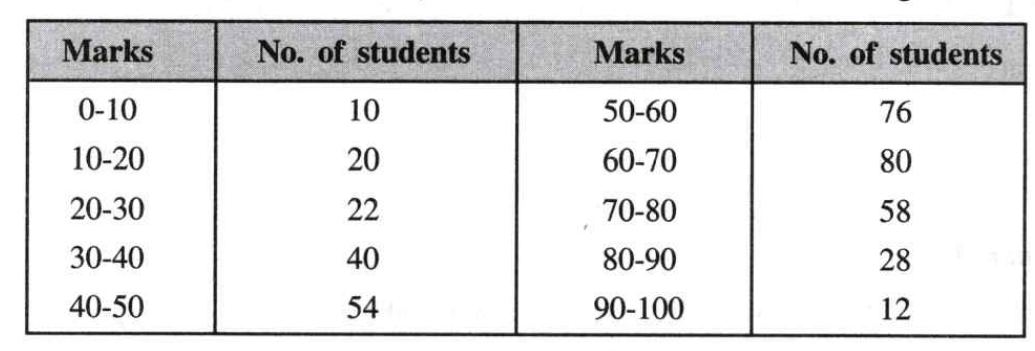
Using a graph paper, draw an ogive for the above distribution. Use ogive to estimate the following: estimate the number of students who obtained more than 80% marks in the examination.View SolutionThe marks obtained by 100 students of class is an examination are given below:
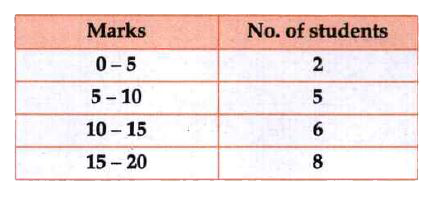
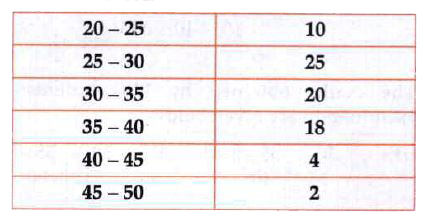
Draw 'a less than' type cumulative frequency curves (ogive). Hence, find median.View SolutionThe marks obtained by a student in examinations are given below :
80, 72, 84, 79, 90
find the average marks of the studentView SolutionThe marks obtained by 32 students of a class are given below. Prepare a frequency table with class intervals 31−40,41−50,….. etc.
 View Solution
The marks obtained by 32 students of a class are given below. Prepare a frequency table with class intervals 31−40,41−50,….. etc.
 View Solution
Marks obtained by 90 students of class IX in a test are given below:

Out of these students, one is chosen at random. Find the probability that the chosen student obtains more than 80% marksView SolutionMarks obtained by 90 students of class IX in a test are given below:

Out of these students, one is chosen at random. Find the probability that the chosen student obtains
less than 20% marksView SolutionThe marks obtained by a student in an examination are given below: The total marks out of 100 obtained in various subjects are as follows:
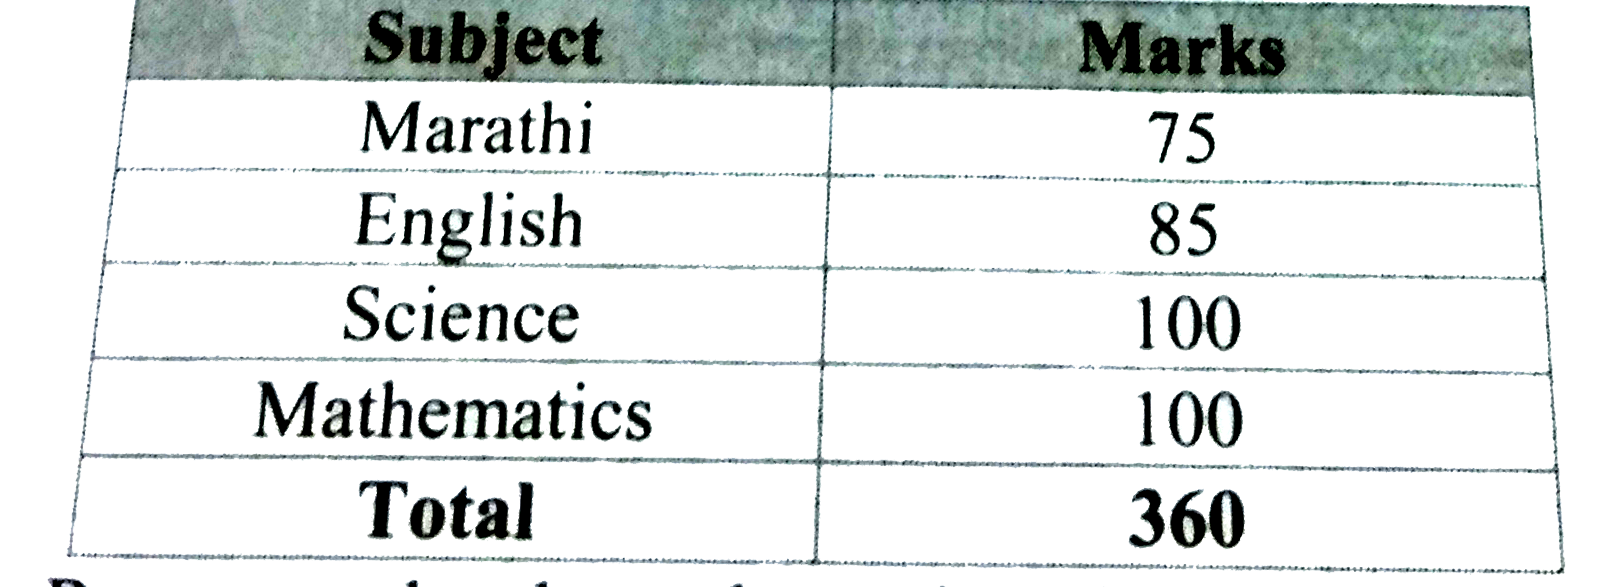
Represent the data using pie diagram.View SolutionMarks obtained by 90 students of class IX in a test are given below:

Out of these students, one is chosen at random. Find the probability that the chosen student obtains more than 60 %marksView SolutionThe average marks obtained in a class of 50 students is 70%. The average of first 25 in 60% and average of next 24 students is 80%. What is the marks obtained by the last student?
View Solution

