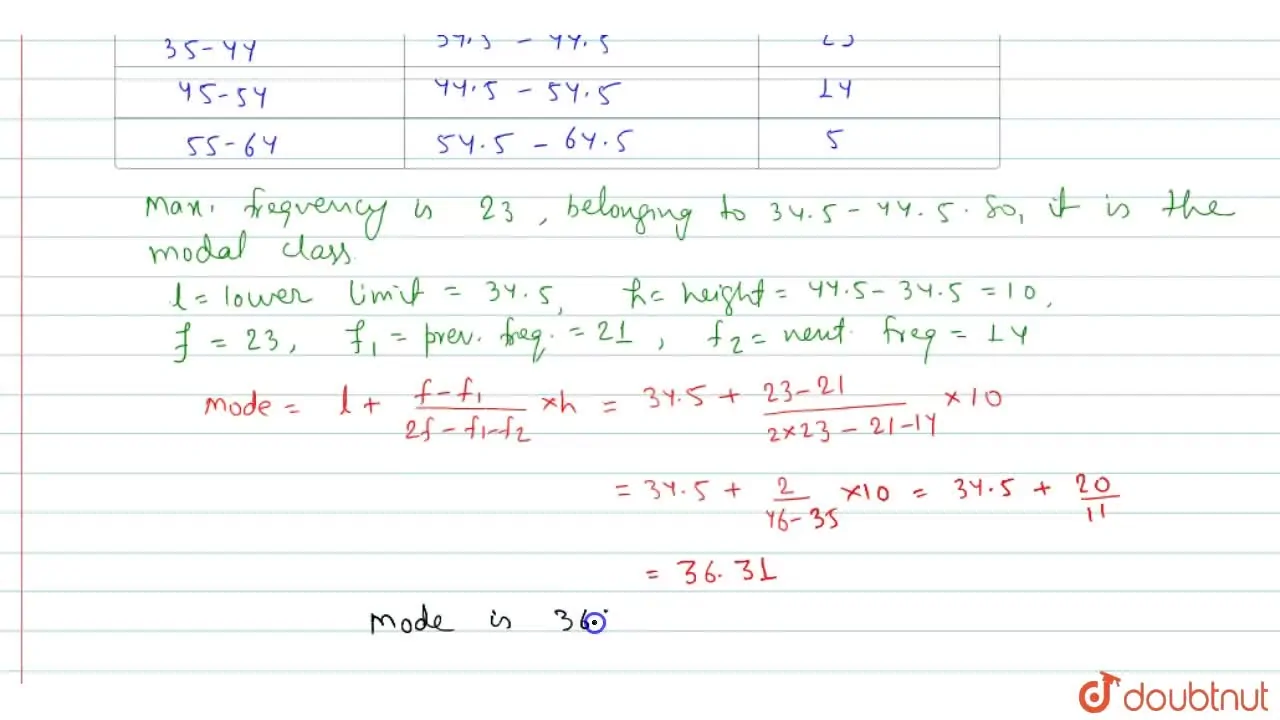
The following table shows the age distribution of cases of a certain disease admitted during a year in a particular hospital. Age (in years): 5-14 15-24 25-34 35-44 45-54 55-64 No. of cases: 6 11 21 23 14 5. Find the average age for which maximum cases occurred.
Step by step video & image solution for The following table shows the age distribution of cases of a certain disease admitted during a year in a particular hospital. Age (in years): 5-14 15-24 25-34 35-44 45-54 55-64 No. of cases: 6 11 21 23 14 5. Find the average age for which maximum cases occurred. by Maths experts to help you in doubts & scoring excellent marks in Class 10 exams.
Related Playlists
Similar Questions
The following table shows the ages of the patients admitted in a hospital during a year: Age (in years): 5-15 15-25 25-35 35-45 45-55 55-65 No. of students: 6 11 21 23 14 5 Find the mode and the mean of the data given above. Compare and interpret the two measures of central tendency.
View SolutionThe following table shows the ages of the patients admitted in a hospital during a year:Find the mode and the mean of the data given above. Compare and interpret the two measures of central tendency.
View SolutionThe following table gives the frequency distribution of married women by age at marriage: Age (in years) Frequency Age (in years) Frequency 15-19 53 40-44 9 20-24 140 45-49 5 25-29 98 50-54 3 30-34 32 55-59 3 35-39 12 60 and above 2 Calculate the median and interpret the results
View SolutionThe age distribution of 100 life-insurance policy holders is as follows: Age (on nearest birthday), 17-19.5, 20-25.5, 26-35.5, 36-40.5, 41-50.5, 51-55.5, 56-60.5, 61-70.5 No. of persons, 5, 16, 12, 26, 14, 12, 6, 5
View SolutionCalculate the mean deviation about median age for the age distribution of 100 persons given below: Age 16-20 21-25 26-30 31-35 36-40 41-45 46-50 51-55 Number 5 6 12 14 26 12 16 9
View SolutionCalculate the mean deviation about median age for the age distribution of 100 persons given below: Age 16-20 21-25 26-30 31-35 36-40 41-45 46-50 51-55 Number 5 6 12 14 26 12 16 9
View SolutionThe age distribution of 100 life-insurance policy holders is as follows: Age (on nearest birthday) 17-19.5 20-25.5 26-35.5 36-40.5 41-50.5 51-55.5 56-60.5 61-70.5 No. of persons 5 16 12 26 14 12 6 5 Calculate the mean deviation from median age.
View SolutionA life insurance agent found the following data for distribution of ages of 100 policy holders. Calculate the median age, if policies are only given to persons having age 18 years onwards but less than 60 years. Age(inyears) Numberofpolicyholders Below20 2 Below25 6 Below 30 24 Below 35 45 Below 40 78 Below 45 89 Below 50 92 Below 55 98 Below 60 100
View SolutionThe following distribution shows the daily pocket allowance given to the children of a multistorey building. The average pocket allowance is Rs 18.00. Find out the missing frequency: Class 11-13 13-15 15-17 17-19 19-21 21-23 23-25 interval: Frequency: 7 6 9 13 - 5 4
View SolutionFind the variance and standard deviation for the following distribution: X:, 4.5, 14.5, 24.5, 34.5, 44.5, 54.5, 64.5 f: , 1, 5, 12, 22, 17, 9, 4
View Solution


