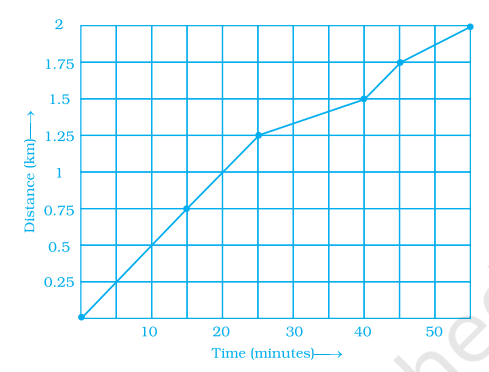
The following is the time-distance graph of Sneha’s walking.

(a) When does Sneha make the least progress? Explain your reasoning.
(b) Find her average speed in km/hour.
Step by step video & image solution for The following is the time-distance graph of Sneha’s walking. (a) When does Sneha make the least progress? Explain your reasoning. (b) Find her average speed in km/hour. by Maths experts to help you in doubts & scoring excellent marks in Class 8 exams.
Related Playlists
- BOOK - NCERT EXEMPLARCHAPTER - INTRODUCTION TO GRAPHS EXERCISE - THINK AND DISCUSS4videos
INTRODUCTION TO GRAPHS
- BOOK - NCERT EXEMPLARCHAPTER - EXPONENTS AND POWERSEXERCISE - EXERCISE195videos
EXPONENTS AND POWERS
- BOOK - NCERT EXEMPLARCHAPTER - LINEAR EQUATIONS IN ONE VARIABLEEXERCISE - THINK AND DISCUSS3videos
LINEAR EQUATIONS IN ONE VARIABLE
Similar Practice Problems
- Question 1 - Select One
An automobile driver travels from a plain to a hil station 120 km away at an average speed of 30 km per hour. He then makes the return trip at an average speed 25 km per hour. He covers another 120 km on the plain at an average speed of 50 km per hour. His average speed (in km/hr) over the entire distance of 360 km will be
A30+25+503Ba30+125+1503C3130+125+150DNone of these - Question 1 - Select One or More
Distance between A and B is 72km. Two men started walking from A and B at the same time towards each other. The person who started from A travelled uniformly with average speed 4 km/h.While the other man travelled with varying speed as follows In first hour,his speed was 2 km/h,in the second hour,it was 2.5km/h,in the third hour,it was 3km/h, and soon. When will they meet each other?
A7HB10hC35 km from ADmidway betweeen A and 8
Similar Questions
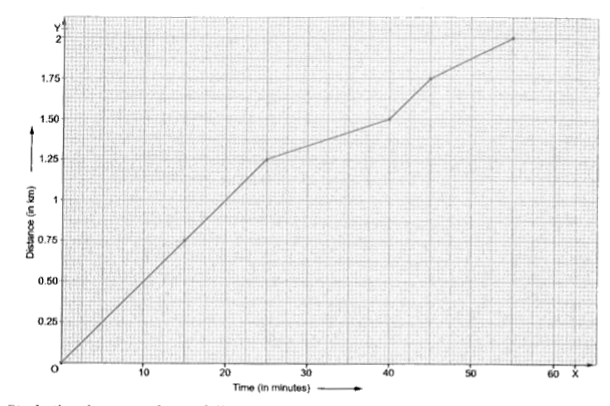
The following is the distance -time graph of Amit's walking.

Study the above graph carefully and answer the questions given below :
(i) When does Amit make the least progress ? Explain your answer.
(ii) Find his average speed in km/hr.View SolutionA person covers half of the total distance at the speed of 40 km per hour, half of the remaining at 20 km per hour and the rest at 10 km per hour. Find the average speed during the journey.
View SolutionMohan can ride a motorcycle constantly at a speed of 30 kms/hour. Draw a time-distance graph for this situation. Use it to find
(a) The time taken by Mohan to ride 75 km.
(b) The distance covered by Mohan in 4 hours.View SolutionDeepa rides her bike at an average speed of 30 km/hr and reaches her destination in6 hours. Hema covers the same distance in 4 hours. If Deepa increases her average speed by 10 km/hr and Hema increases her average speed by 5 km/hr what would be the difference in their time taken to reach the destination? 40 m∈utes b. 45 m∈utes c. 4 m∈utes d. 1 hour e. none of these
View SolutionSolve the following problems :
(iii) The distance between Akola and Bhusaval is 168 km. An express train 1 hour less than a passenger train to cover that distance. Find the average speed of each train, if the average speed of the express train is more by 14 km/h than the speed of the passenger train.View SolutionBy using distance-time graph we can find out the average speed of an object.
View SolutionBy using distance-time graph we can find out the average speed of an object.
View SolutionKishore walking with a uniform speed covers 20 km in 5 h. find the distance he covers in 7 hours.
View Solution

