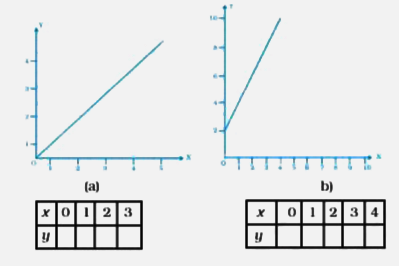
Study the given graphs (a) and (b) and complete the corresponding tables below.
Video Solution
|
Answer
Step by step video & image solution for Study the given graphs (a) and (b) and complete the corresponding tables below. by Maths experts to help you in doubts & scoring excellent marks in Class 8 exams.
Updated on:21/07/2023
Related Playlists
- BOOK - NCERT EXEMPLARCHAPTER - INTRODUCTION TO GRAPHS EXERCISE - THINK AND DISCUSS4videos
INTRODUCTION TO GRAPHS
- BOOK - NCERT EXEMPLARCHAPTER - EXPONENTS AND POWERSEXERCISE - EXERCISE195videos
EXPONENTS AND POWERS
- BOOK - NCERT EXEMPLARCHAPTER - LINEAR EQUATIONS IN ONE VARIABLEEXERCISE - THINK AND DISCUSS3videos
LINEAR EQUATIONS IN ONE VARIABLE
Similar Practice Problems
- Question 1 - Select One
Study the following graph carefully and answer the questions given below it -----
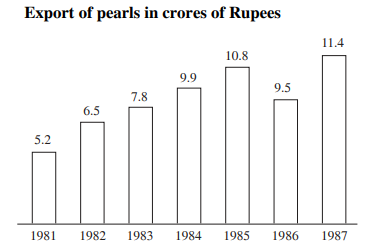
In how many years was the export above the average for the given period ?A2B3C4D5 - Question 1 - Select One
Study the following graph carefully and answer the questions given below
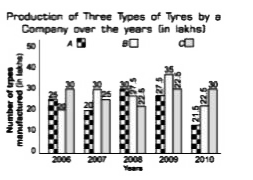
In which of the following years, was the percentage production of B type to C type the maximum?A2008B2009C2010D2007 - Question 1 - Select One
Study the following graph carefully and answer the questions given below
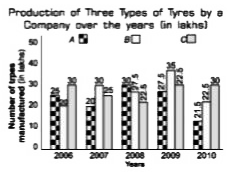
What was the difference between the number of B type tyres manufactured in 2008 and 2009?A100000B2000000C1000000Dnone to these - Question 1 - Select One
Study the following graph carefully and answer the questions given below it -----
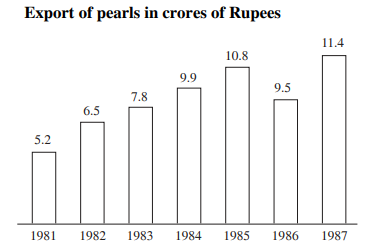
What was the percentage increase in export from 1986 to 1987 ?A1623%B20%C19%D3313%
Similar Questions
Observe the given graph carefully and complete the table given below.
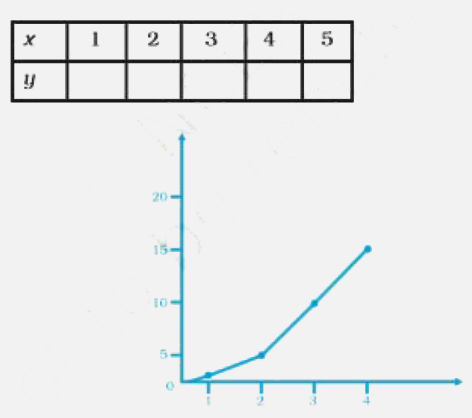 View Solution
To draw the graph of equation 2x+y=1 , complete the following table :
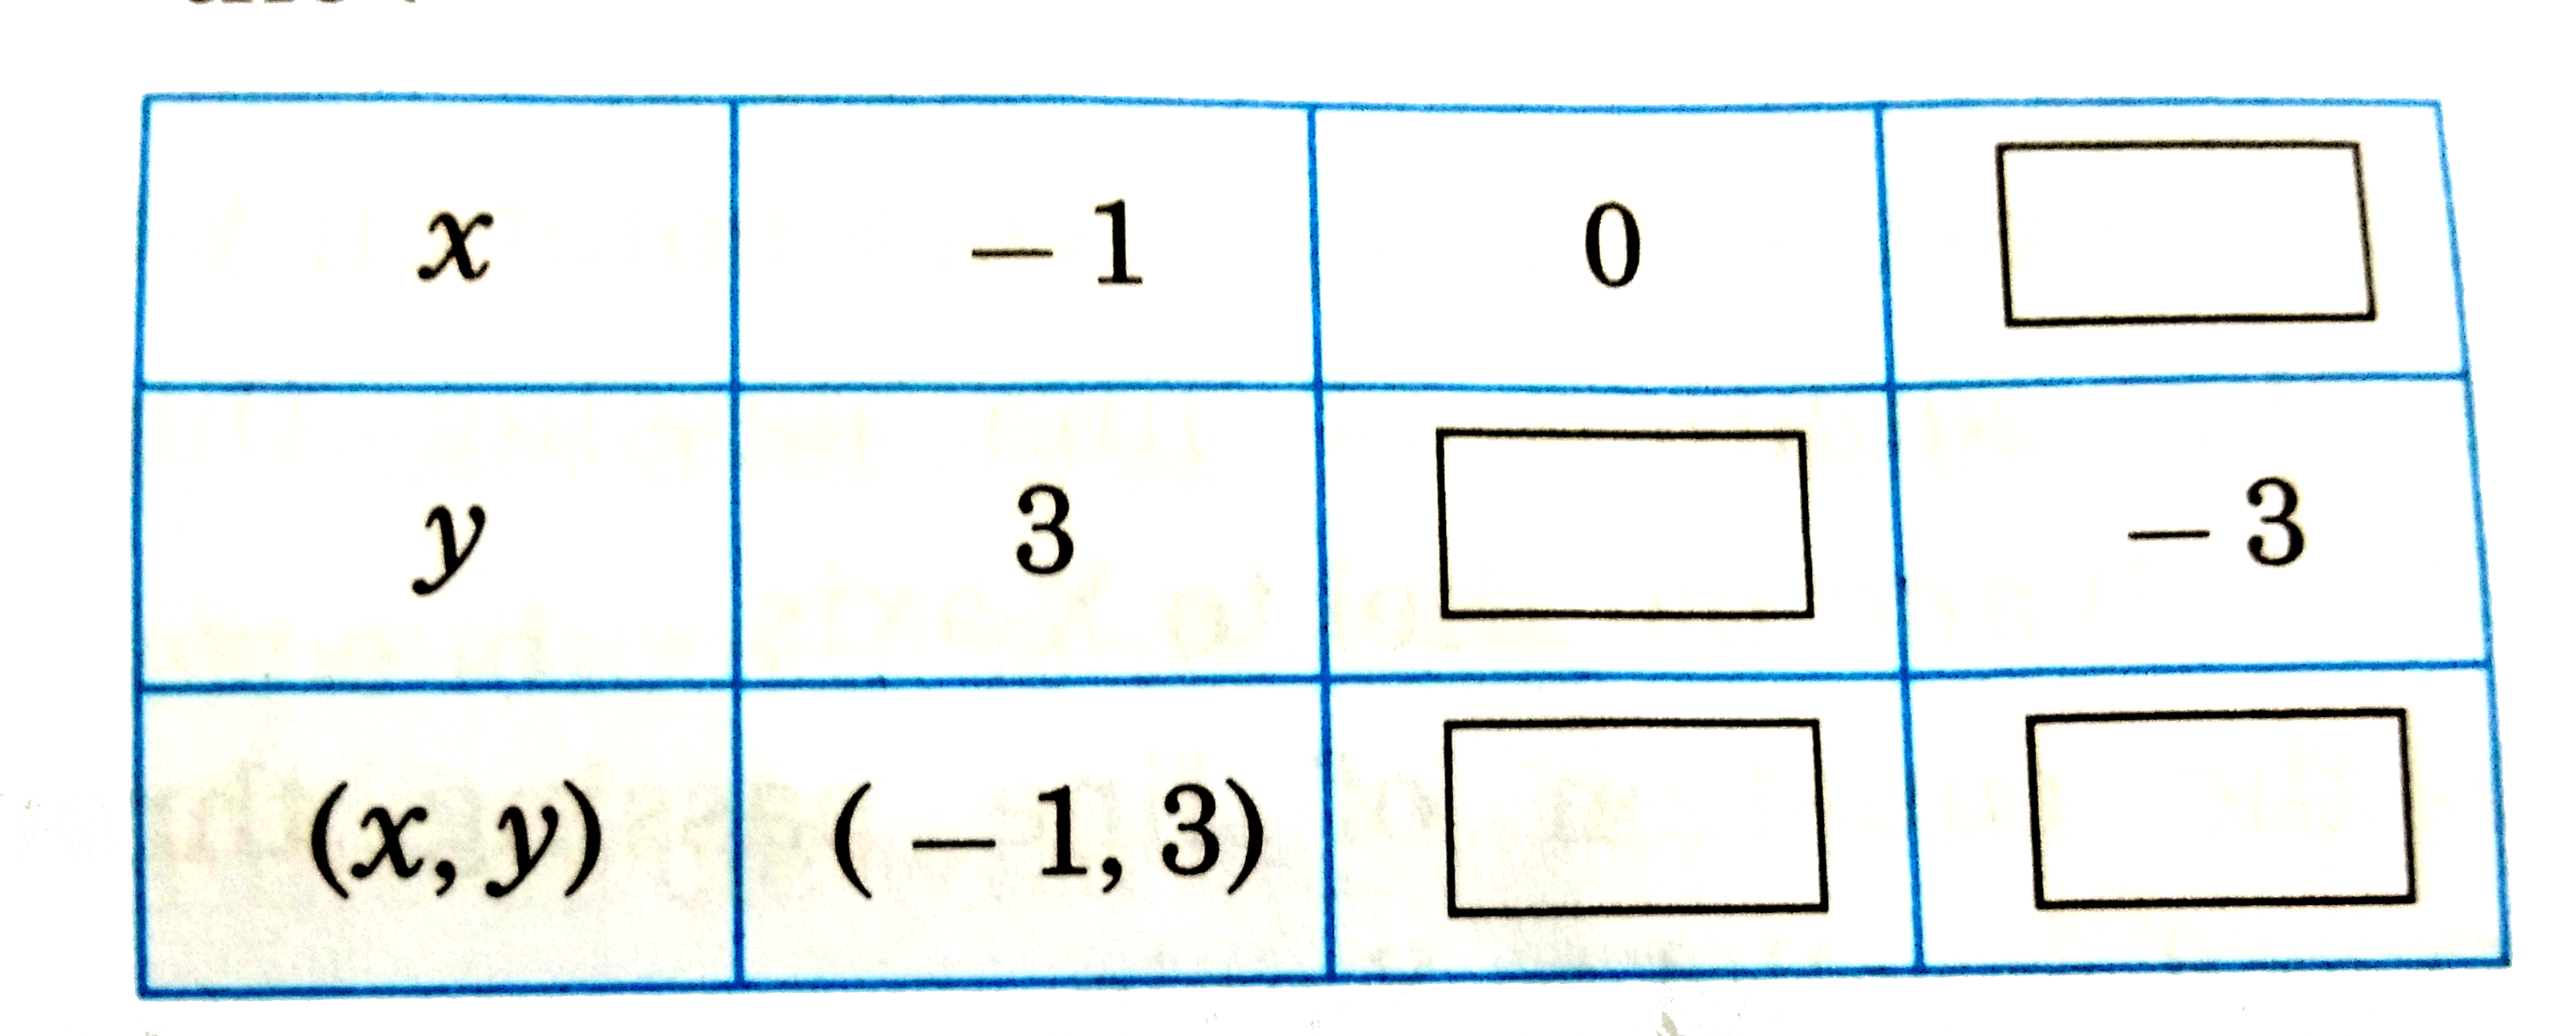 View Solution
Study the given table and select the correct option :
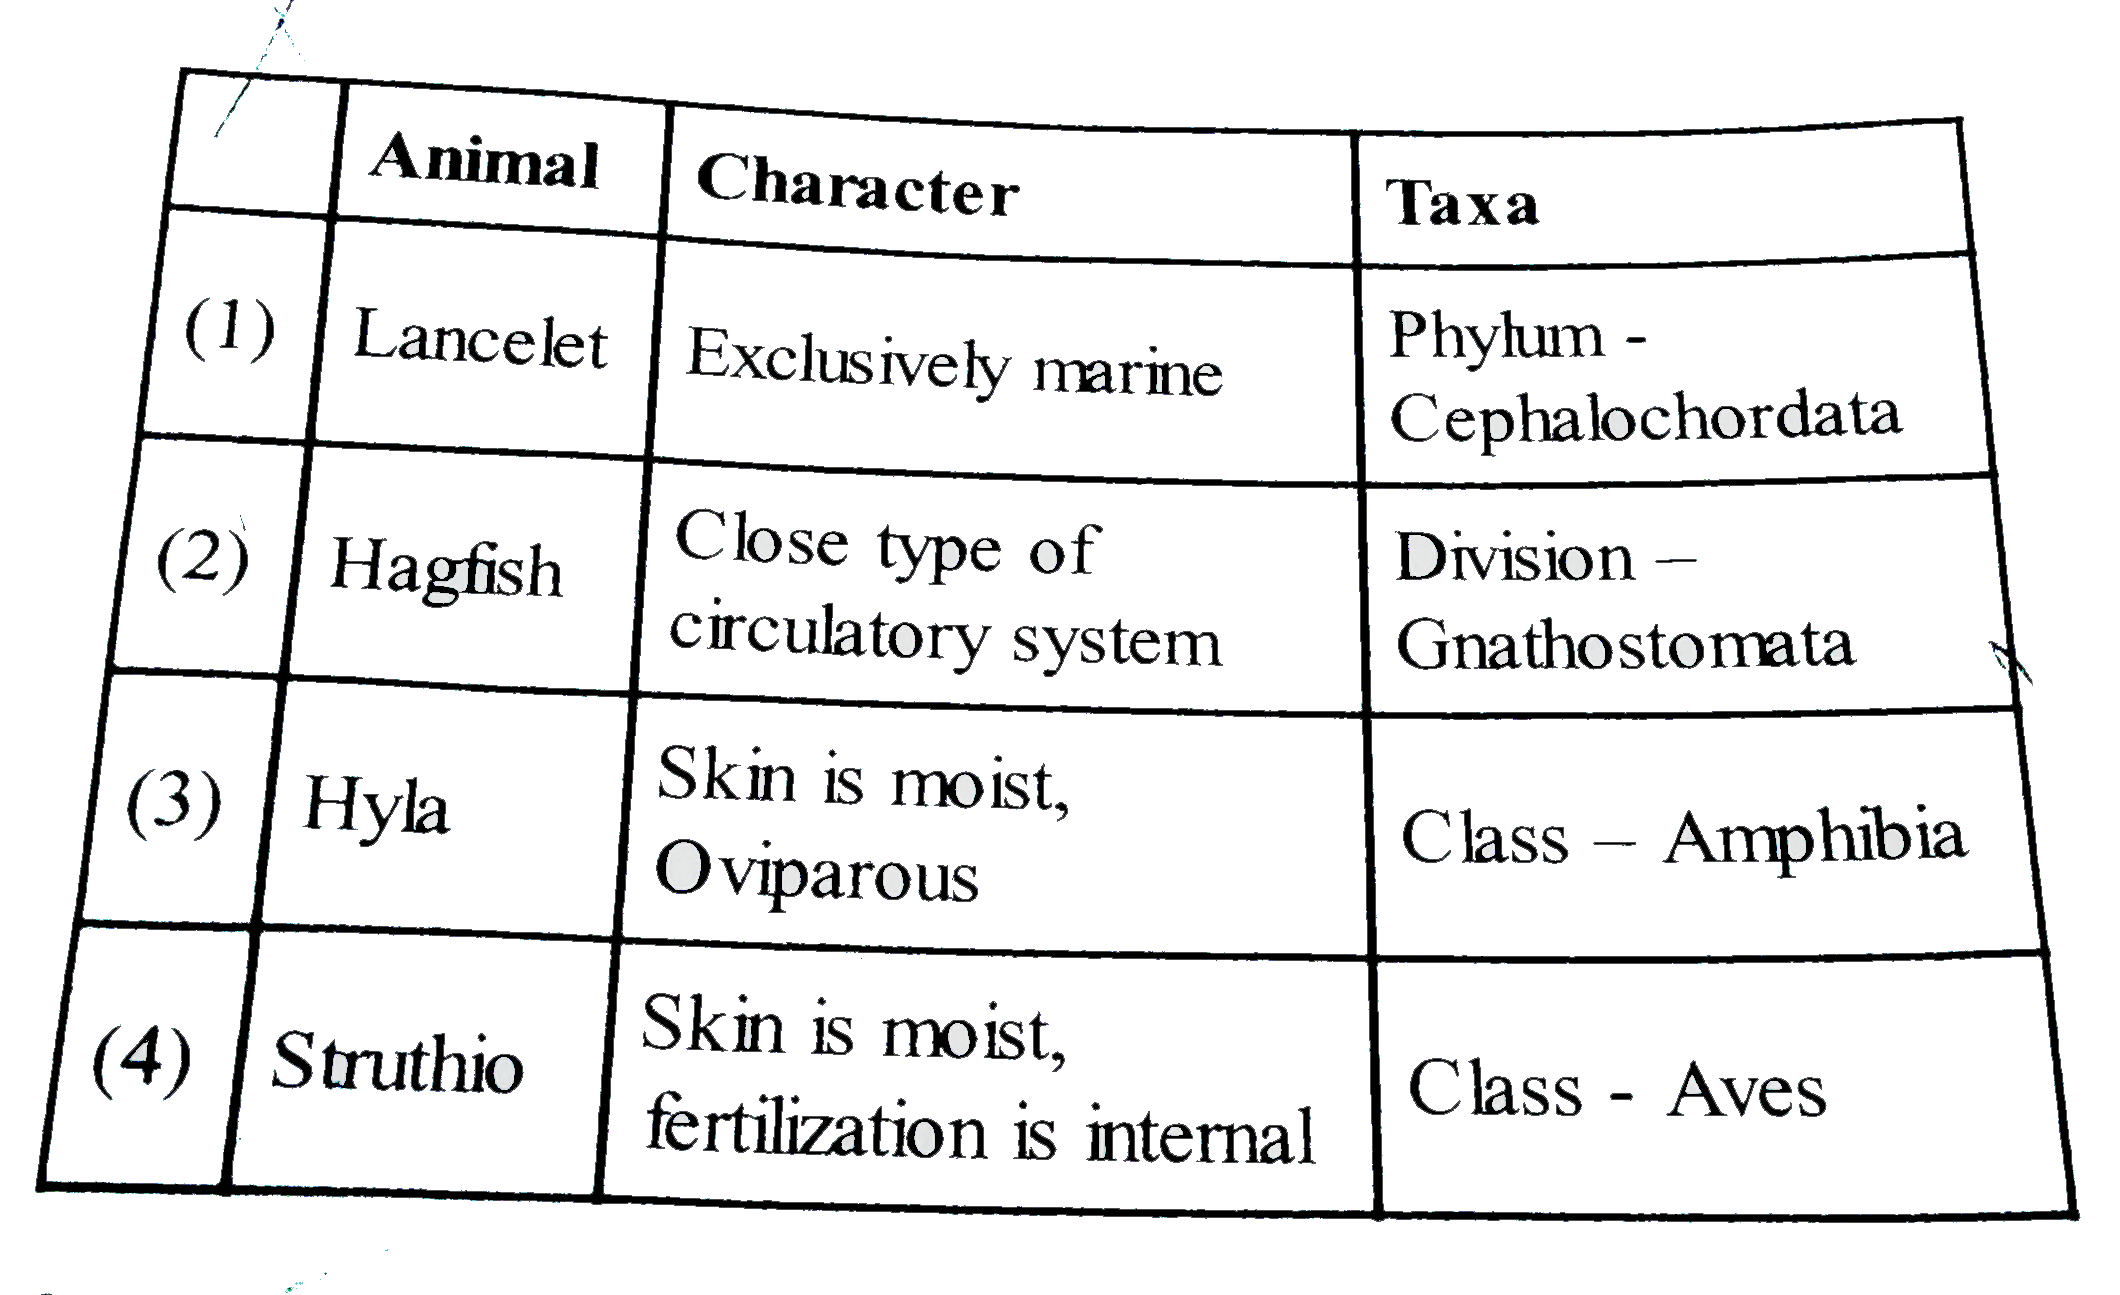 View Solution
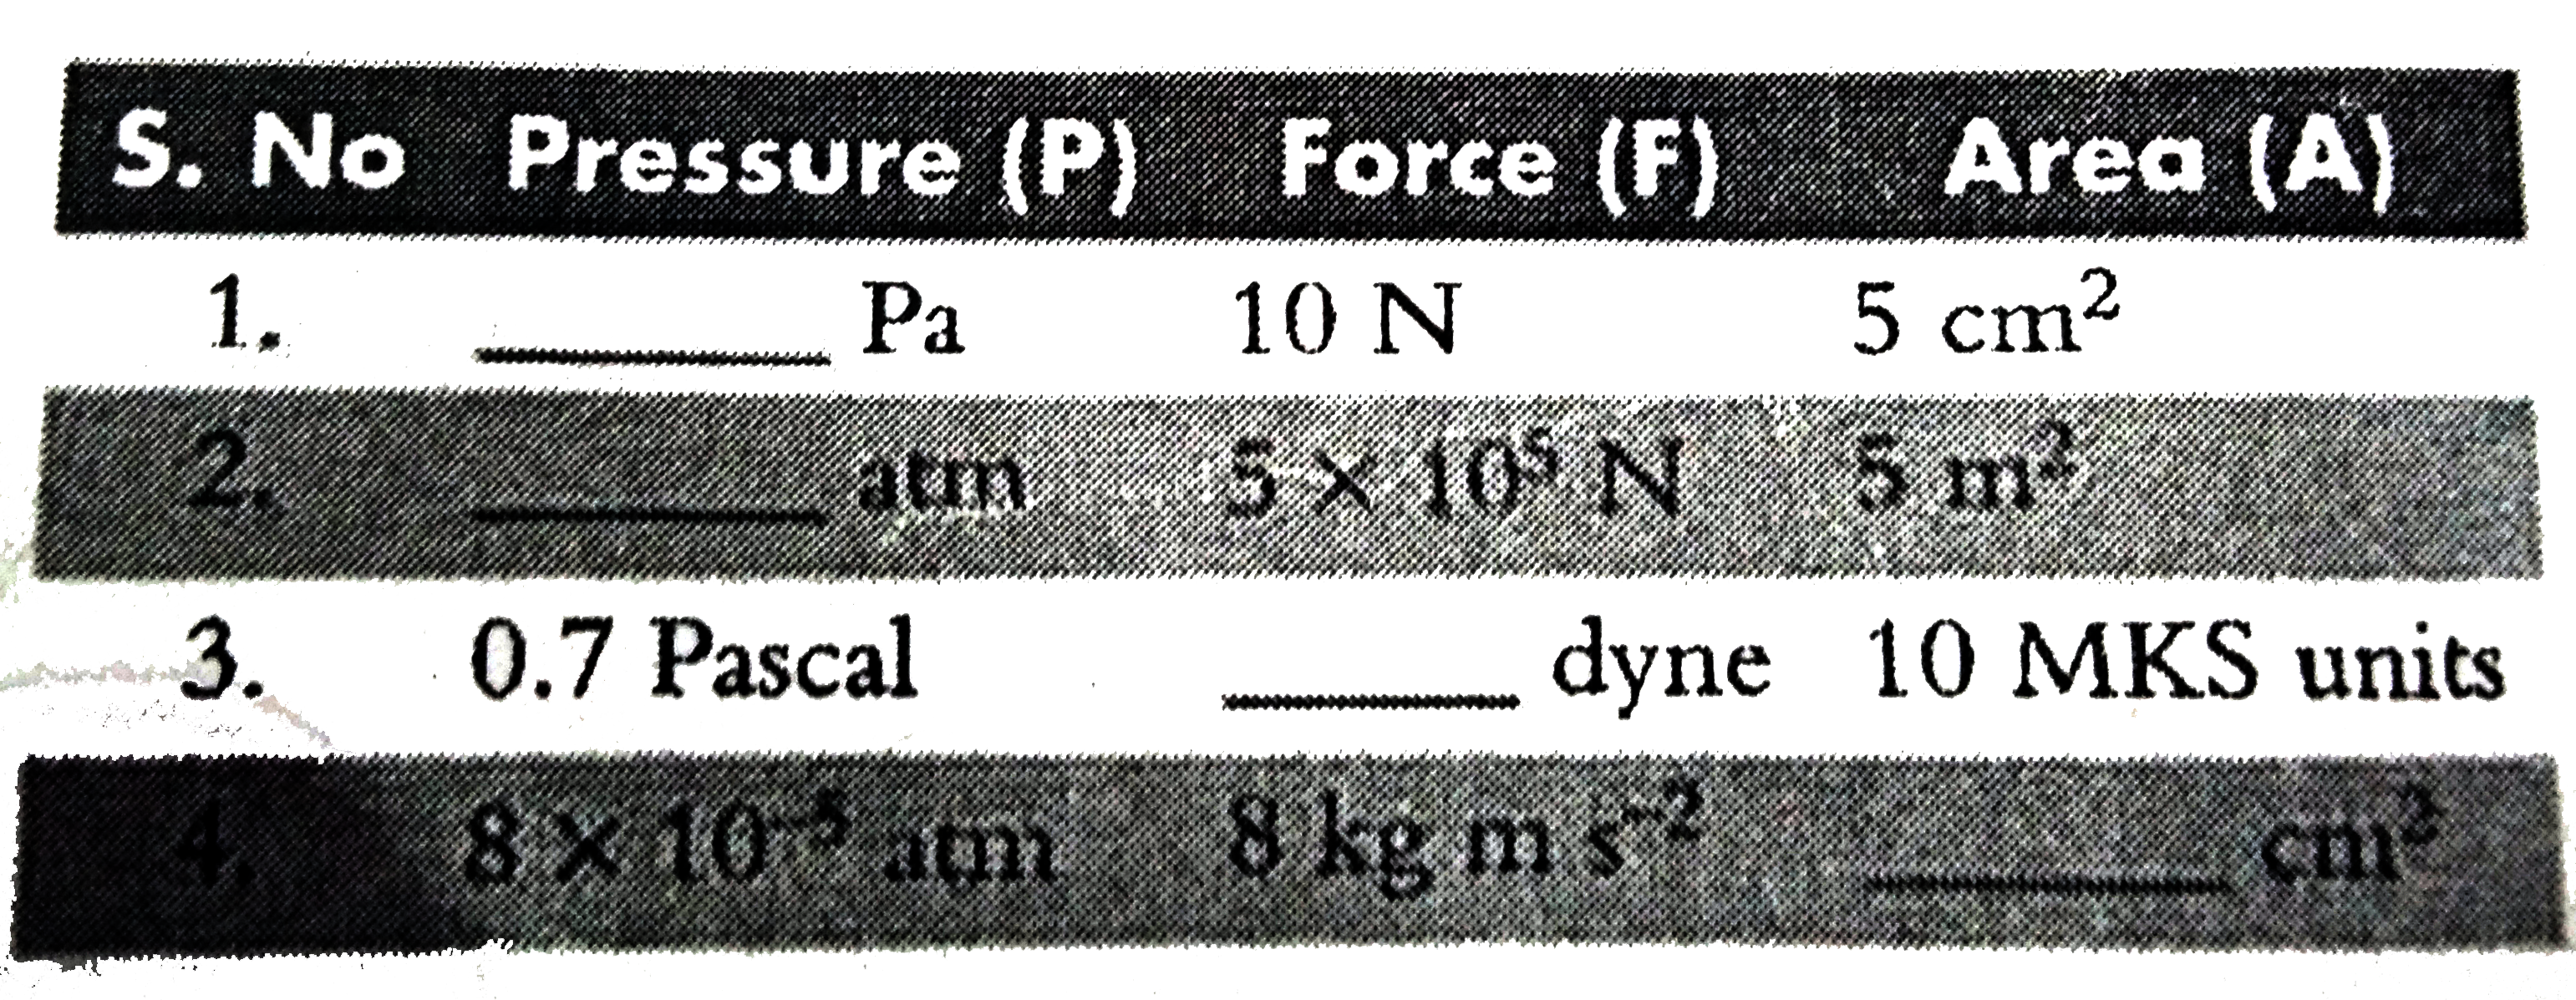
Complete the table given below.
 View Solution
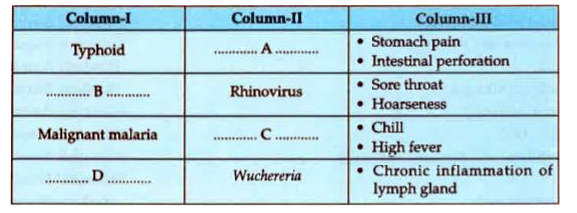
Complete the table given below:
 View Solution
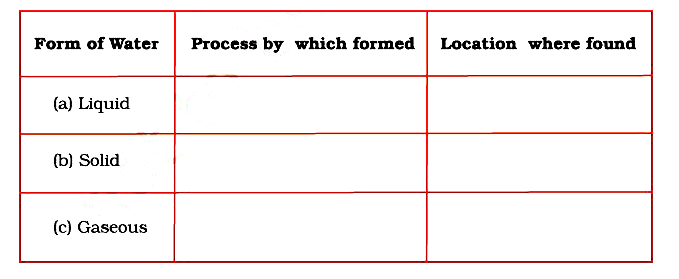
Complete the given table
 View Solution

