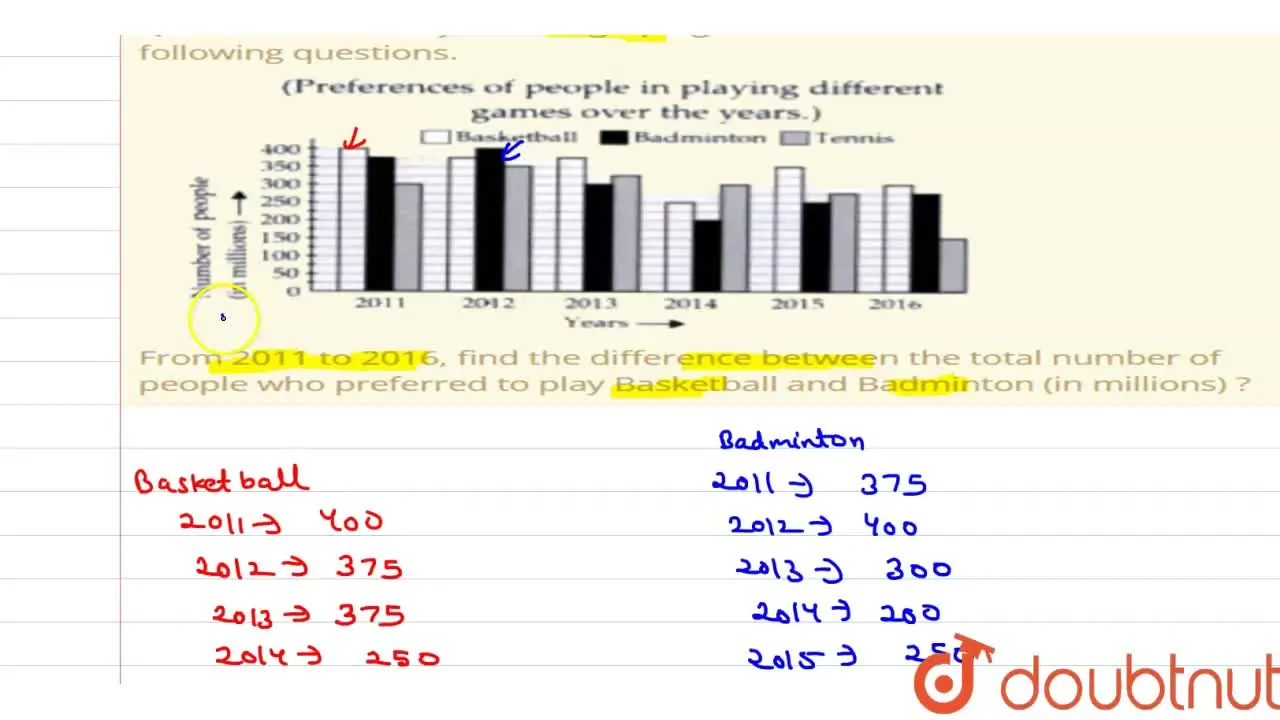
Study the bar graph given below and answer the following questions.
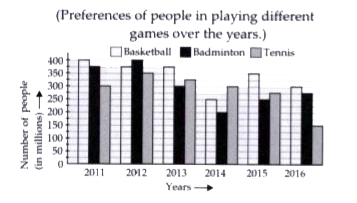
From 2011 to 2016, find the difference between the total number of people who preferred to play Basketball and Badminton (in millions) ?
525
275
730
250
The correct Answer is:D
Step by step video & image solution for Study the bar graph given below and answer the following questions. From 2011 to 2016, find the difference between the total number of people who preferred to play Basketball and Badminton (in millions) ? by Maths experts to help you in doubts & scoring excellent marks in Class 6 exams.
Related Playlists
- BOOK - MTG IIT JEE FOUNDATIONCHAPTER - DATA HANDLING EXERCISE - Exercise (Subjective Problems (Integer/Numerical Value Type )10videos
DATA HANDLING
- BOOK - MTG IIT JEE FOUNDATIONCHAPTER - BASIC GEOMETRICAL IDEASEXERCISE - OLYMPIAD/HOTS CORNER10videos
BASIC GEOMETRICAL IDEAS
- BOOK - MTG IIT JEE FOUNDATIONCHAPTER - DECIMALSEXERCISE - OLYMPIAD/HOTS CORNER20videos
DECIMALS
Similar Questions
Study the bar graph and answer the following questions.
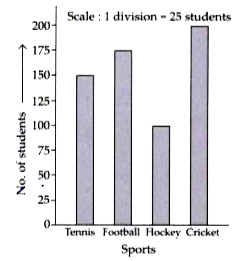
Which sport is preferred least ?View SolutionStudy the bar graph and answer the following questions.
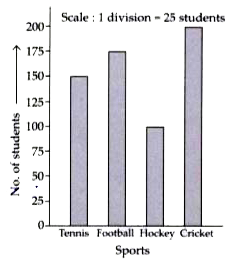
What is the difference between number of students playing football and hockey ?View SolutionRead the bar graph given below and answer the following questions.
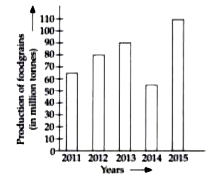
Find the difference between the production of foodgrains in million tonnes) in the year 2012 and 2015.View SolutionRead the bar graph given below and answer the following questions.
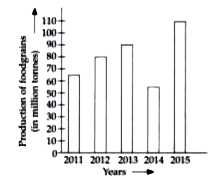
What is the ratio of the production of foodgrains in 2011 to that in 2014?View SolutionStudy the following bar graph and answer the question that follows.
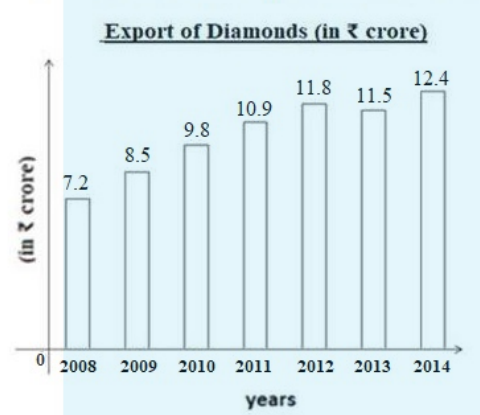
In which year was the maximin percentage increase in diamonds exports compared to the previous year?View SolutionStudy the given graph carefully and answer the following questions.
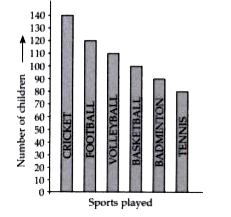
The difference between the number of children who pay tennis and cricket together & basketball and volleyball together isView SolutionStudy the bar graph given below and answer the following questions.
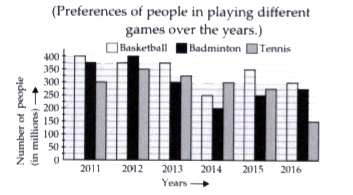
How many people (in millions) have preferred to play Tennis in all years altogether ?View SolutionDirection :- Study of bar graph and answer the questions.

From 2001 to 2006, the total number of people who preferred to play Football I was that (in millions)?
(A) 1525 (B) 1620 (C) 1730 (D) 1800View SolutionBar graph given below shows pens sold by a retailor on five different days. Study the data carefully and answer the following questions.
Pen sold on different days
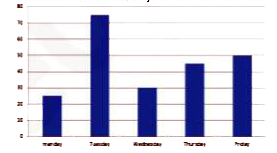
Find the difference between total number of pens sold on Monday and Tuesday together to total number of pens sold on Thursday and Friday together?View SolutionStudy the bar diagram and answer the questions.
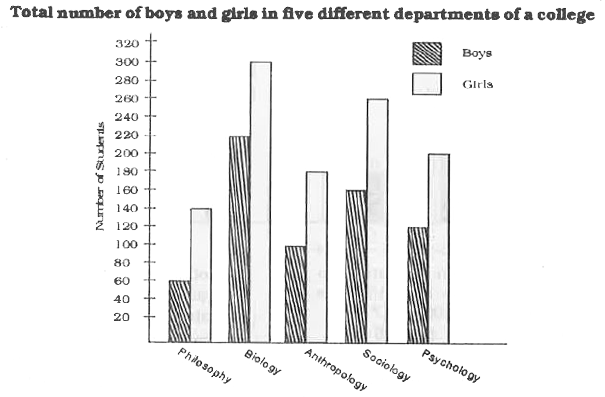
The difference between the total number of bys and the total number of girls from all the Departments together isView Solution

