Solve the following system of linear inequalities graphically.
x+y≥5 ... (1)
x−y≤3 ... (2)
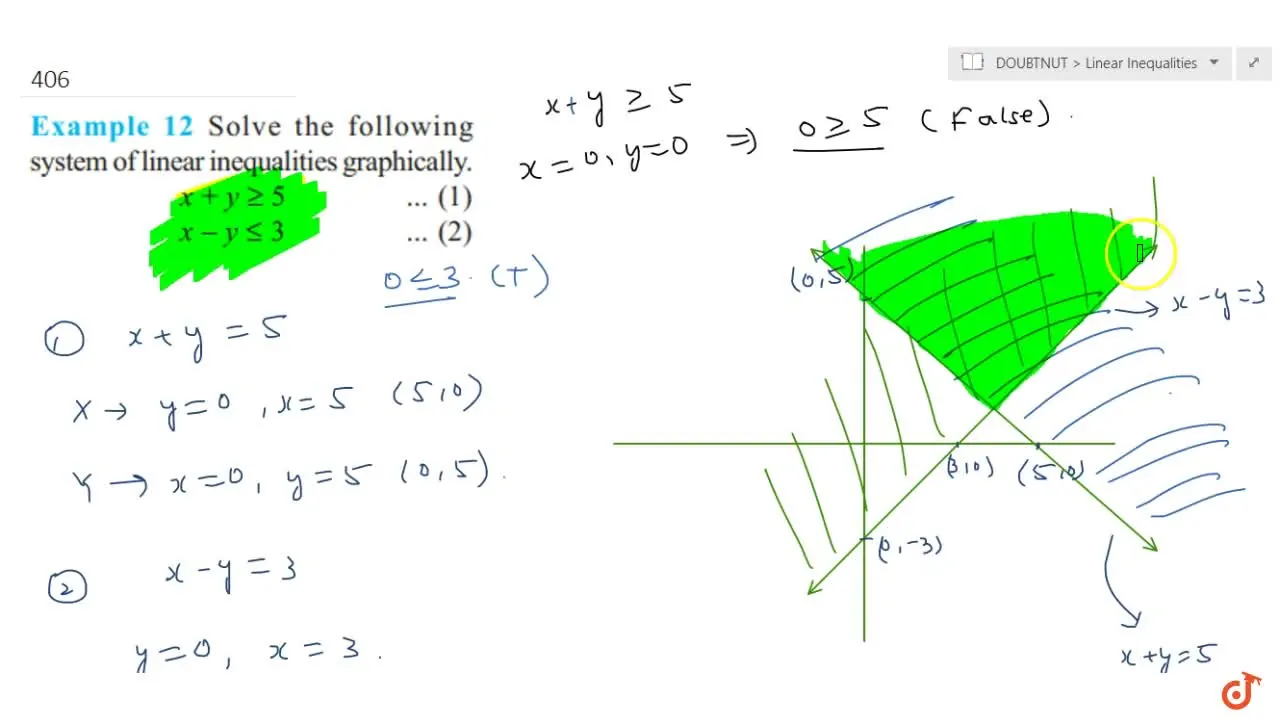
The graph of linear equation x+y=5 is shown in Figure.
The solution of the inequality (1) is represented by the shaded region above the line x+y=5, including the
points on the line.
On the same set of axes, we draw the graph of the equation x−y=3 as
shown in Fig. Then we note that inequality (2) represents the shaded region above the line x – y = 3, including the points on the line.
Clearly, the double shaded region, common to the above two shaded regions is the required solution region of the given system of inequalities.
[XI06_SLV12]
Related Playlists
- BOOK - NCERTCHAPTER - LINEAR INEQUALITIESEXERCISE - EXERCISE 6.210videos
LINEAR INEQUALITIES
- BOOK - NCERTCHAPTER - LINEAR INEQUALITIESEXERCISE - EXERCISE 6.315videos
LINEAR INEQUALITIES
- BOOK - NCERTCHAPTER - LIMITS AND DERIVATIVESEXERCISE - EXERCISE 13.38videos
LIMITS AND DERIVATIVES
- BOOK - NCERTCHAPTER - MATHEMATICAL REASONINGEXERCISE - EXERCISE 14.34videos
MATHEMATICAL REASONING
Similar Questions
Solve the following system of linear inequalities graphically.
x+y≥5 ... (1)
x−y≤3 ... (2)View SolutionSolve the following system of linear equations graphically: x−y=1
2x+y=8View SolutionSolve the following system of linear inequation graphically: 2x+3y≤6, x+4y≤4, x≥0, y≥0
View SolutionSolve the following system of linear inequation graphically: x−y≤1, x+2y≤8, 2x+y≥2, x≥0, y≥0
View SolutionSolve the following systems of linear inequations:
1≤|x−2|≤3View SolutionSolve the following system of linear equations graphically. 2x−y−4=0, x+y+1=0
View SolutionSolve the following system of inequalities graphically
x+2y≤8 ...(1)
2x+y≤8 ...(2)
x≥0 ...(3)
y≥0 ...(4)View SolutionSolve the following systems of linear inequations:
−11≤4x−3≤13View SolutionSolve the following systems of inequations graphically
5x+4y≤20,x≥1,y≥2.View SolutionSolve the following system of linear inequation graphically: x+y≥1, 7x+9y≤63, x≤6, y≤5, x≥0, y≥0
View Solution


