Read the bar graph given below and answer the following questions.
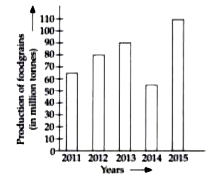
Find the difference between the production of foodgrains in million tonnes) in the year 2012 and 2015.
80
40
20
30
The correct Answer is:D
Step by step video & image solution for Read the bar graph given below and answer the following questions. Find the difference between the production of foodgrains in million tonnes) in the year 2012 and 2015. by Maths experts to help you in doubts & scoring excellent marks in Class 6 exams.
Related Playlists
- BOOK - MTG IIT JEE FOUNDATIONCHAPTER - DATA HANDLING EXERCISE - Exercise (Match the following)2videos
DATA HANDLING
- BOOK - MTG IIT JEE FOUNDATIONCHAPTER - DATA HANDLING EXERCISE - Exercise (Assertion & Reason Type )5videos
DATA HANDLING
- BOOK - MTG IIT JEE FOUNDATIONCHAPTER - DATA HANDLING EXERCISE - Exercise (Multiple Choice Questions) Level -135videos
DATA HANDLING
- BOOK - MTG IIT JEE FOUNDATIONCHAPTER - BASIC GEOMETRICAL IDEASEXERCISE - OLYMPIAD/HOTS CORNER10videos
BASIC GEOMETRICAL IDEAS
- BOOK - MTG IIT JEE FOUNDATIONCHAPTER - DECIMALSEXERCISE - OLYMPIAD/HOTS CORNER20videos
DECIMALS
Knowledge Check
- Question 1 - Select One
The line graph shows the number of deaths due to rail accidents in a certain state. Study the diagram and answer the following questions.
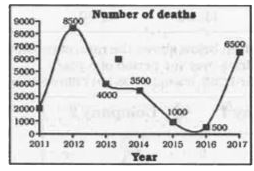
What was the difference between the number of deaths between the years 2012 and 2015?A6500B8500C7500D5500 - Question 1 - Select One
The graph shows the production of food grains of a country in different years. Study the graph and answer the questions.
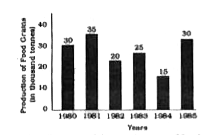
The difference between the production of food grains in the years 1981 and 1985 isA500 tonnesB100 tonnesC5000 tonnesD10000 tonnes - Question 1 - Select One
The bar graph provided below gives the data of the production of paper (in lakh tonnes) by three different companies X, Y and Z over the years. Study the bar chart and answer the following questions.
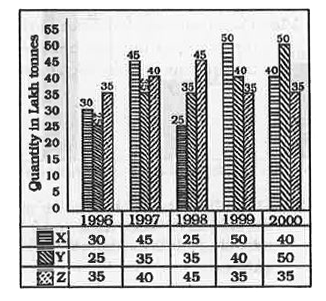
The difference between the production of company Z in 1998 and company Y in 1996 is :A25,00,000 tonnesB10,00,000 tonnesC15,00,000 tonnesD20,00,000 tonnes
Similar Questions
Read the bar graph given below and answer the following questions.
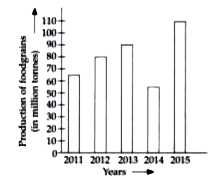
What is the ratio of the production of foodgrains in 2011 to that in 2014?View SolutionRead the bar graph given below and answer the following questions:
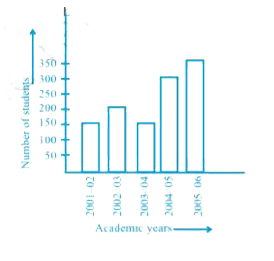
What information is given by the þar graph?View SolutionRead the bar graph given below and answer the following questions:

In which year is the number of students maximum?View SolutionRead the following bar graph given in figure and answer the following questions.
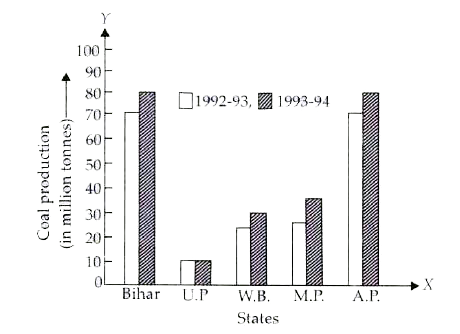
Which state has minimum production?View SolutionRead the bar graph given below and answer the following questions:
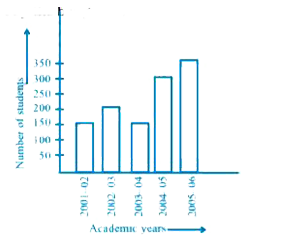
In which year is the number of students twice as that of 2001-02?View SolutionStudy the bar graph given below and answer the following questions.
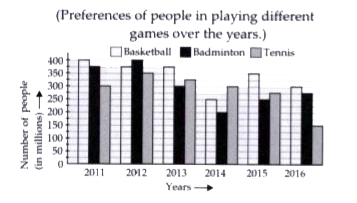
From 2011 to 2016, find the difference between the total number of people who preferred to play Basketball and Badminton (in millions) ?View SolutionRead the bar graph shown in figure and answer the following questions.
What is the information given by the bar graph?
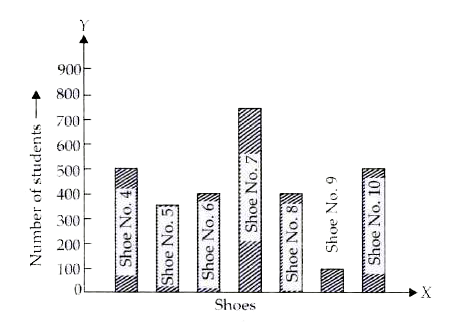 View Solution

