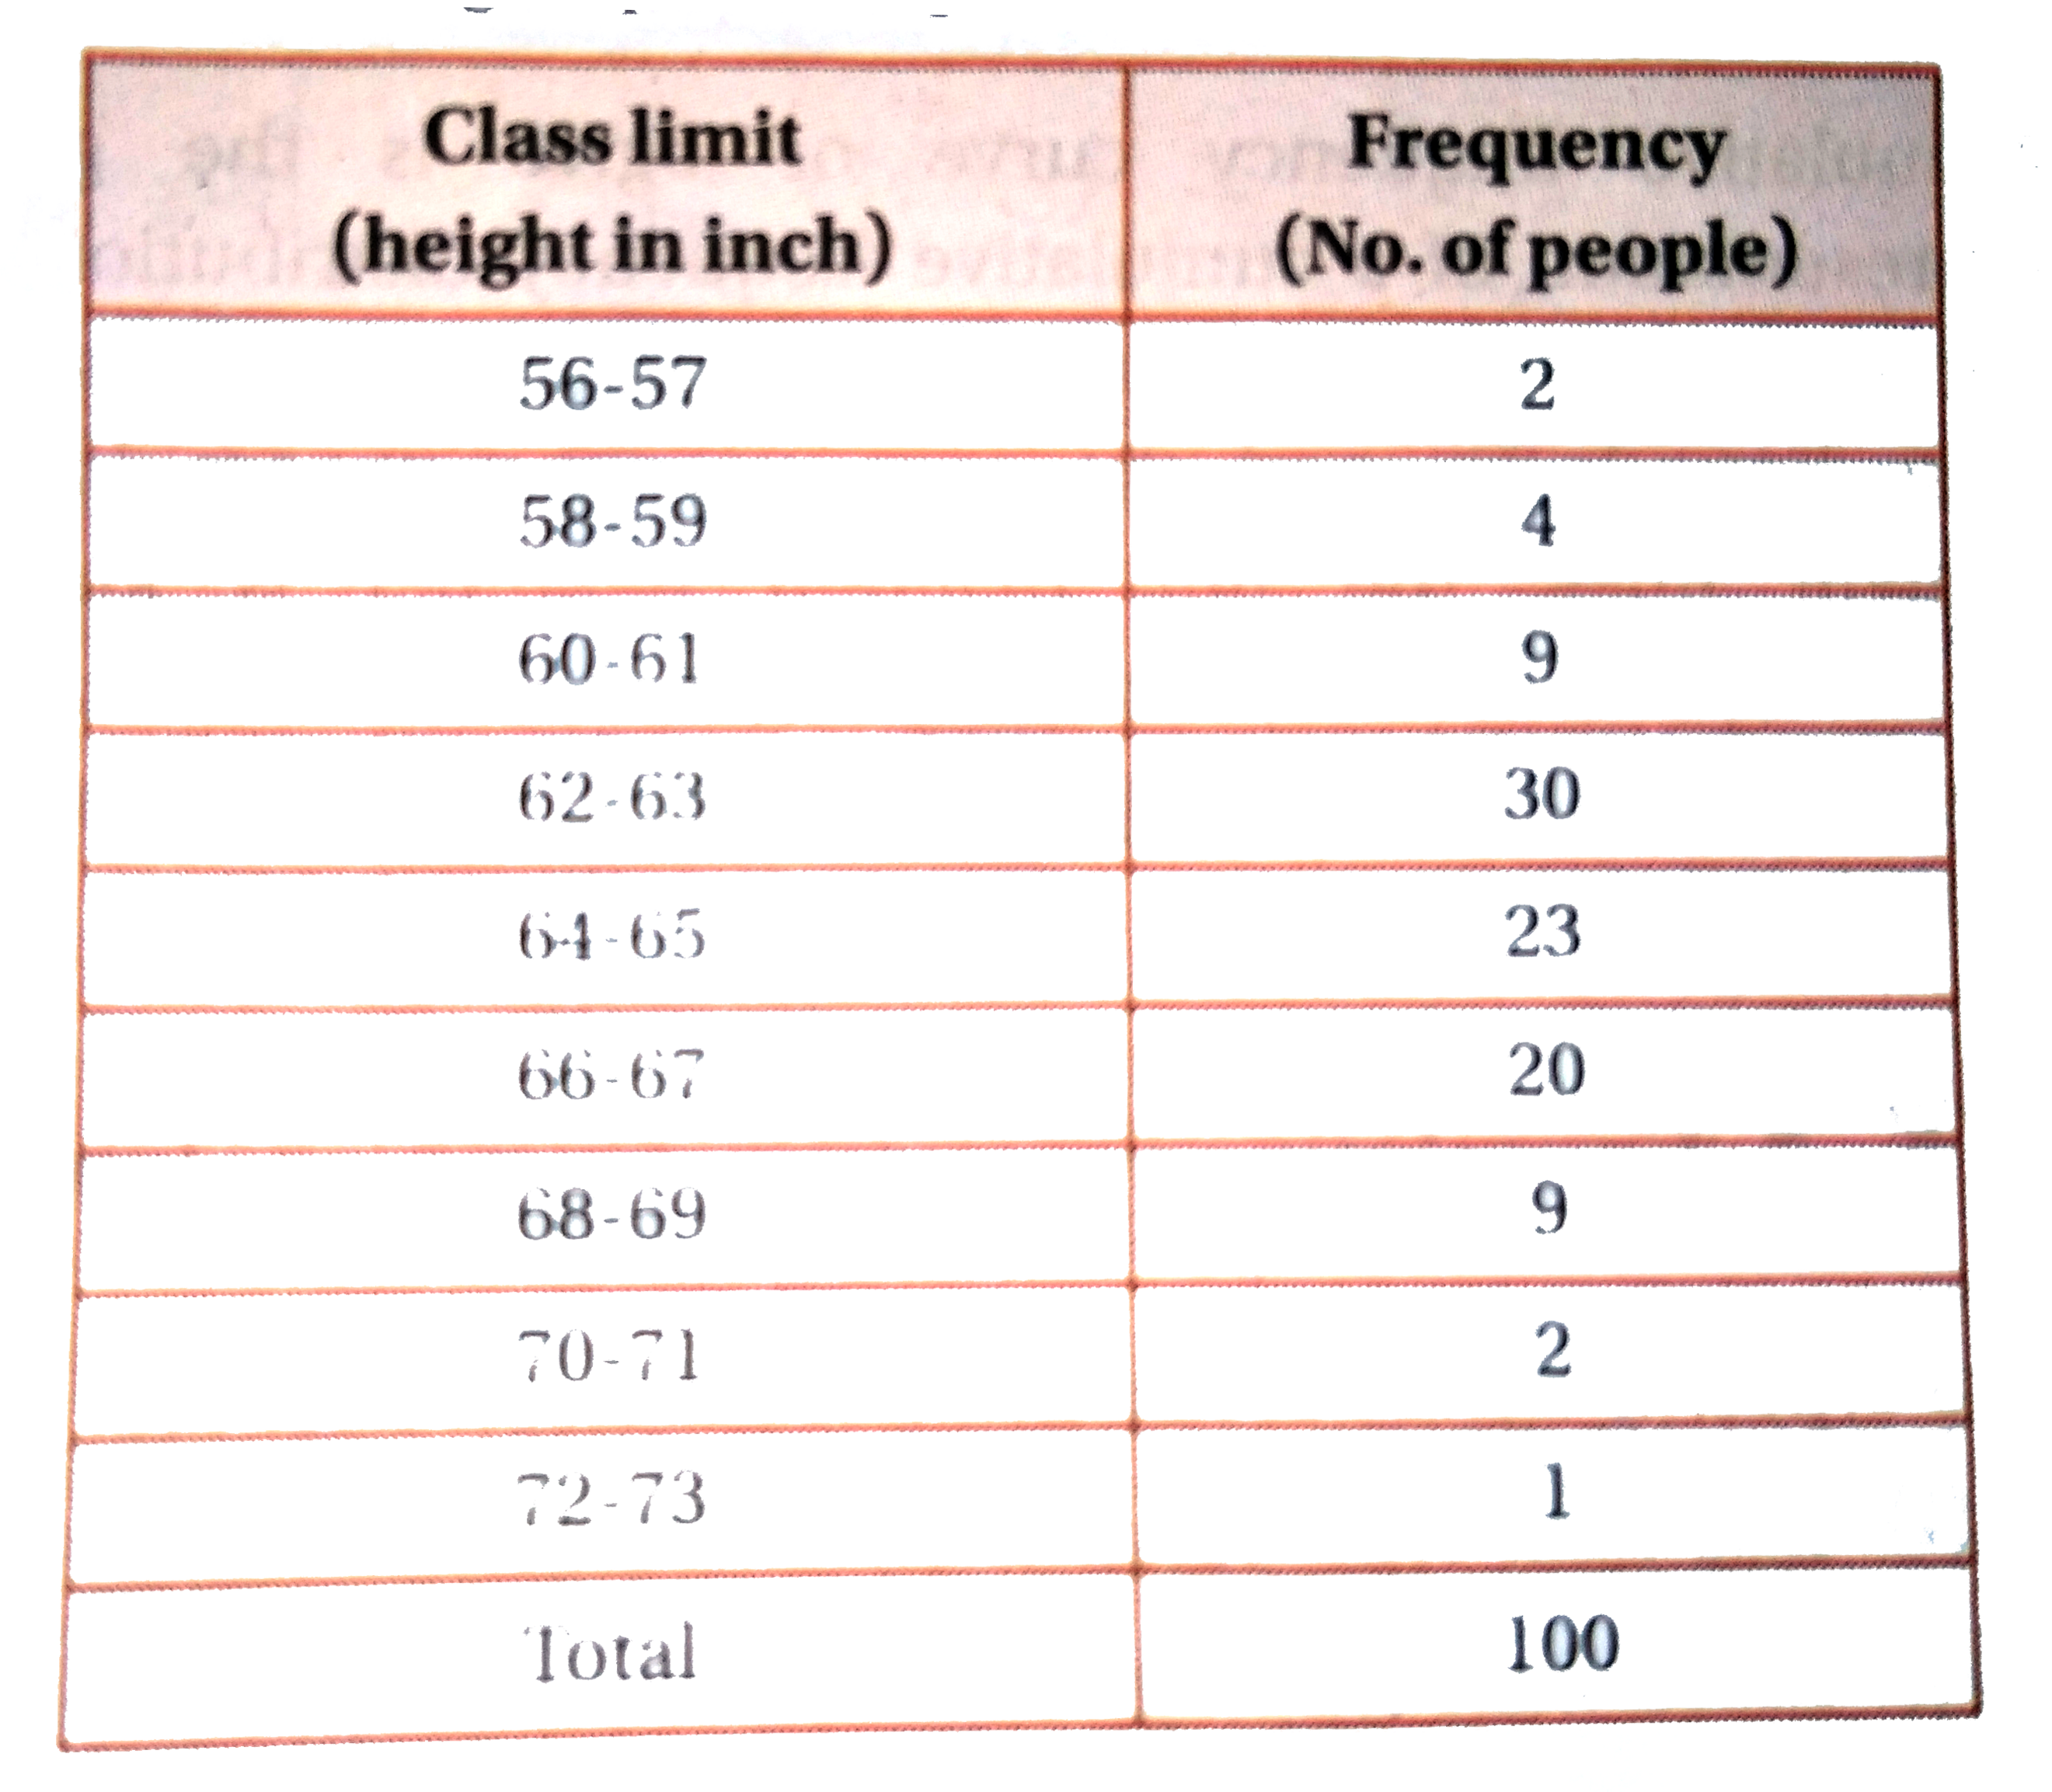
The following table gives the frequency distribution of heights in inches of a group of 100 peple:
 Draw a histogram for height distribution. Shade the portion of the histogram which will represent the total number of people whose heights lie between 60.5 and 66.5 inches. Solution in Bengali
Step by step video & image solution for The following table gives the frequency distribution of heights in inches of a group of 100 peple: Draw a histogram for height distribution. Shade the portion of the histogram which will represent the total number of people whose heights lie between 60.5 and 66.5 inches. by Maths experts to help you in doubts & scoring excellent marks in Class 11 exams.
Related Playlists
Similar Questions
A car manufacting company produces the following number of a cars in the first six months of the year 2005. Represent the data by a chart.
 04:21View Solution
The equation px2+2qxy+ry2+2sx+2ty+u=0 (where p≠q≠r and p,q,r,s,t and u are constants ) represents-
01:37View SolutionDraw a histogram to represent the following grouped frequency distribution.
 06:07View Solution
How many lines of symmetry does the above figure have ?
02:11View SolutionWhich of the following are correct chain isomers of butane ? (i)
01:31View SolutionDetermine the point of symmetry of a regular hexagon.
01:28View SolutionDtermine the images of the following figure about the given line :
02:45View SolutionDraw the bisector of ∠AOB=58∘
ltimg src="https://d10lpgp6xz60nq.cloudfront.net/physics_images/PS_MATH_VII_C05_S01_009_Q01.png" width="80%"gt02:17View SolutionMatch the following Column A to Column B
 05:41View Solution
Match the following Column A to Column B
 02:03View Solution
Match the following Column A to Column B
 02:10View Solution
The area of the shaded part in the figure given below is ______.
 02:17View Solution
The inequation represented by the graph given below is :
02:10View SolutionThe inequation that best describes the graph given below is _________
04:23View SolutionThe inequation that best describes the following graph is _________
03:12View SolutionWhich inequations represent the shaded region in the given figure
01:52View Solution


