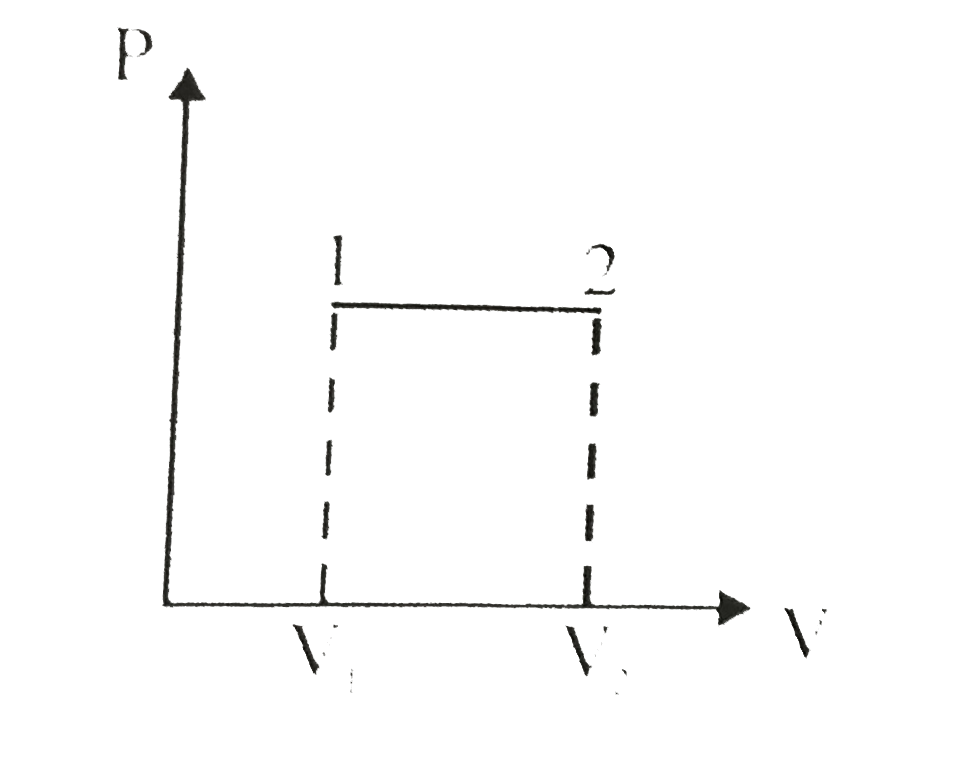
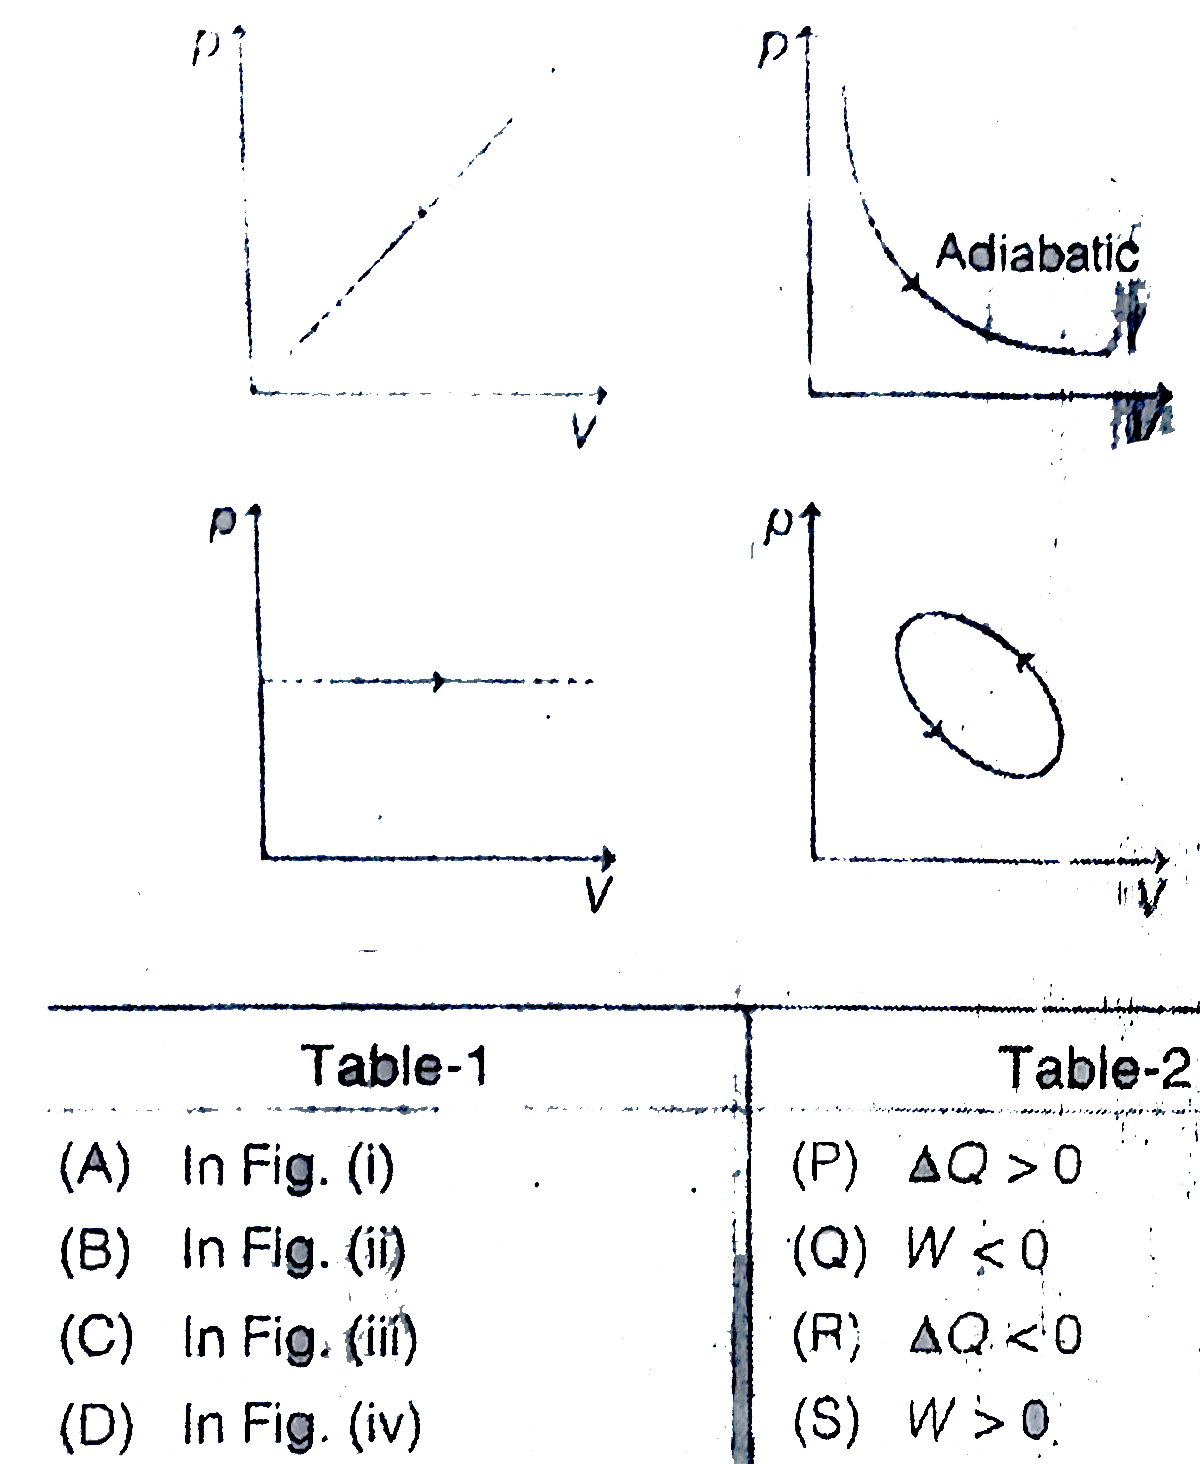
Figure below shows different processes for given amount of ideal gas

Column IColumn II(A)In figure (i)(P)ΔQ>0(B)In figure (ii)(Q)ΔW<0(C)In figure (iii)(R)ΔQ<0(D)In figure (iv)(S)ΔW>0(T)dU=0
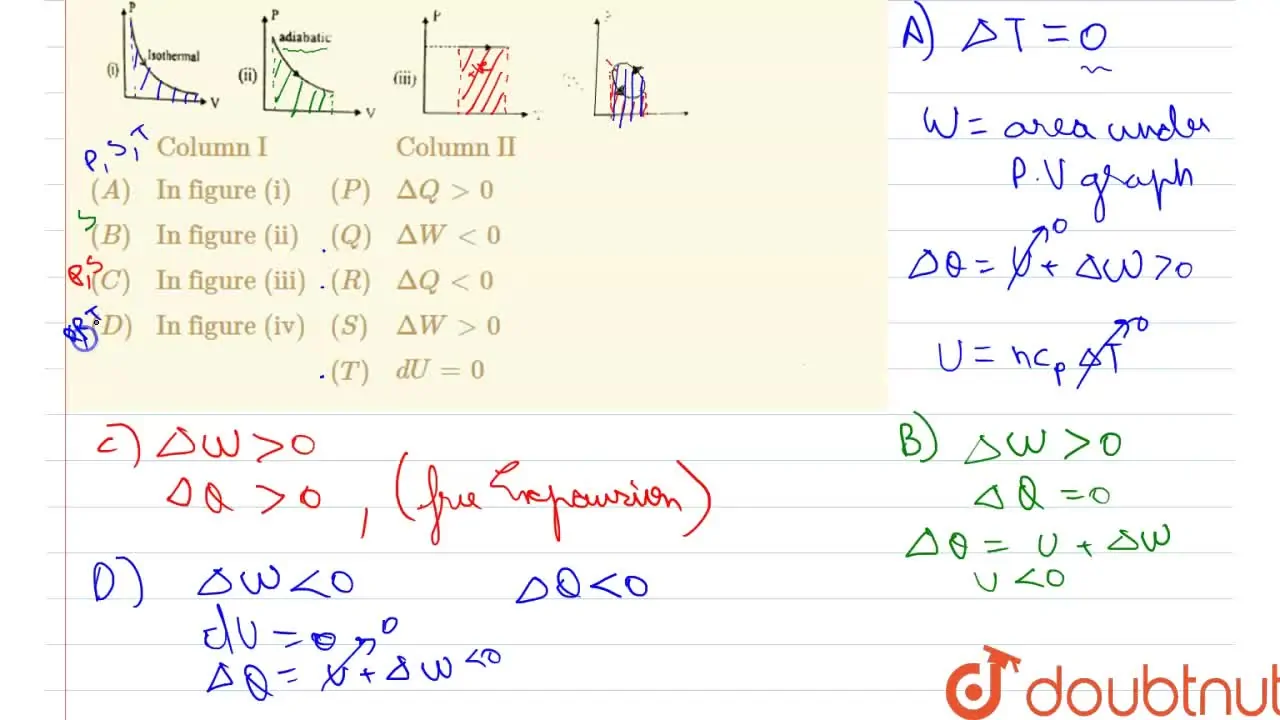
The correct Answer is:(A) = PST, (B) = S, (C) = PS, (D) = QRT
ΔQ=ΔU+ΔW
ΔU=ΔCvΔT
ΔT=0⇒ΔU=0 (option −T).
Volume increase then work done will be positive (option s).
Volume increases then work done will be positive (options).

Expansion takes places then work done will be positive (ooptions s)
ΔQ=nCPΔT=nCP(T2−T1)
ΔQ=nCP(PV2nR−PV1nR)
ΔQ=nCPPnR(V2−V1)
⇒ΔQ=PCPR(V2−V1)
Since ΔV is + ve hence ΔQ is positive For a cyclic process ϕU=0 (option - T) If cycle is anticlock the work done will be negative i.e. ΔW>0 (option - Q)
ΔQ=ΔU+ΔW
ΔQ=ΔW
Hence ΔQ>O (option - R)
Related Playlists
- BOOK - BANSALCHAPTER - TEST PAPERSEXERCISE - PHYSICA PART A12videos
TEST PAPERS
- BOOK - BANSALCHAPTER - TEST PAPERSEXERCISE - PHYSICA PART B1videos
TEST PAPERS
- BOOK - BANSALCHAPTER - TEST PAPERSEXERCISE - PHYSICS PART A35videos
TEST PAPERS
- BOOK - BANSALCHAPTER - SEMICONDUCTORSEXERCISE - CBSE Question32videos
SEMICONDUCTORS
Similar Questions
Match the column :-
Column - IColumn - IIAAdiabatic processPq=0BIsothermal processQΔH=0CIsoenthalpic processRΔT=0DIsoentropic processSΔS=0View SolutionMatch Column I with Column II.
Column I Column II(i)Equilibrium(a)ΔG>0,K<1(ii)Spontaneous reaction(b)ΔG=0(iii)Non-spontaneous reaction(c)ΔGΘ=0(d)ΔG<0,K>1View SolutionColumn-IColumn-II(A)Order of I.E1(P)Mg<Al<Si(B)Order of size(Q)Li>Be>B>C(C)Order of electronegativity (R)Li>Na(D)Order of electron affinity(S)Cl>F>Br>I(T)Li>Mg>Na>P
View SolutionMatch the entries listed in Column I with appropriate entries listed in Column II.
Column IColumn II(A)Isothermal process(p)(∂U∂V)T=0(B)−nFΘE(q)W=−ΔU(C)Adiabatic reaction(r)ΔU=0(D)van der waals gas(s)ΔGΘ(E)Ideal gas(t)(∂T∂P)H≠0View SolutionFor the given process :-
_E01_426_Q01.png)
Column-IColumn-II(A)Process J→K(P)W>0(B)Process K→L(q)W<0(C)Process L→M(r)Q>0(D)Process M→J(s)Q<0View SolutionMatch the statement in Column I with the statements in Column II. One or more than one choice from Column II can match with a statement from Column I.
Column IColumn II(a)Young's modulus(p)−ΔVρV(b)Bulk modulus(q)FlAΔl(c)Compressibility(r)−Δd/dΔDl/l(d)Poisson's ratio(s)−ρVΔVView SolutionThe figures given below show different processes (relating pressure P and volume V) for a given amount of an ideal gas. W is work done by the gas and ΔQ is heat absorbed by the gas.
 View Solution
Column IColumn II(Metal ion configuration in weak ligand field)(CFSE, Δ0 value)(A)d4(p)0.0(B)d5(q)−0.4(C)d6(r)−0.6(D)d7(s)−0.8
View SolutionMatch the column-
Column-IColumn-IIRelated to processRelated to system(A)Fusion at melting point(P)ΔG=0(B)Vapouristion at boiling point(Q)ΔG<0(C)Condesation at triple point(R)ΔS>0(D)Melting at normal boiliong point (S)ΔH≅ΔUView SolutionColumn−IColumn−II(a)Acetone+CHCI3(p)ΔS>0(b)Ethanol +water(q)ΔH>0(c)C2H5Br+C2H5I(r)ΔH<0(d)Acetone+Benzne(s)Maximum boiling azetropes(t)Minimum boiling azeotropes
View Solution


