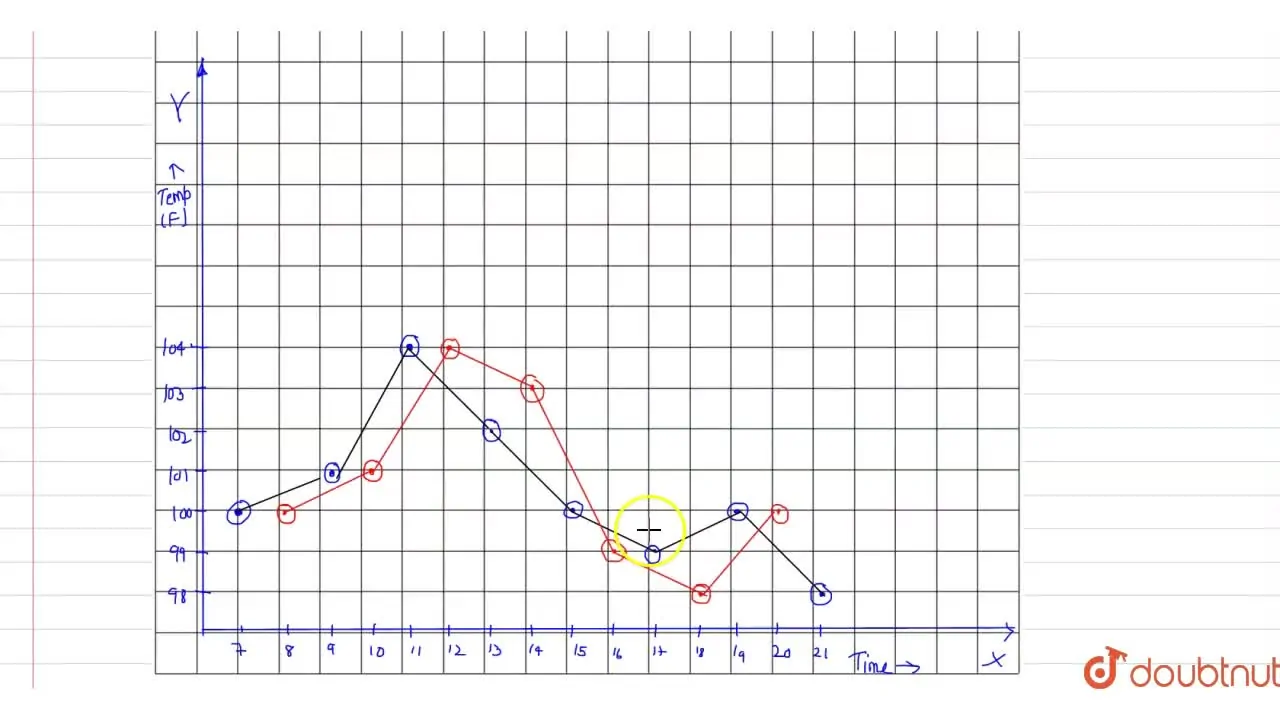
Draw the temperature-time graph in each of the following cases: Time (in hours:), 7:00, 9:00, 11:00, 13:00, 15:00, 17:00, 19:00, 21:00 Temperature 0F) ∈ , 100, 101, 104, 102, 100, 99, 100, 98 (ii) Time (in hours), 8:00, 10:00, 12:00, 14:00, 16:00, 18:00, 20: Temperature ( 0F) in, 100, 101, 104, 103, 99, 98, 100
Step by step video & image solution for Draw the temperature-time graph in each of the following cases: Time (in hours:), 7:00, 9:00, 11:00, 13:00, 15:00, 17:00, 19:00, 21:00 Temperature \ ^0F)\ in , 100, 101, 104, 102, 100, 99, 100, 98 (ii) Time (in hours), 8:00, 10:00, 12:00, 14:00, 16:00, 18:00, 20: Temperature (\ ^0F) in, 100, 101, 104, 103, 99, 98, 100 by Maths experts to help you in doubts & scoring excellent marks in Class 8 exams.
Related Playlists
Similar Questions
Draw the velocity-time graph from the following data: Time (in hours), 7:00, 8:00, 9:00, 10:00, 11:00, 12:00, 13:00, 14:00 Speed in km/hr, 30, 45, 60, 50, 70, 50, 40, 45
View SolutionThe temperature of patient, admitted in a hospital with typhoid fever, taken at different times of the day are given below. Draw the temperature-time graph to represent the data: Time (in hours), 6:00, 8:00, 10:00, 12:00, 14:00, 16:00, 18:00 Temp. (in 0F): , 102, 100, 99, 103, 100, 102, 99
View SolutionA car is going for a long journey of 16 hours, starting at 5:00 hrs. The speeds of the car at different hours are given below: Time (in hours):, 5:00, 7:00, 9:00, 11:00, 13:00, 15:00, 17:00, 19:00, 21:00 Speed (in km/hour):, 40, 50, 60, 80, 70, 65, 75, 60, 50. Draw a velocity-time graph for the above data:
View SolutionWhat is the fraction of the solute in a 1.00 m aqueous solution ?
View SolutionExpress the following numbers in standard form:
(i) 5,00,00,000
(ii) 70,00,000
(iii) 3,18,65,00,000
(iv) 3,90,878
(v) 39087.8
(vi) 3908.78View SolutionGiven below is the temperature chart of a patient. Find the temperature of the patient at 12:00 hours and 18:00 hours. At what time is the temperature (ii) highest? (ii) lowest?
View SolutionFind the area of the triangle formed by the points
(9,-7),(2,4) and (0,0)View SolutionWrite the number whose expanded form is given below:
6×10,00,000+4×1,00,00,000+3×10,00,000+4×1,000+2×100+10+2View SolutionThe speeds of ten particles are ( in m/s) 6.00, 5.00, 8.00, 10.0, 10.0, 14.0, 14.0, 18.0, and 20.0 m/s (i) What is the average speed, (ii) What is the rms speed and (iii) What is the most probable speed of the particles?
View SolutionThe accuracy in the measurement of speed of light is 3.00×10⁸m/s is
View Solution


