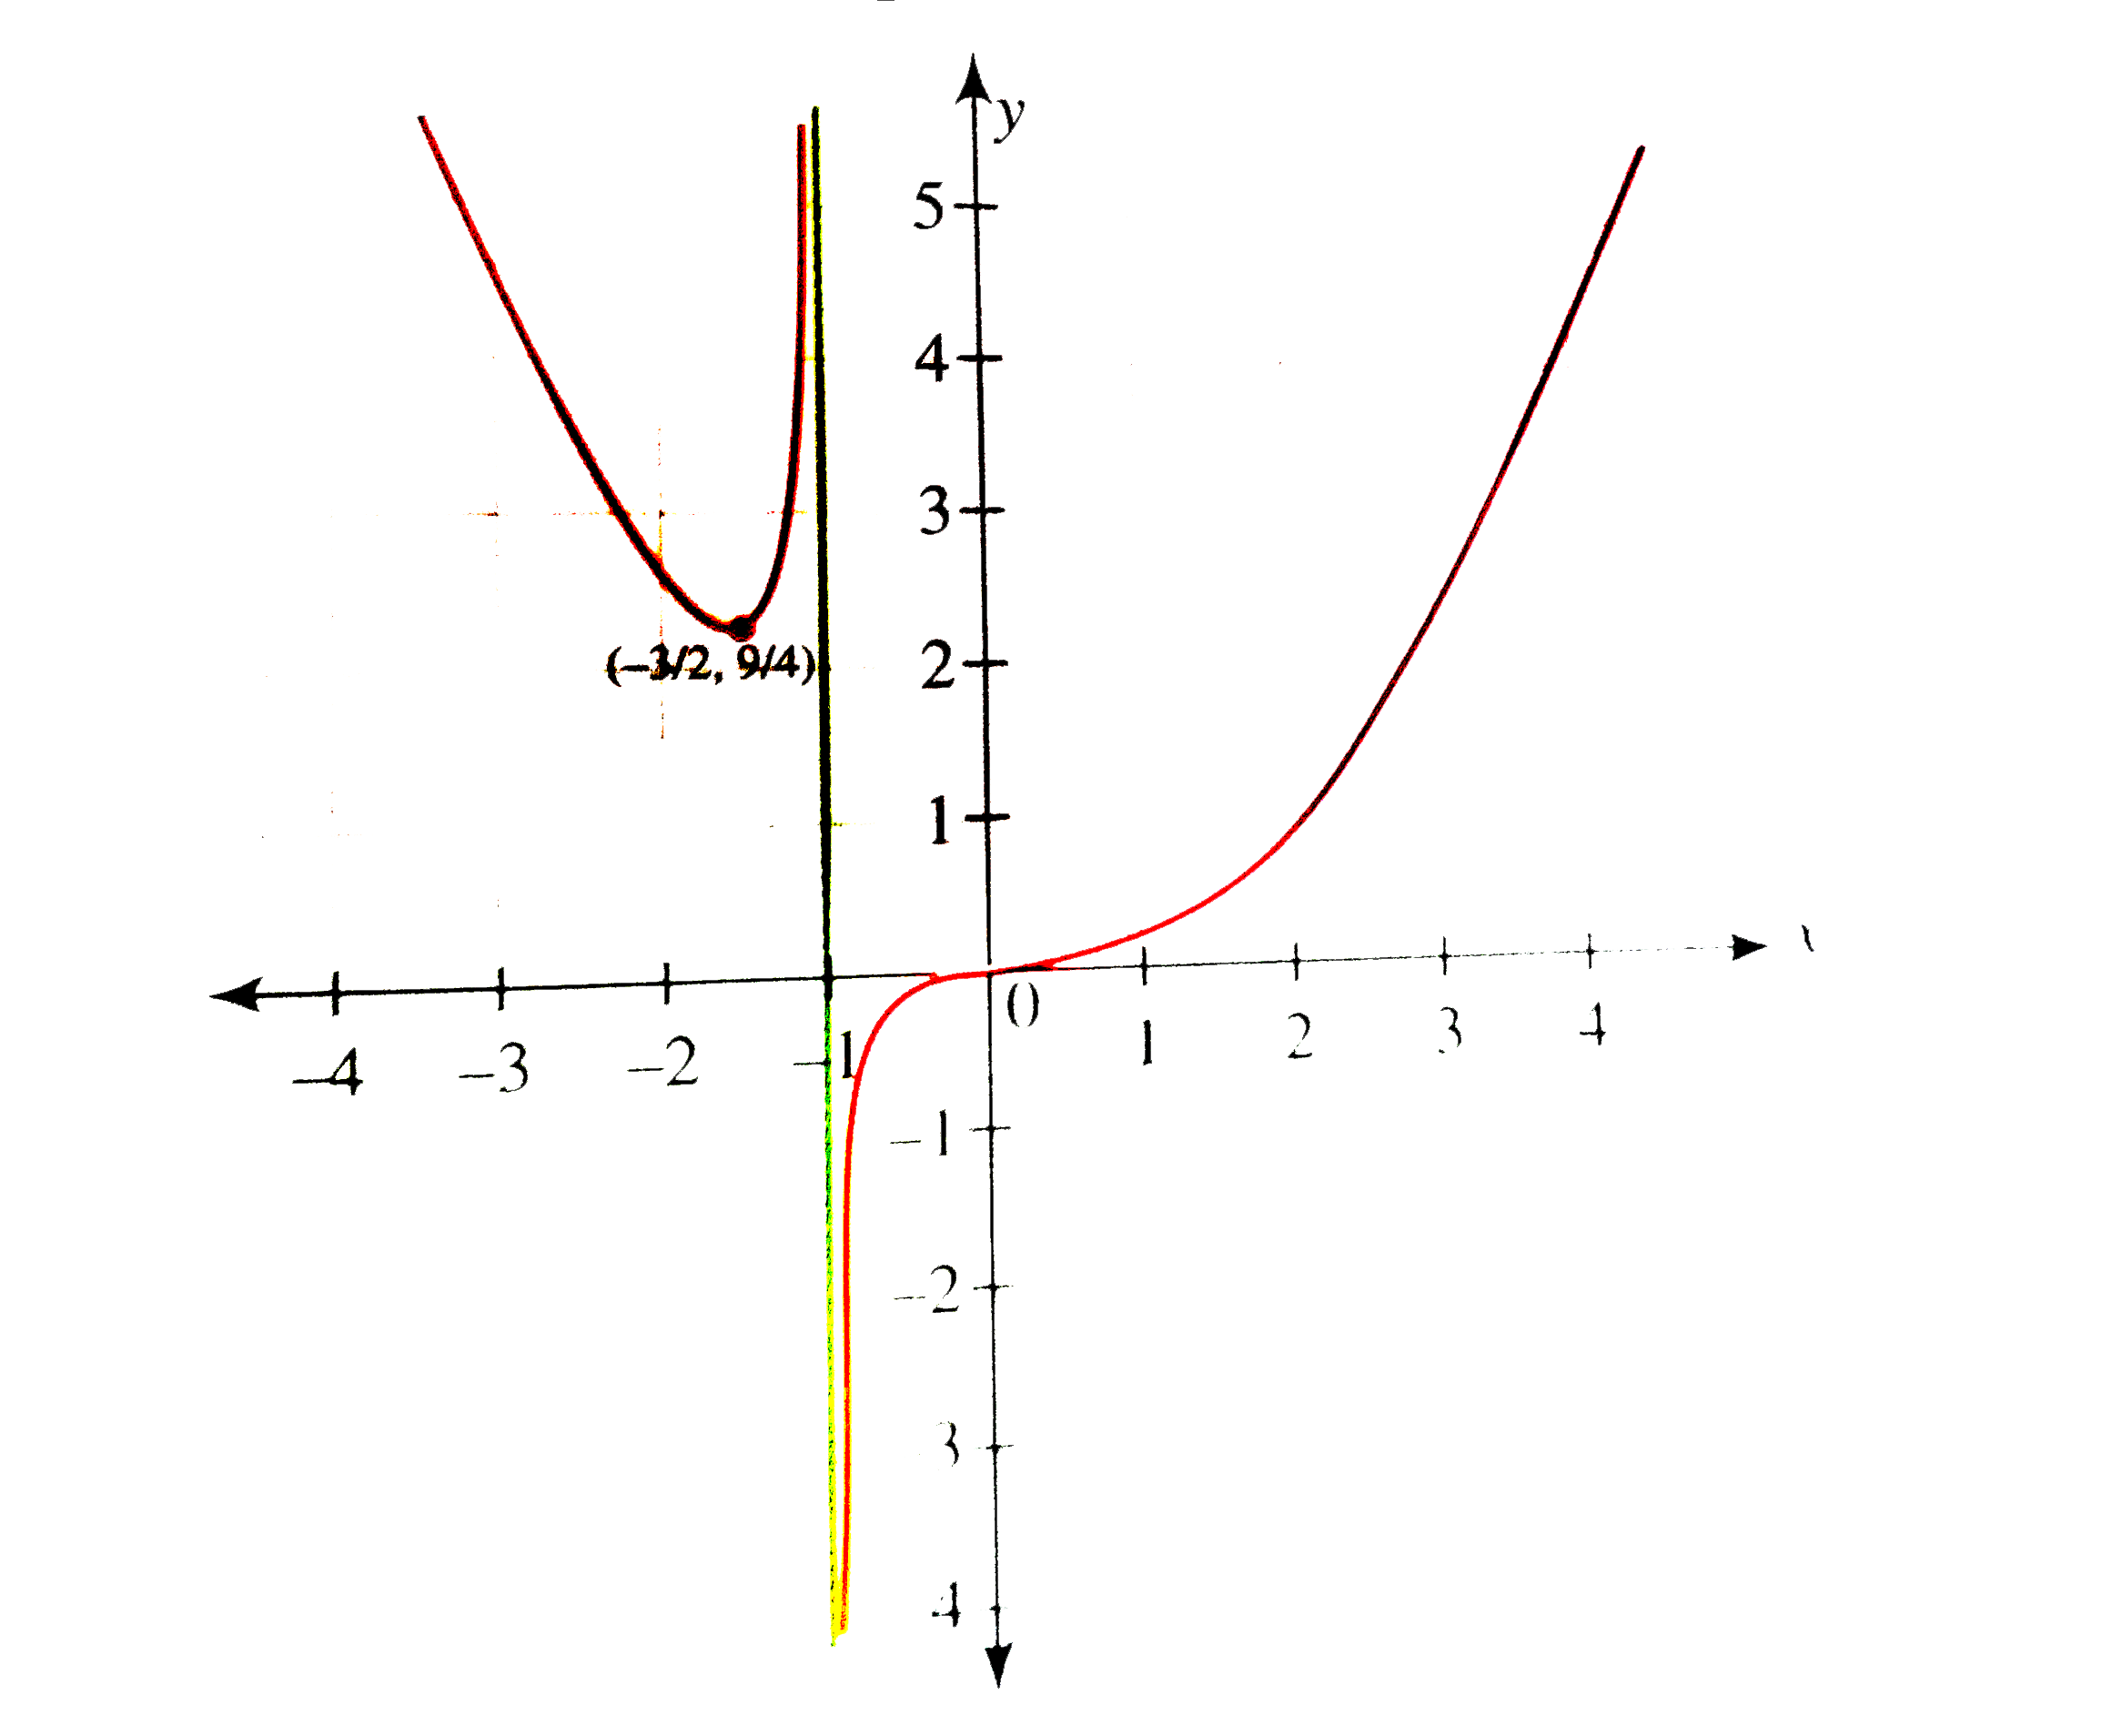
Draw the graph of y=x33(x+1).
Video Solution
Text Solution
We have y=f(x)=x33(x+1)
Domain of the function is R-{-1}.
Graph cuts the axis at (0,0).
It has vertical asymptote x=-1, where the denominator becomes Zero.
Cleary, the graph has no horizontal and oblique asymptote.
f'(x)=3x2(x+1)−x33(x+1)2=x2(2x+3)3(x+1)2
f'(x)=0∴x=0,−3/2
f'(x)>0 for x>−3/2. So the function increases in (−3/2,∞)−{−1}.
f'(x)<0 for x<−3/2. So the function decreases in (−∞,−3/2).
x=−3/2 is the point of minima.
f'(0)=0 but x=0 is not a point of minima/maxima, so it is the point of inflection where the curve changes its concavity.
limx→−∞x3x+1=∞,f(−3/2)=9/4
Thus, f(x) decreases from '∞' to '9/4' in (−∞,−3/2).
limx→−1−x3x+1=∞
Thus, f(x) increases from '9/4' to '∞' in (-3/2,-1).
limx→−1−x3x+1=−∞ and limx→∞x3x+1=∞
Thus, f(x) increases from '−∞' to '∞' in (−1,∞) intersecting the x-axis at (0,0) and having point inflection as well at this point.
From the above discussion, the graph of y=f(x) can be drawn as follows.

|
Topper's Solved these Questions
- GRAPHS OF POLYNOMIAL AND RATIONAL FUNCTIONSBook:CENGAGE ENGLISHChapter:GRAPHS OF POLYNOMIAL AND RATIONAL FUNCTIONSExercise:Exercises
Explore 17 Videos
- GRAPHICAL TRANSFORMATIONSBook:CENGAGE ENGLISHChapter:GRAPHICAL TRANSFORMATIONSExercise:ILLUSTRATION
Explore 78 Videos
- GRAPHS OF ELEMENTARY FUNCTIONS Book:CENGAGE ENGLISHChapter:GRAPHS OF ELEMENTARY FUNCTIONS Exercise:EXERCISES
Explore 34 Videos
Similar Questions
Draw the graph of y=x3/5
View SolutionDraw the graph of y=3x−4
View SolutionDraw the graph of y=2x−1
View SolutionDraw the graph of y=x+1x
View SolutionDraw the graph of y=−2x+32
View SolutionDraw the graph of y=tan(3x).
View SolutionDraw the graph of y=x−1x−2.
View SolutionDraw the graph of y=√xx−1
View SolutionDraw the graph of f(x)=5x2(x−1)3.
View SolutionDraw the graph of y=1x2.
View Solution

