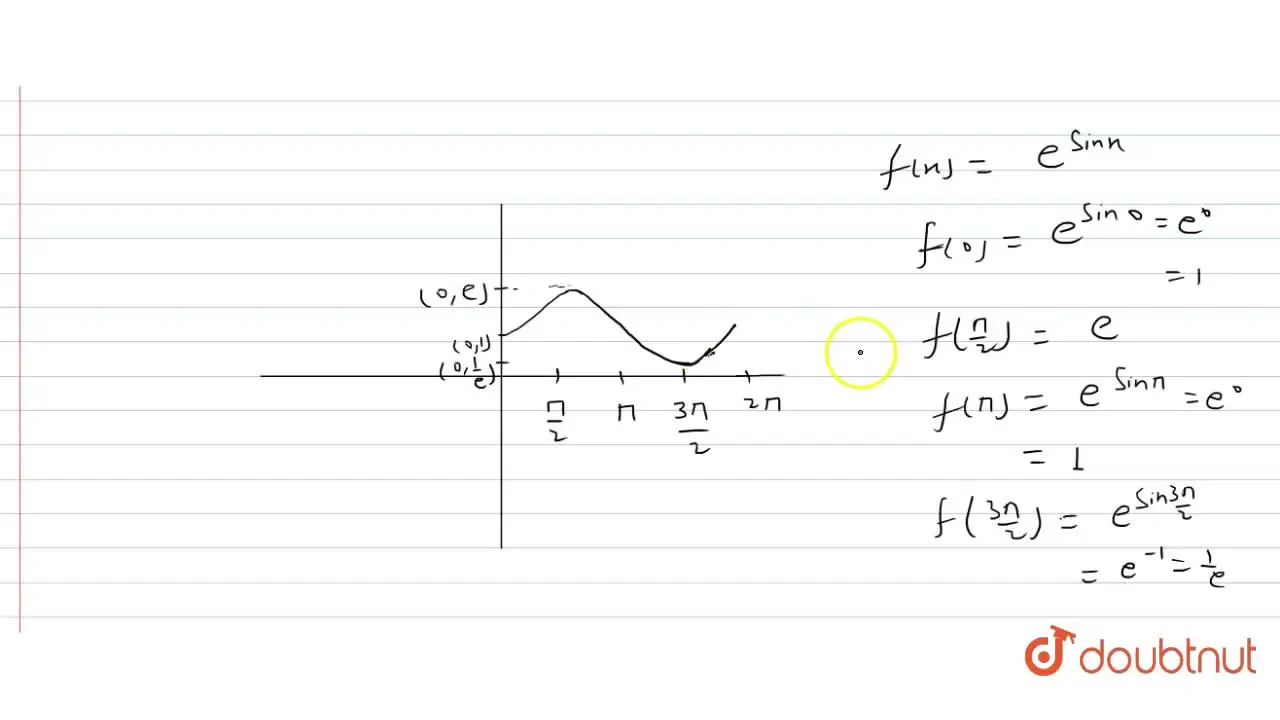
Draw the graph of f(x)=esinx.
Video Solution
Text Solution
We have y=f(x)=esinx
f(x+2π)=f(x) for all x∈R
Hence f(x) is periodic with period 2π.
So we need to draw the graph for the interval [0,2π] only.
Since the function is continuous, we selecet quadrant angles to plot point on the graph.
f(0)=esin0=e0=1
f(x)=1,f(2π)=1
f(π/2)=esin(π/2)=e
f(3π/2)=esin(3π/2)=1/e
So we have the graph of the function as shown in the following figure. In intervals [2π,4π],[4π,6π],... we repeat the graph which we get in the interval [0,2π].

|
Updated on:21/07/2023
Related Playlists
- BOOK - CENGAGECHAPTER - GRAPHS OF TRIGONOMETRIC FUNCTIONSEXERCISE - Exercise22videos
GRAPHS OF TRIGONOMETRIC FUNCTIONS
- BOOK - CENGAGECHAPTER - GRAPHS OF ELEMENTARY FUNCTIONS EXERCISE - Exercise34videos
GRAPHS OF ELEMENTARY FUNCTIONS
- BOOK - CENGAGECHAPTER - HIGHT AND DISTANCE EXERCISE - JEE Previous Year3videos
HIGHT AND DISTANCE
Similar Questions
Draw the graph of f(x)=√sinx.
View SolutionDraw the graph of f(x)=x2−3
View SolutionDraw the graph of f(x)=ex1+ex. Also find the point of inflection.
View SolutionDraw the graph of f(x)=x|x|.
View SolutionDraw the graph of f(x)=sgn(x−2).
View SolutionDraw the graph of f(x)={sinx}, where {⋅} represents the fractional part function.
View SolutionDraw the graph of y=sinxx.
View SolutionDraw the graph of f(x)=e−x2. Discuss the concavity of the graph.
View SolutionDraw the graph of y=loge(sinx).
View SolutionDraw the graph of:
y=f(x)=3sin(2x−1).View Solution


