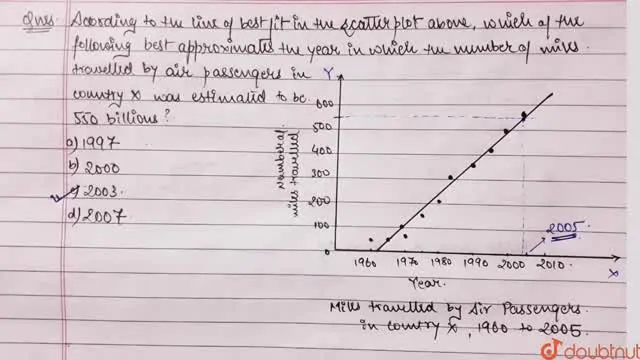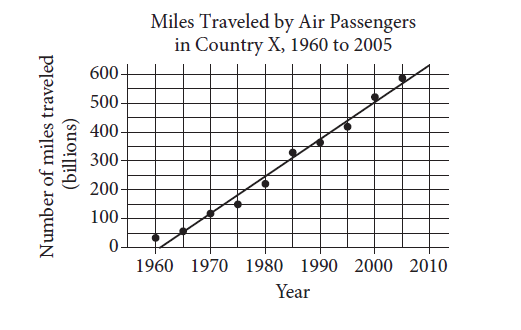
According to the line of best fit in the scatterplot above, which of the following best approximates the year in which the number of miles traveled by air passengers in Country X was estimated to be 550 billion?
1997
2000
2003
2008
Choice C is correct. According to the graph, the horizontal line that represents 550 billion miles traveled intersects the line of best fit at a point whose horizontal coordinate is between 2000 and 2005, and slightly closer to 2005 than to 2000. Therefore, of the choices given, 2003 best approximates the year in which the number of miles traveled by air passengers in Country X was estimated to be 550 billion.
Choice A is incorrect. According to the line of best fit, in 1997 the estimated number of miles traveled by air passengers in Country X was about 450 billion, not 550 billion. Choice B is incorrect. According to the line of best fit, in 2000 the estimated number of miles traveled by air passengers in Country X was about 500 billion, not 550 billion. Choice D is incorrect. According to the line of best fit, in 2008 the estimated number of miles traveled by air passengers in Country X was about 600 billion, not 550 billion.
Similar Questions
Which of the following best approximates the meaning of the "pulse of germ and birth"?
View Solution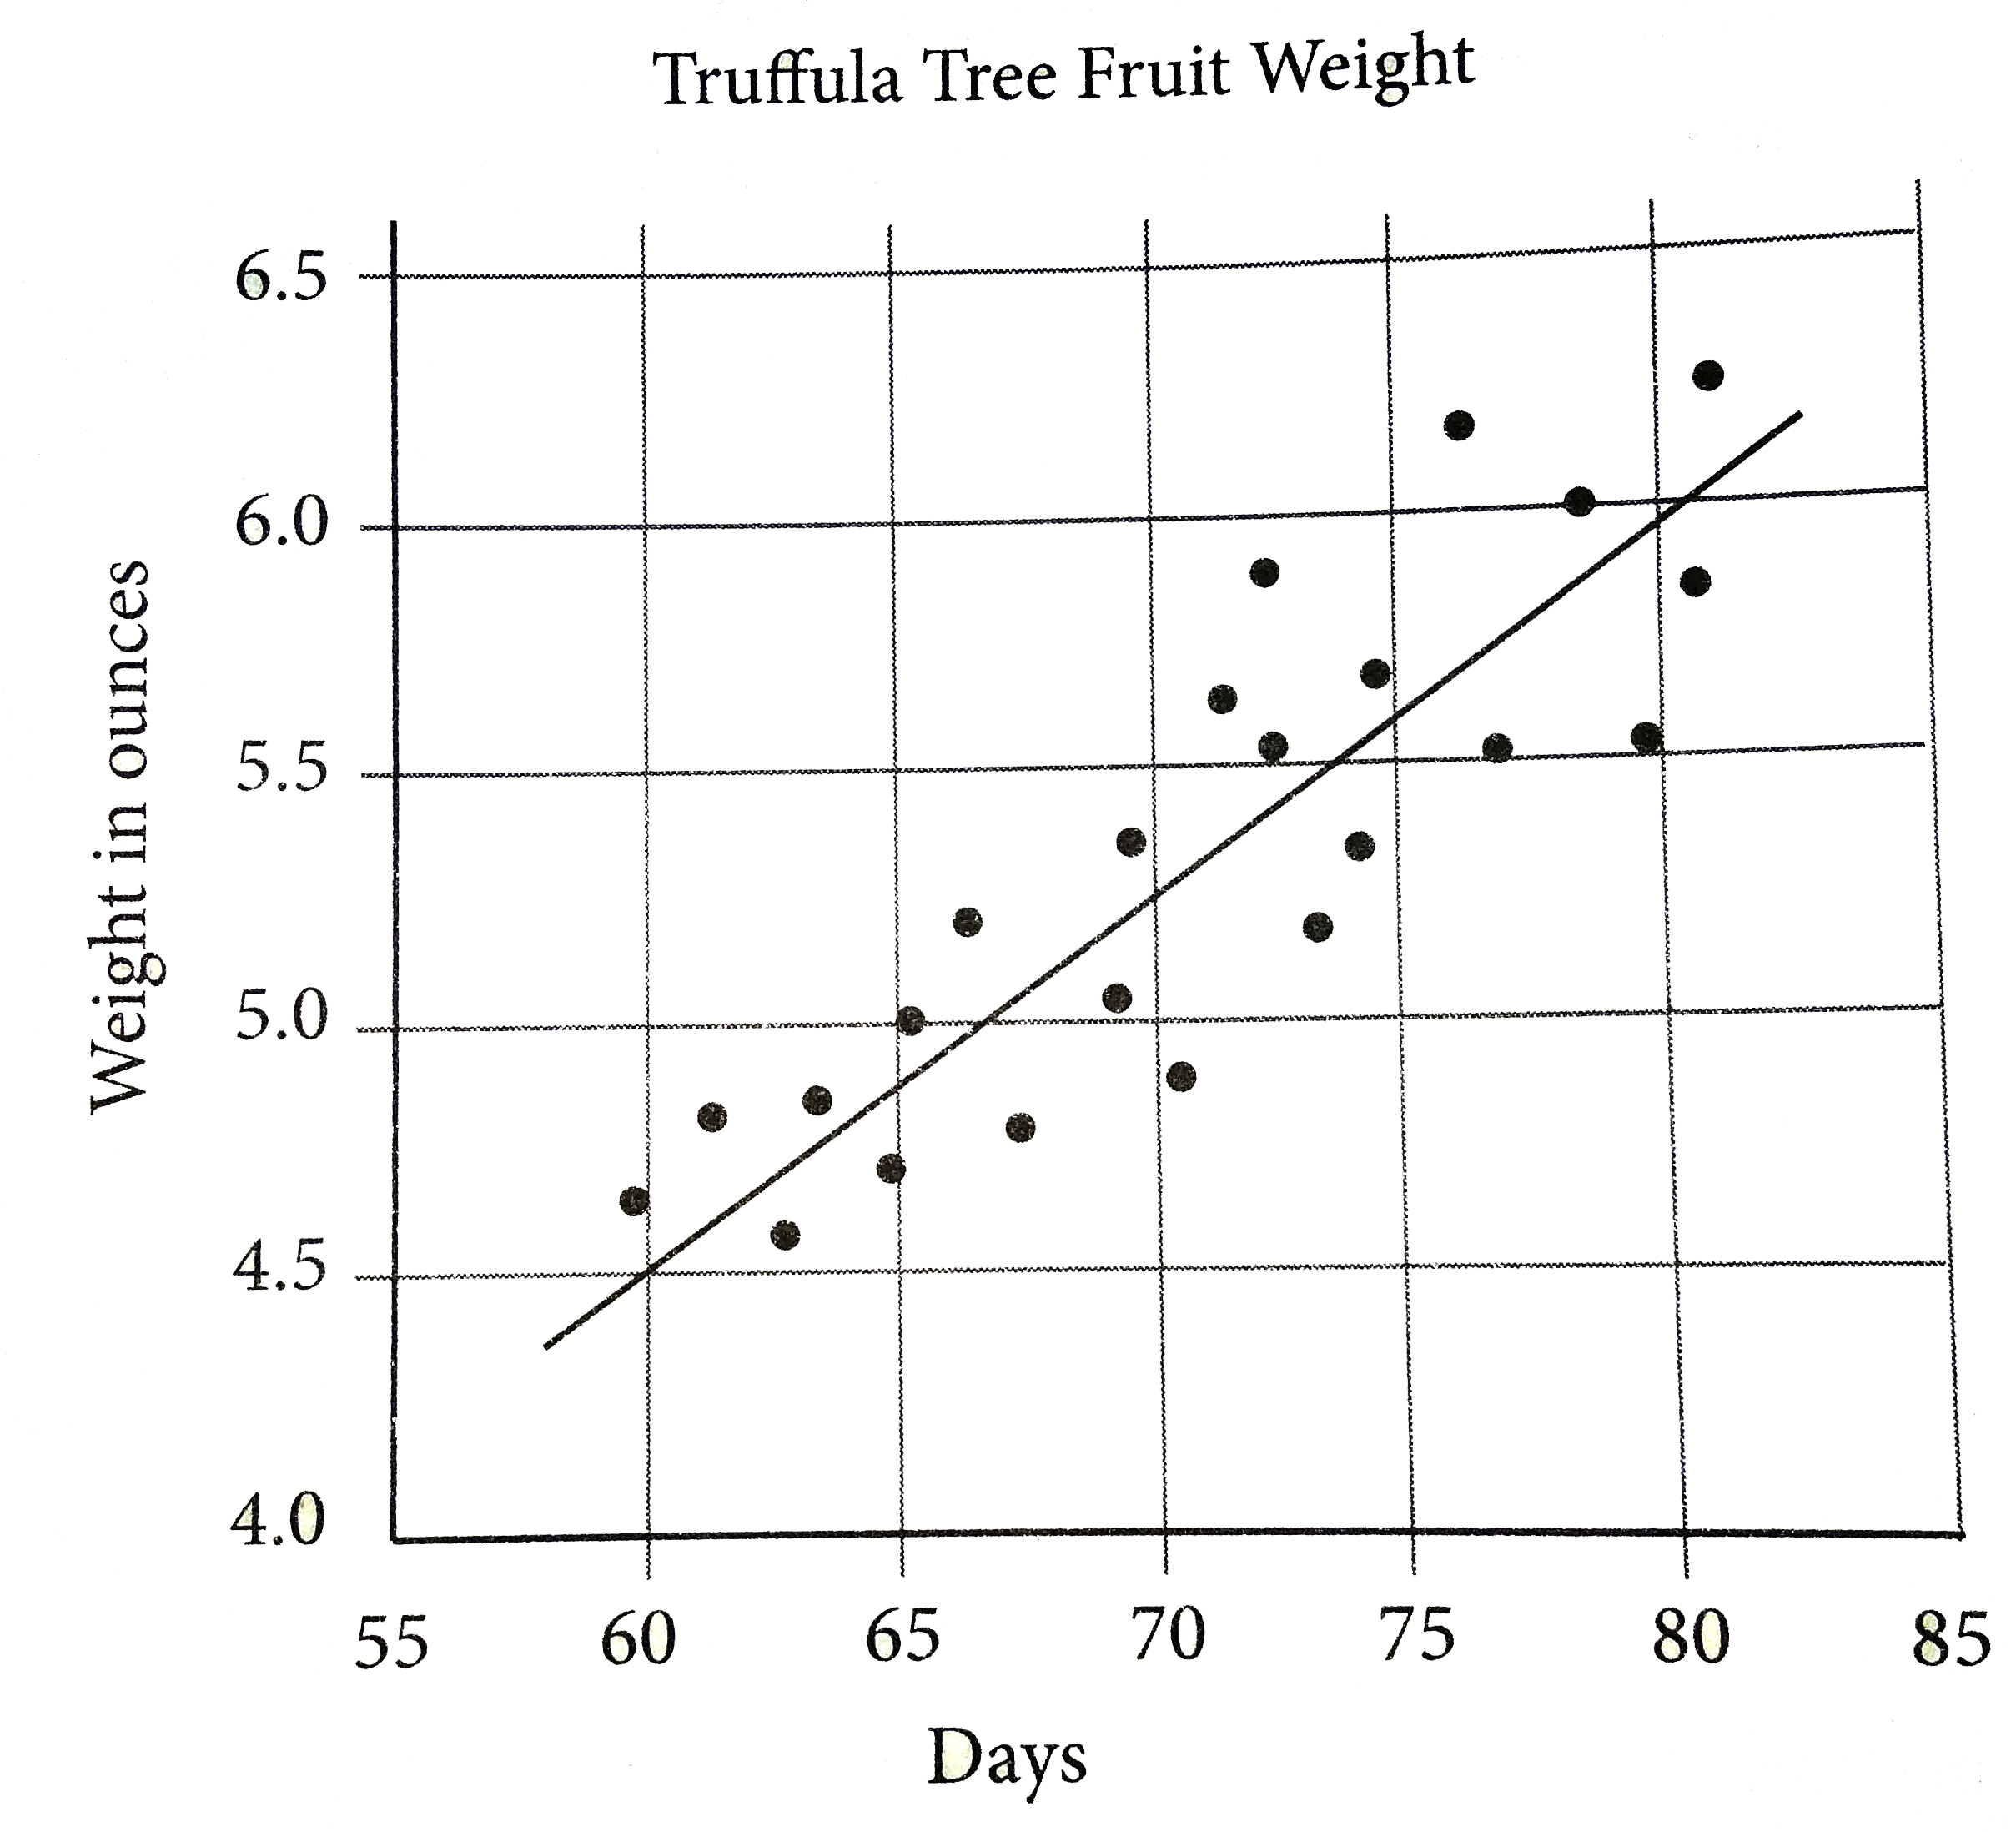
The scatterplot above shows the weight, in ounces,of the fruits on a certain truffula tree from days 55 to 85 after flowering. According to the line of best fit in the scatterplot above, which of the following is the closest approximation of the number of days after flowering of a truffula fruit that weighs 5.75 ounces?View Solution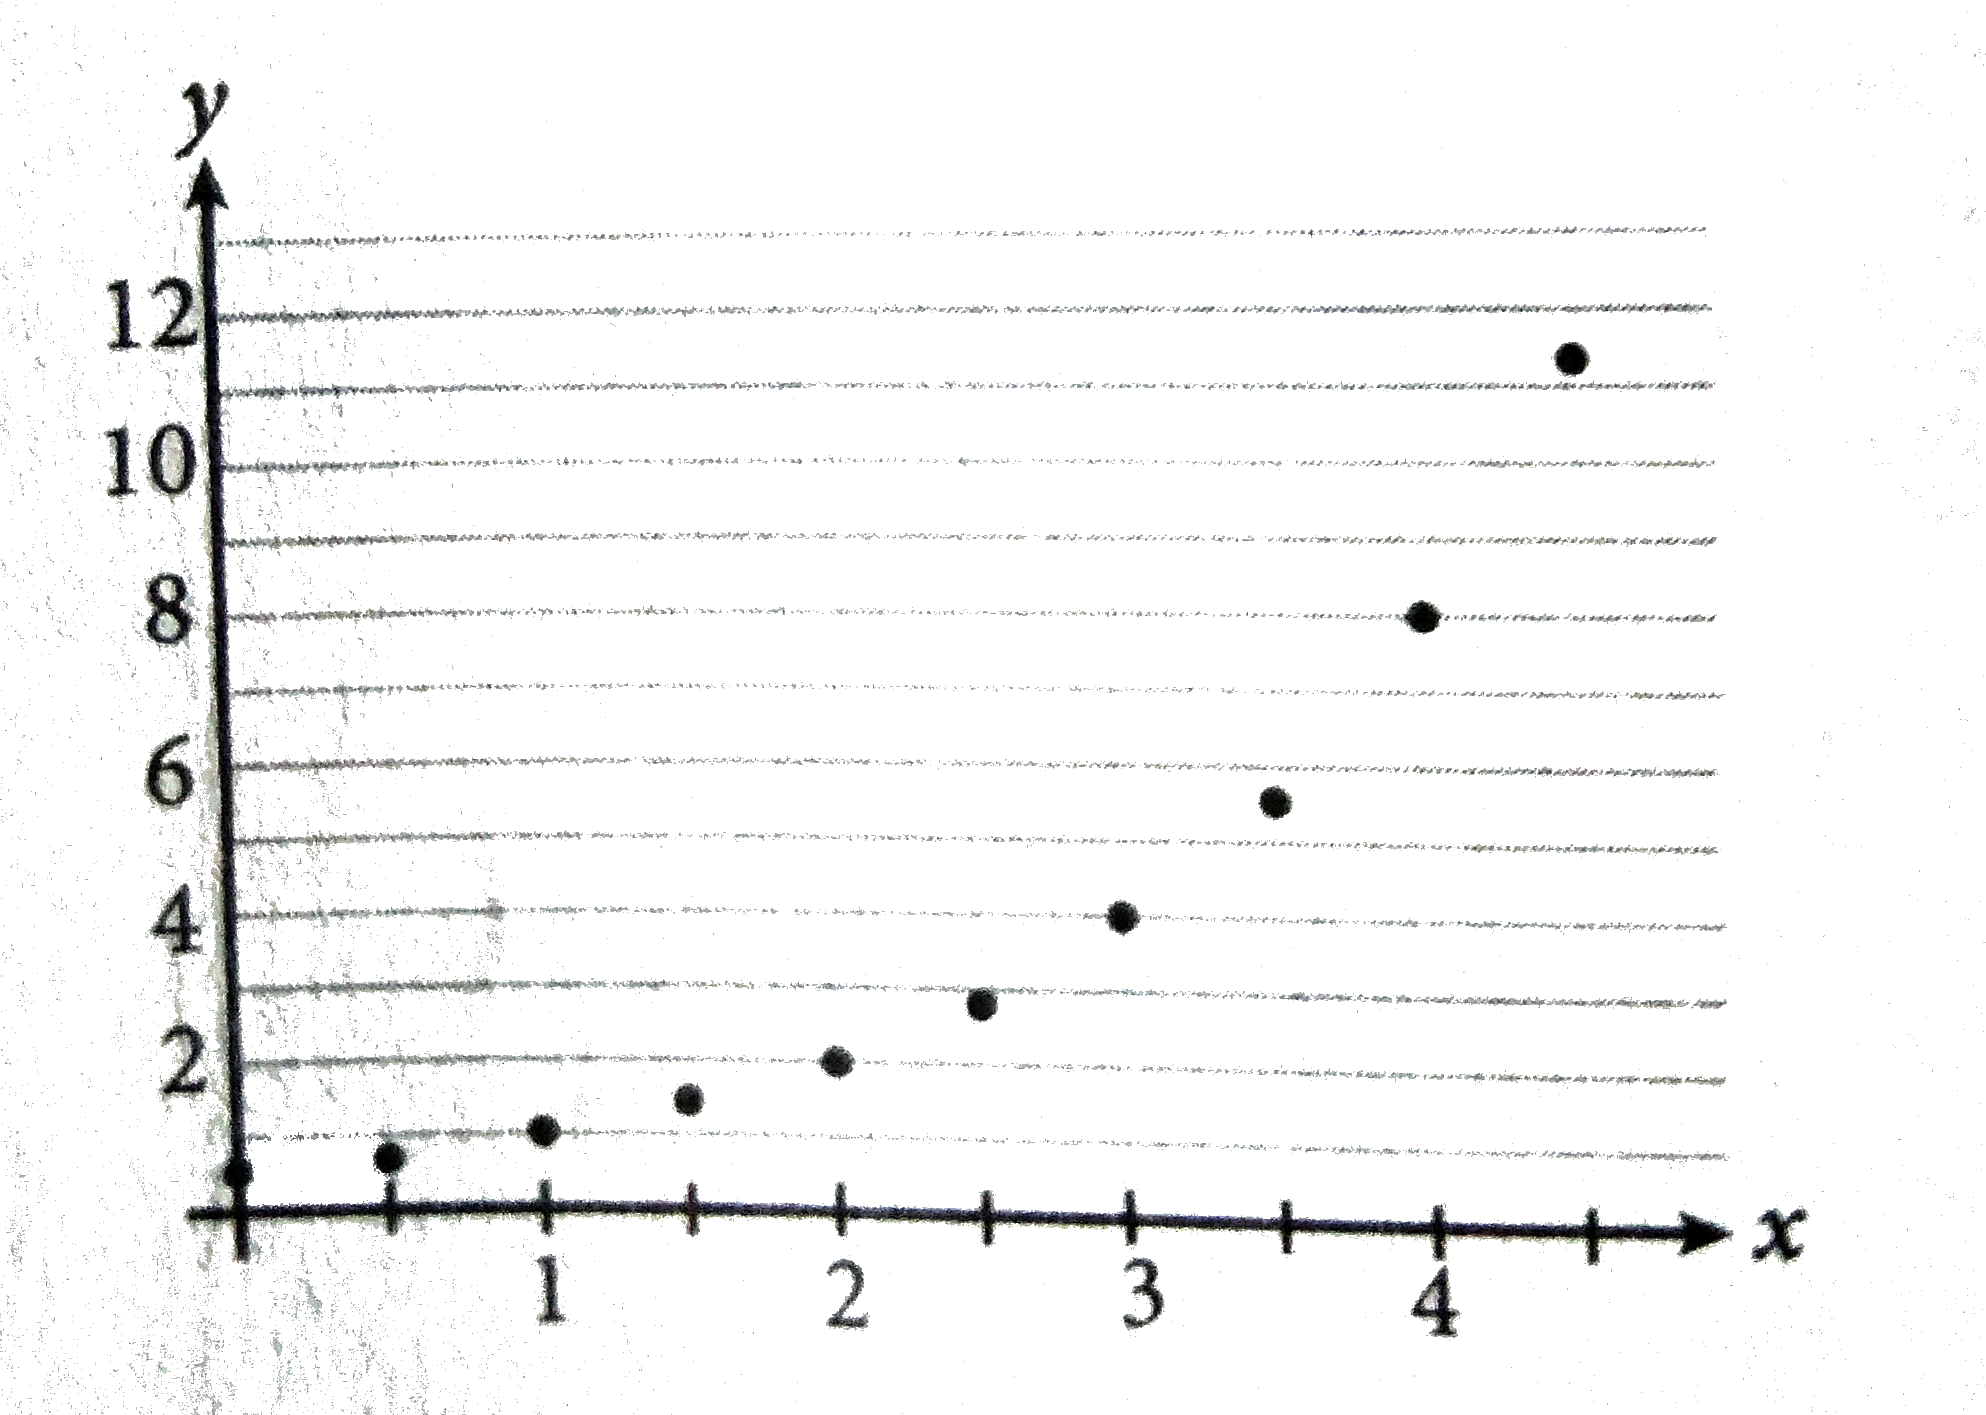
Which of the following equations best models the data shown in the scatterplot above?View Solution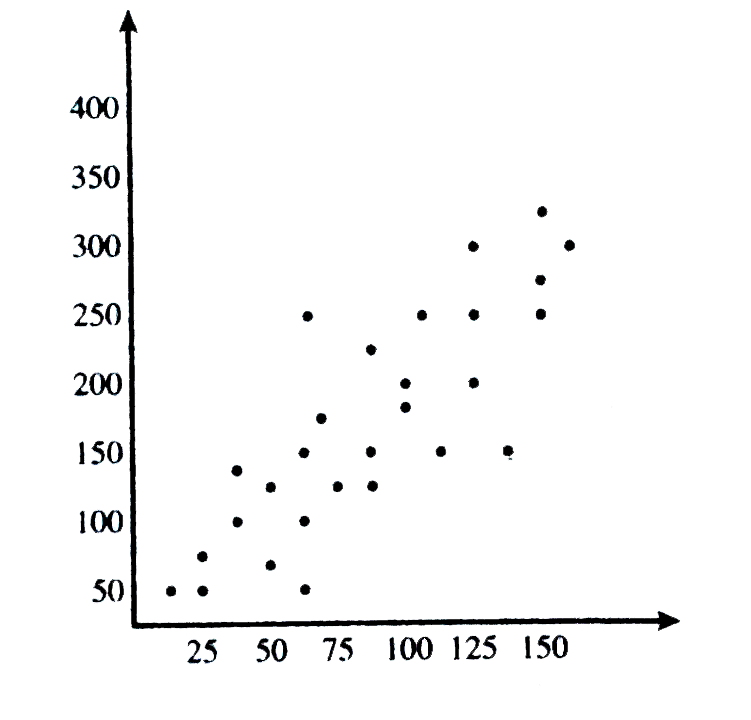
For the scatterplot above , which is closest to the slope of the line of best fit ?View Solution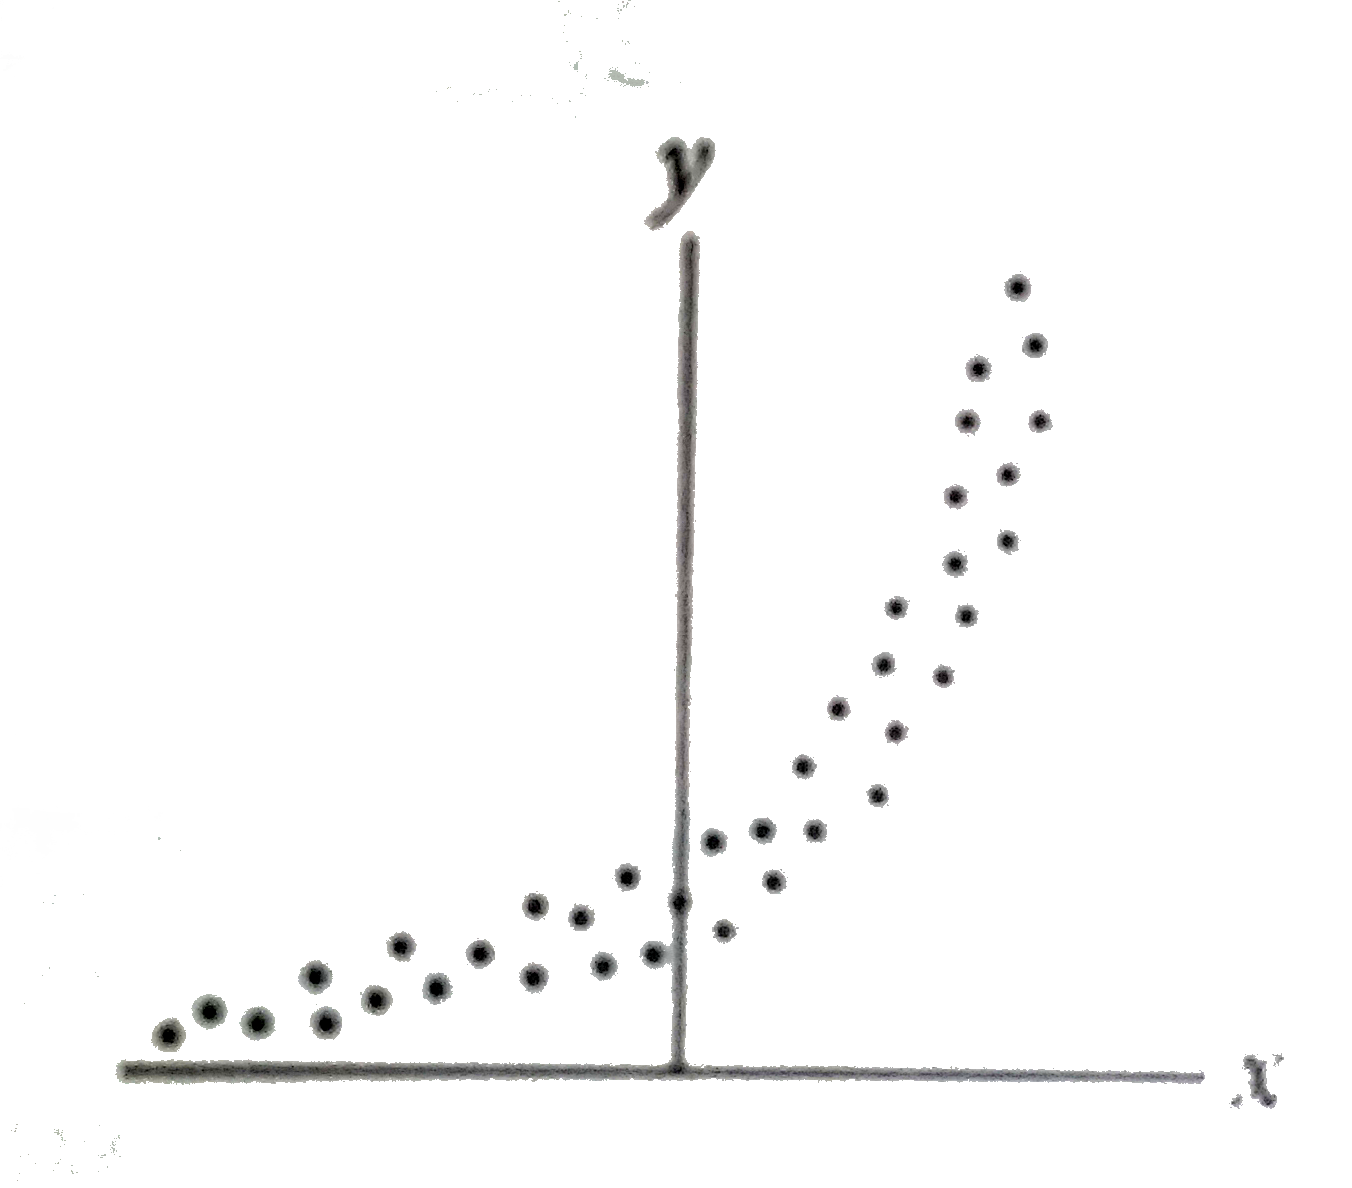
Which of the following best describes the type of association shown in the scatterplot above?View SolutionWhich description fit the following sugar best ?
 View Solution
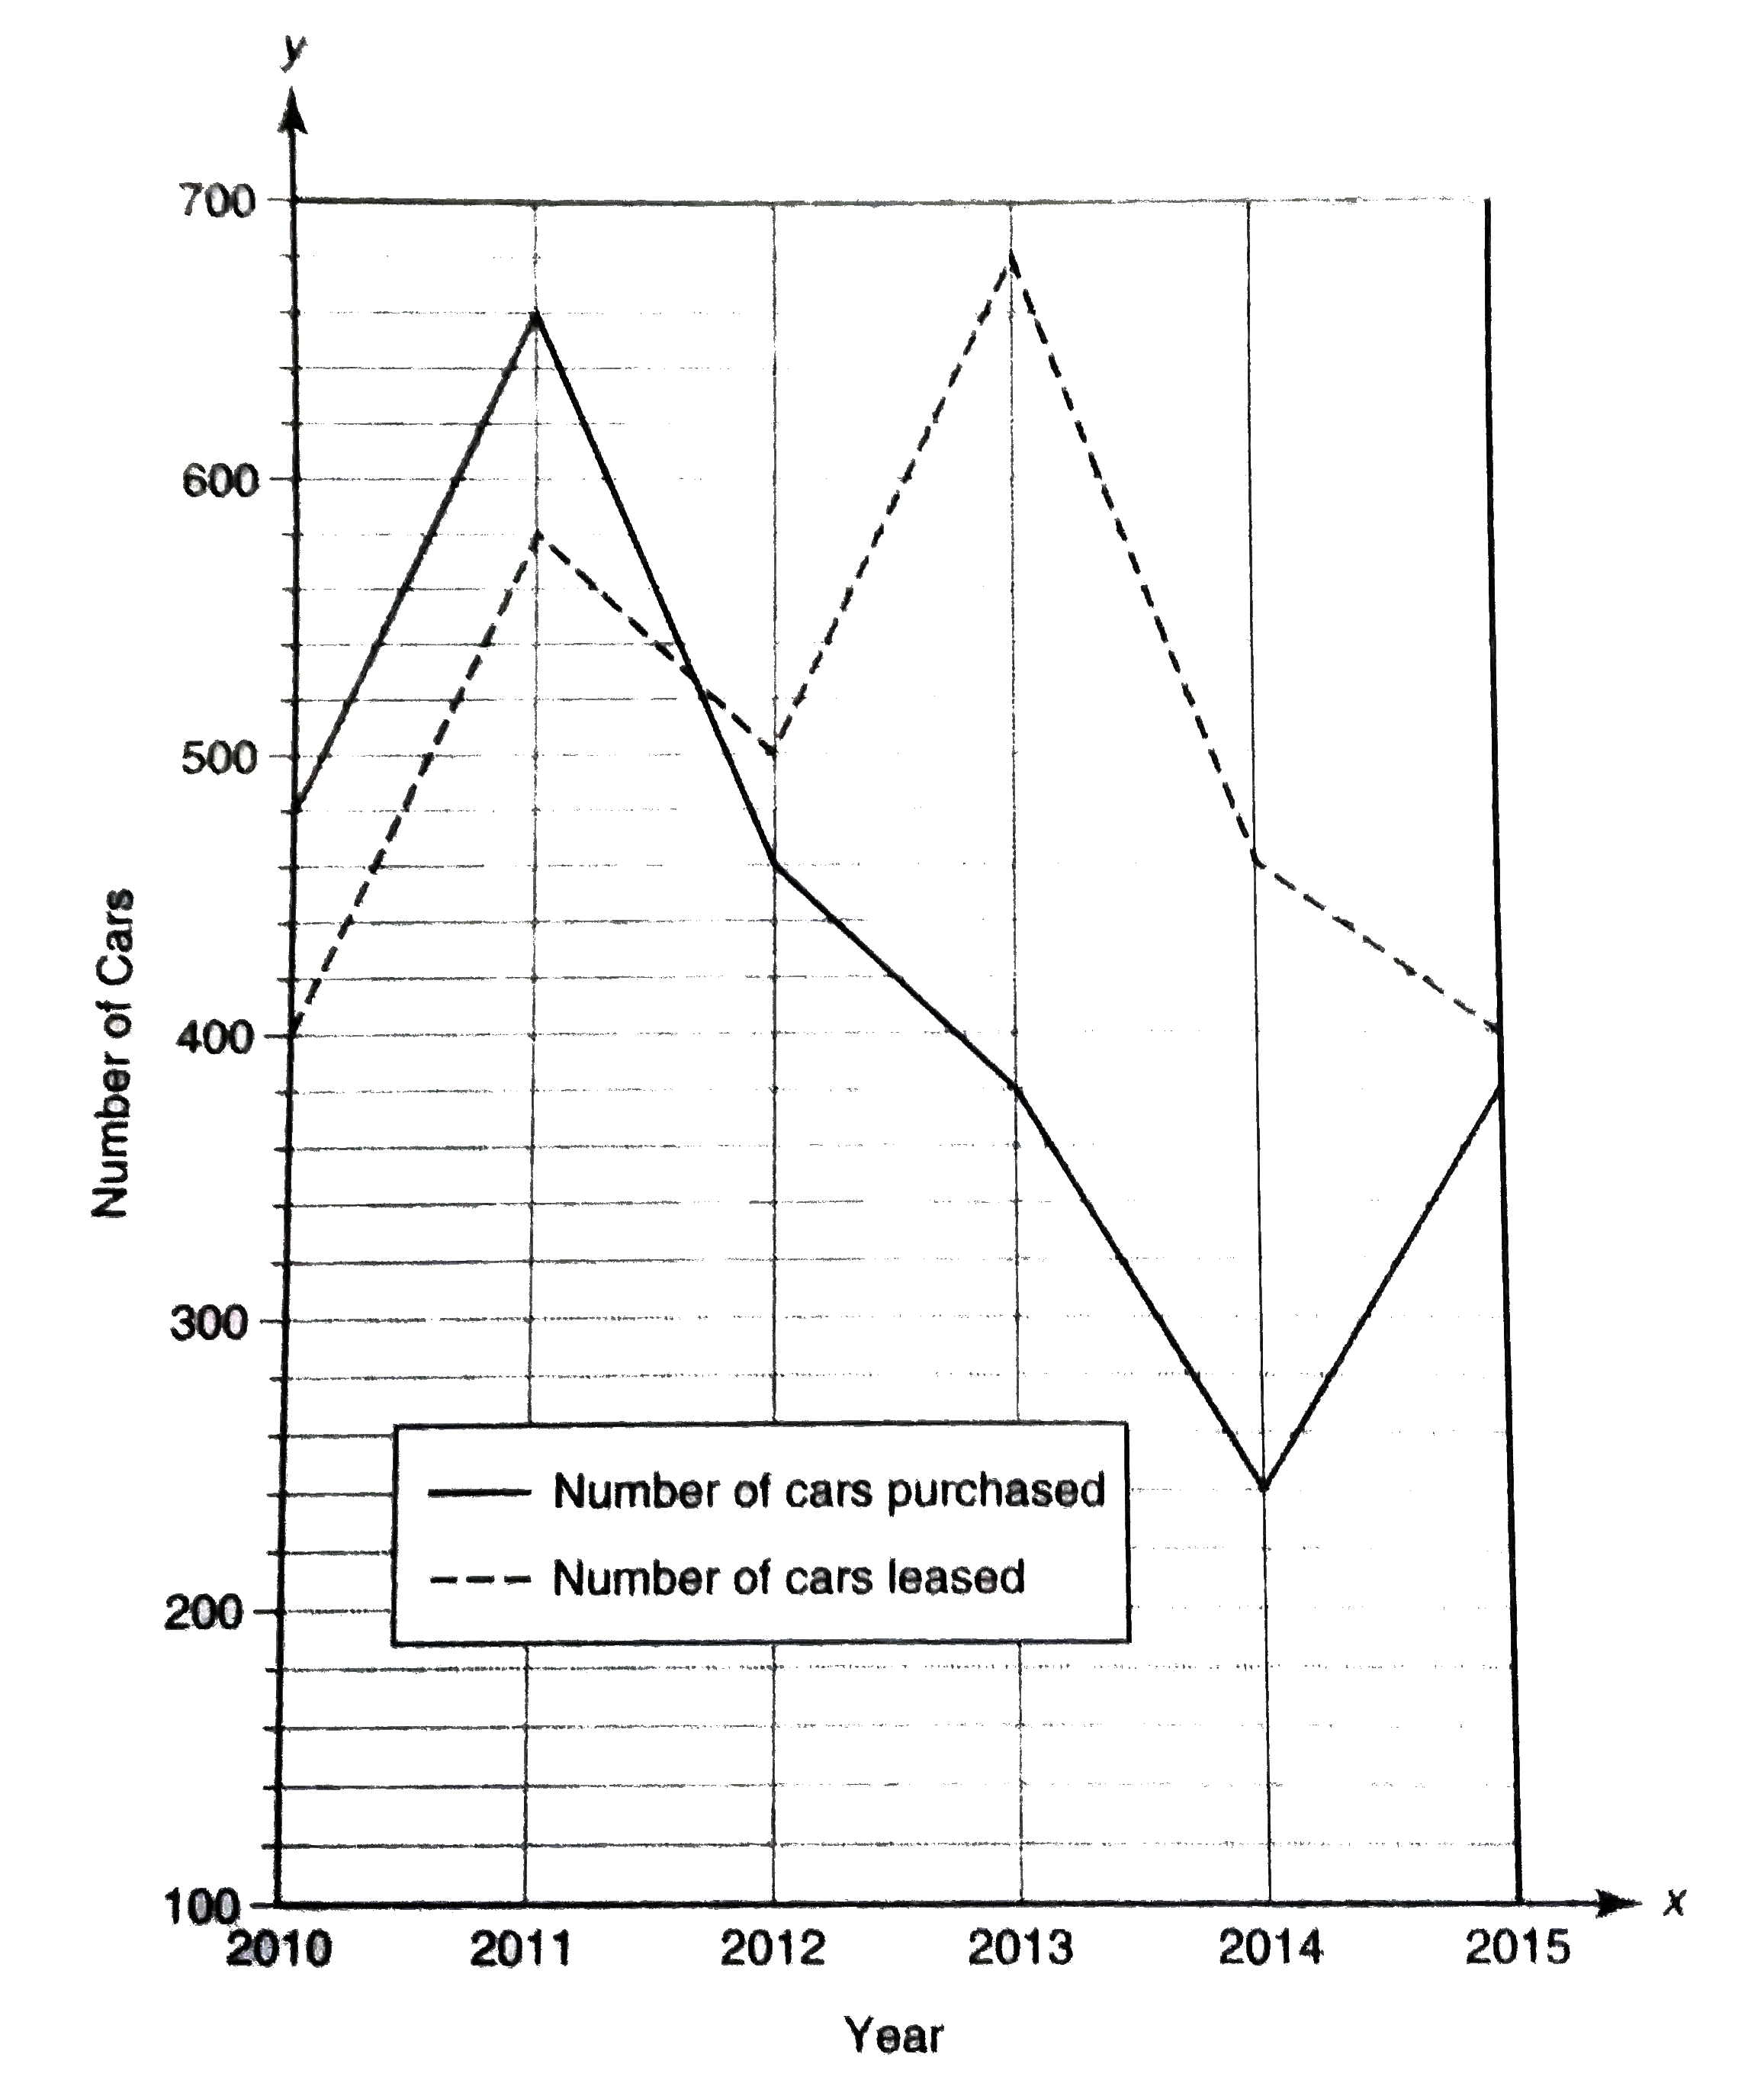
Question 11 and 12 refer to the gaph above.
Q. Which of the following is the best approximation for the decrease in the number of cars purchased per year between 2011 and 2014?View SolutionIn the 1990s, the park rangers at Yellowstone National park implemented a program aimed at increasing the dwindling coyote population in Montana. Results of studies of the coyote population in the park are shown in the scatterplot below.
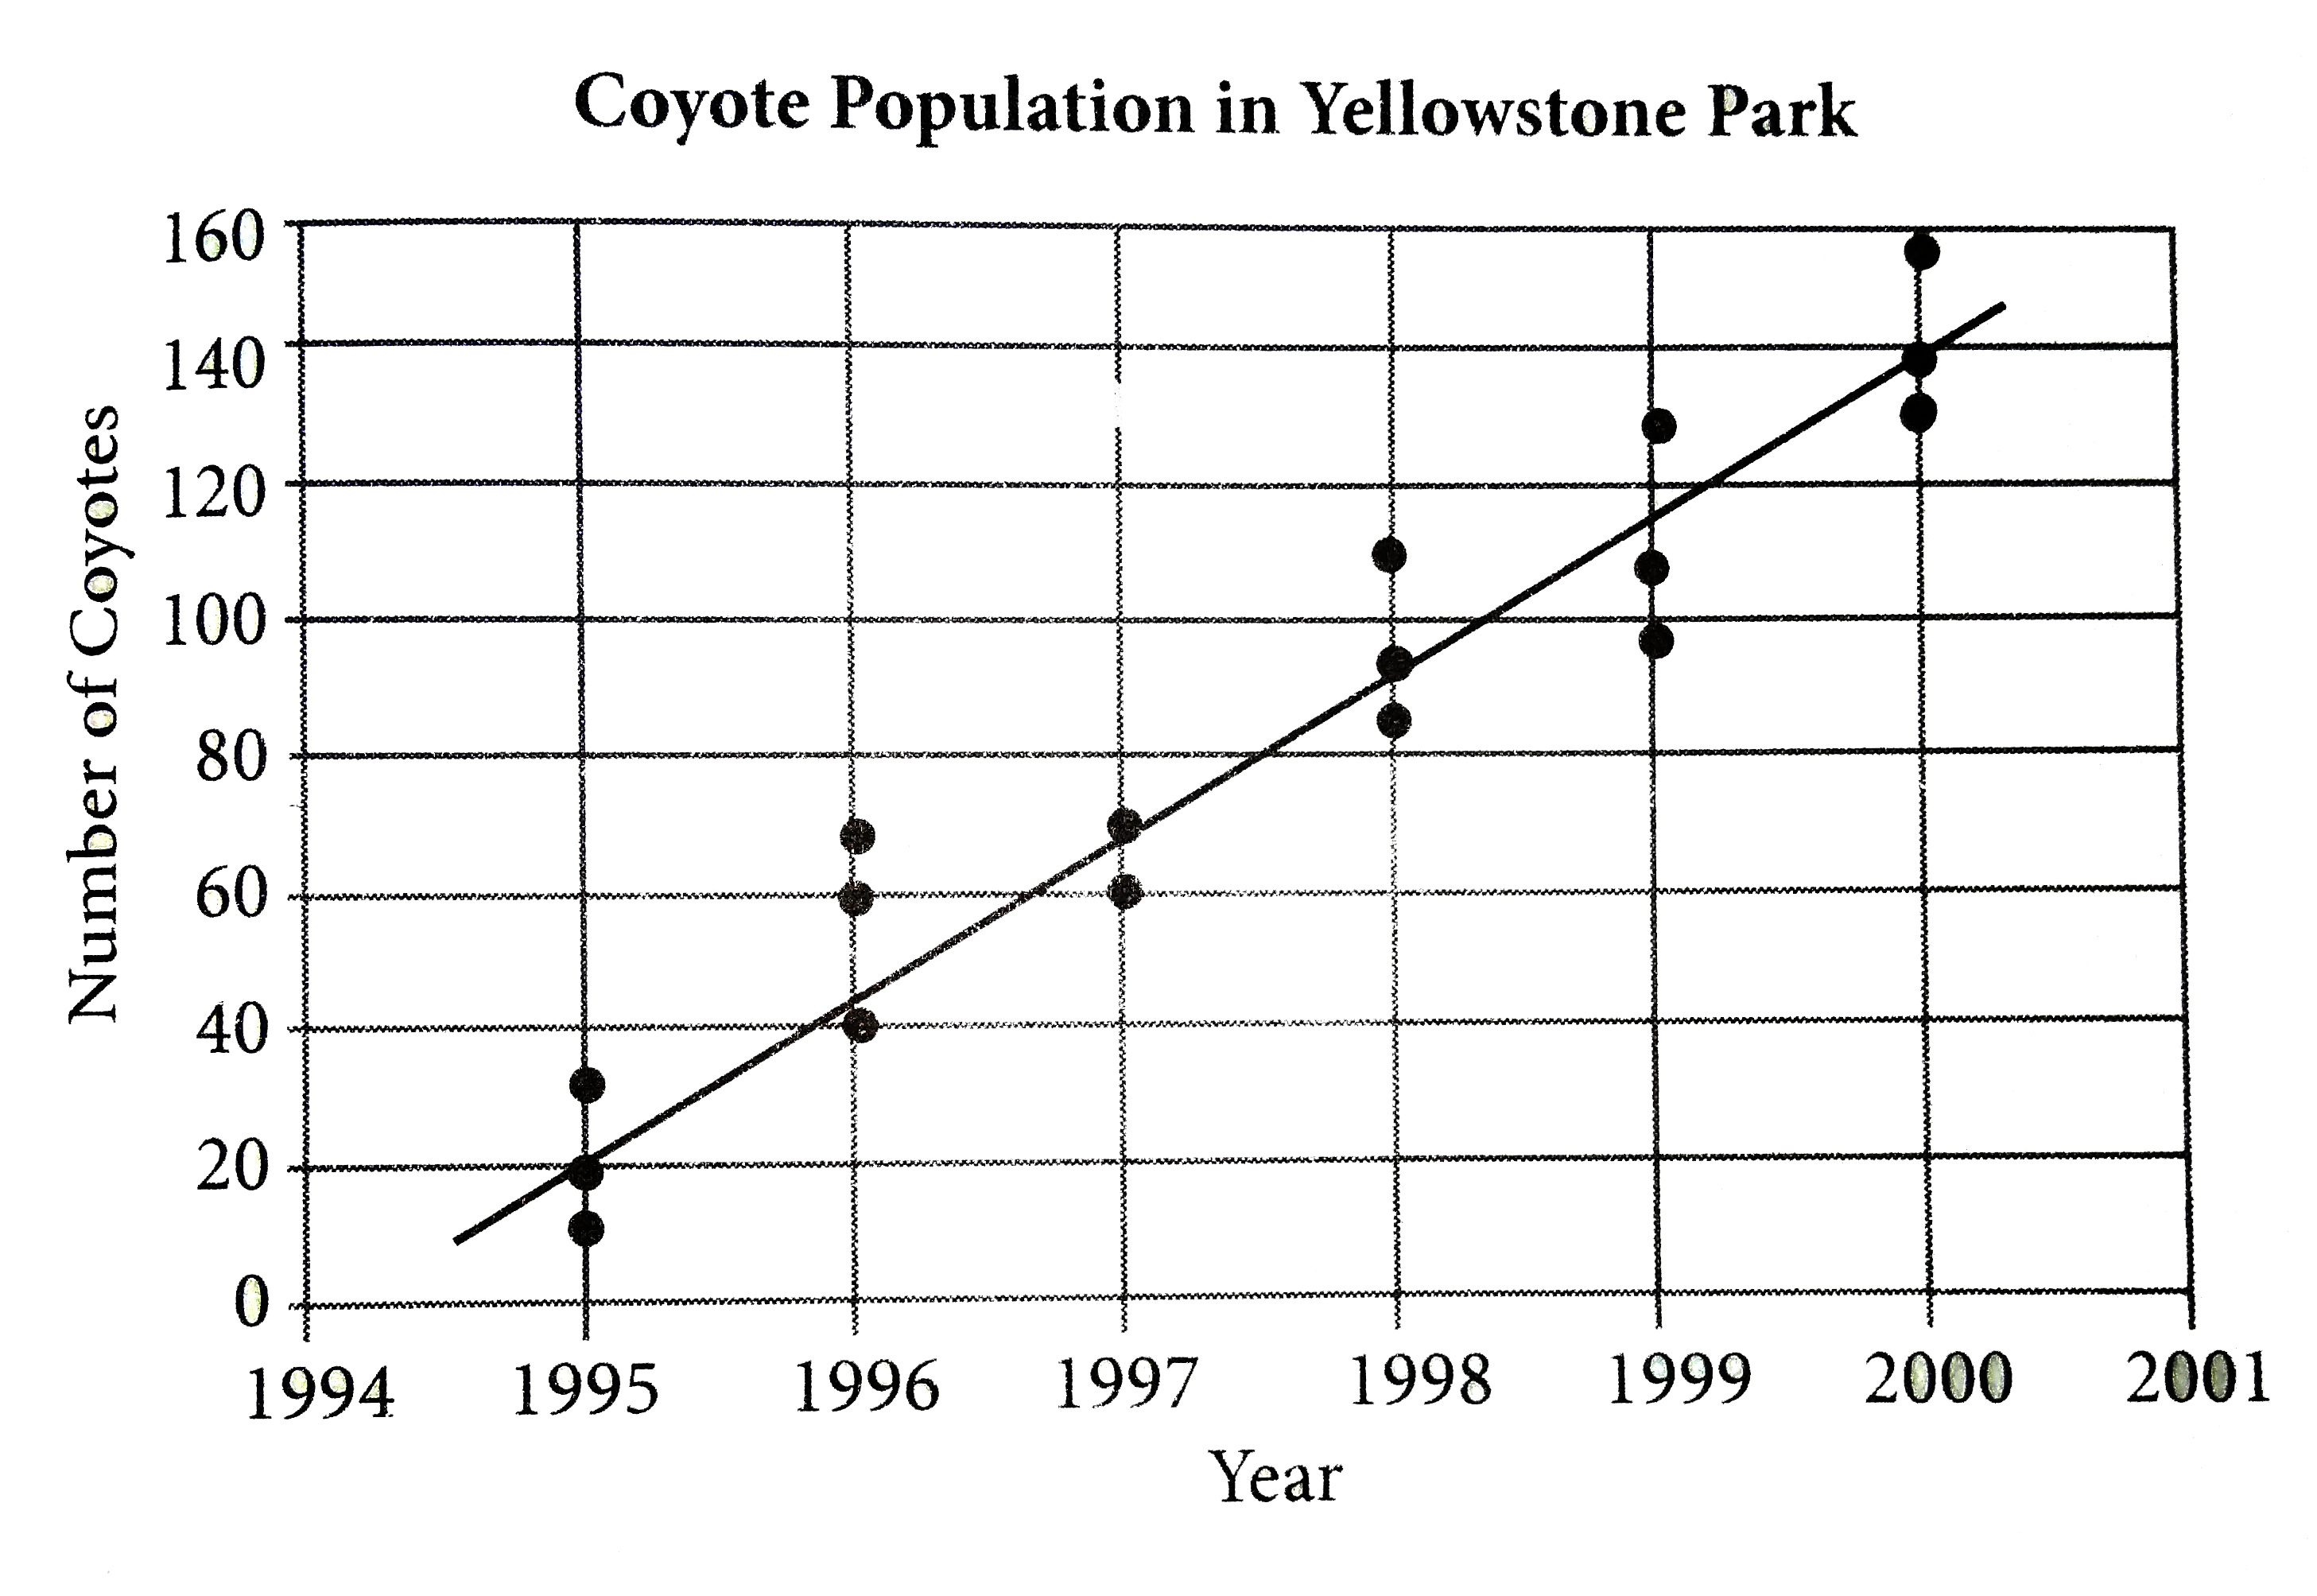
Based on the line of best fit in the scatterplot above, which of the following is the closest to the average annual increase in coyotes in Yellowstone Park between 1995 and 2000?View SolutionIn the 1990s, the park rangers at Yellowstone National park implemented a program aimed at increasing the dwindling coyote population in Montana. Results of studies of the coyote population in the park are shown in the scatterplot below.
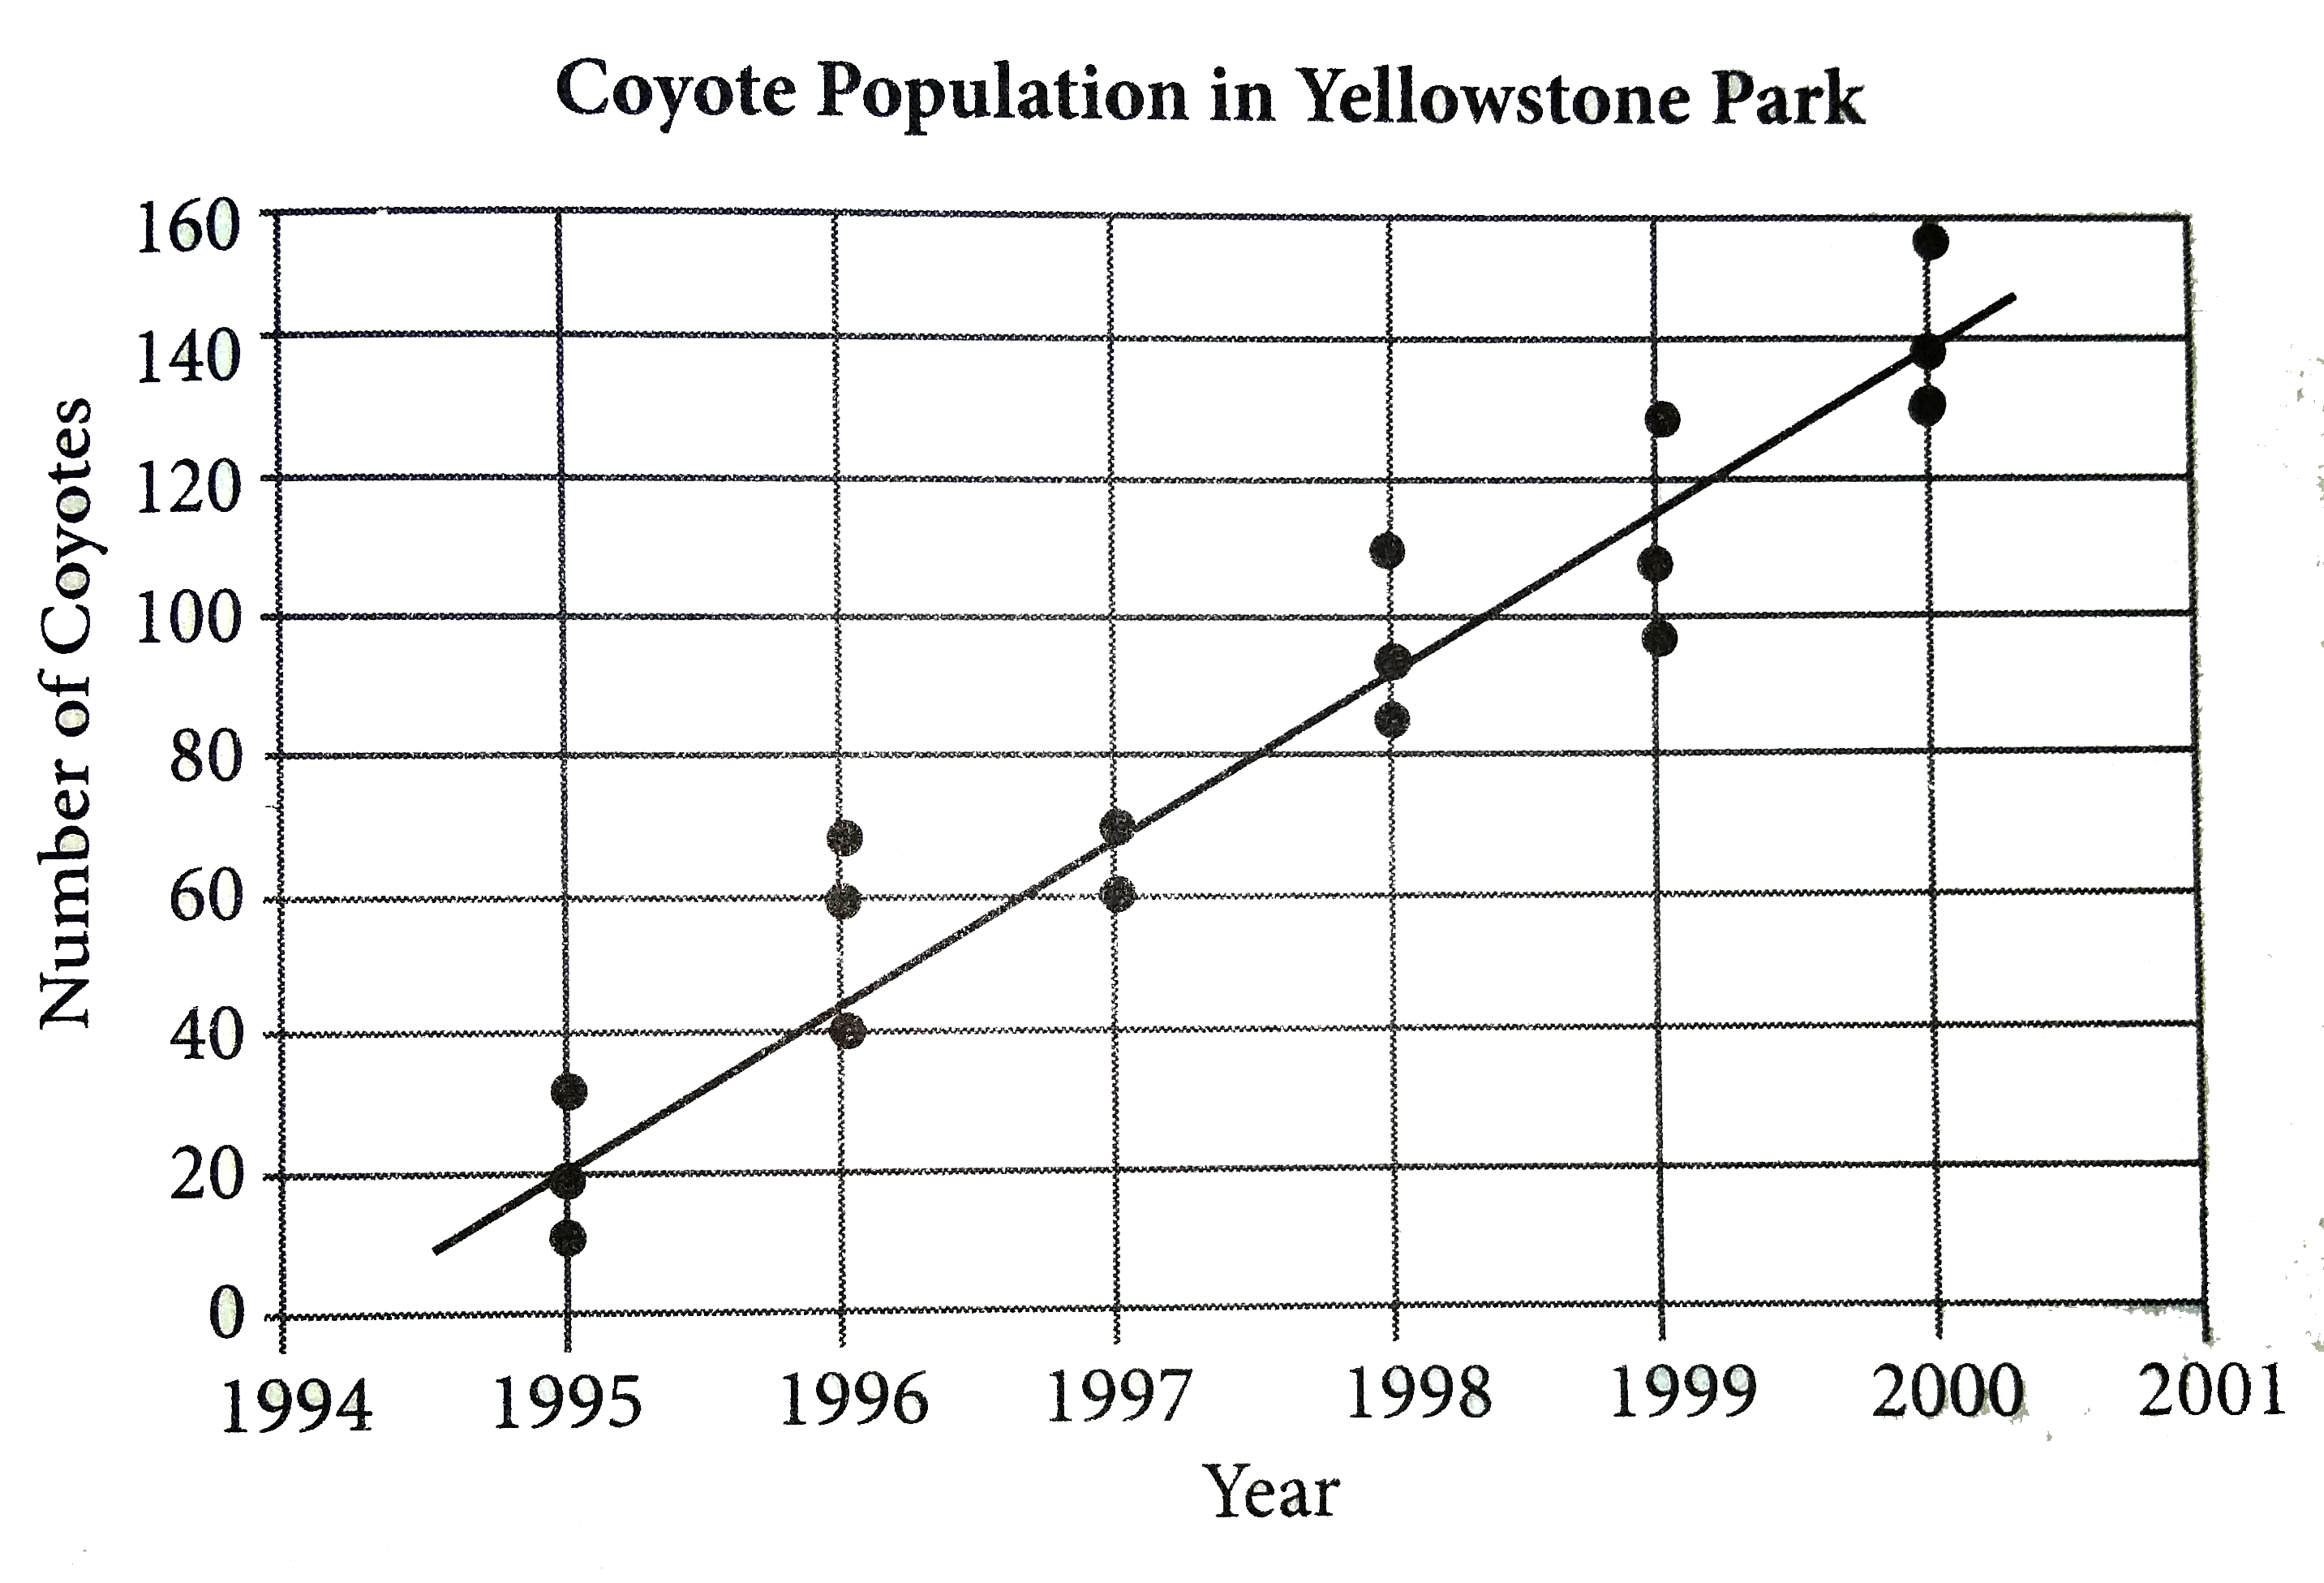
According to the data in the scatterplot, which of the following best represents the percent increase between the median of the results of the studies from 1995 and the median of the results of the studies from 1996?View Solution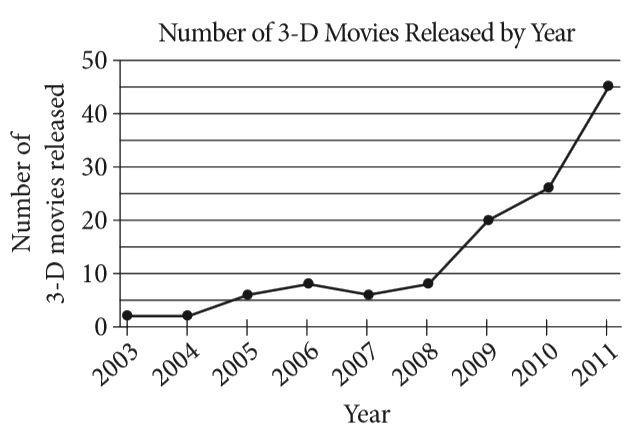
According to the line graph above, between which two consecutive years was there the greatest change in the number of 3 -D movies released?View Solution

