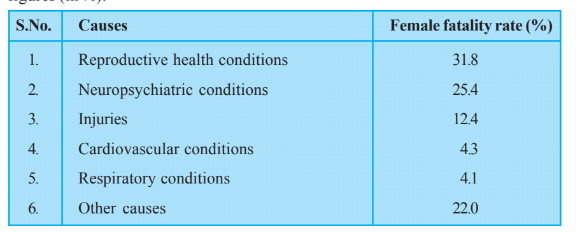
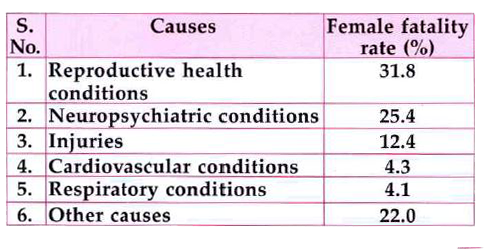
A survey conducted by an organization for the cause of illness and death among the women between the ages 15 - 44 (in years) worldwide, found the following figures (in %):

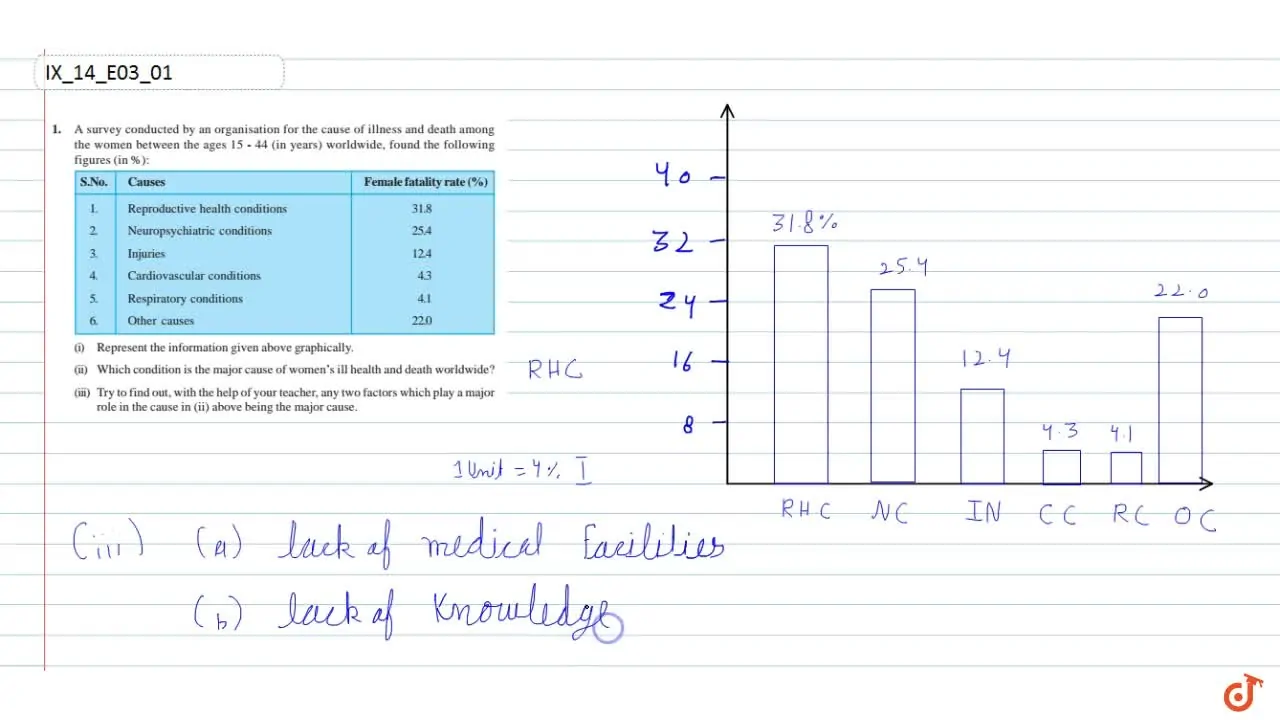
The given data can be represented by using a bar graph as shown below:
We will represent the causes on the x-axis, maintaining equal widths for all bars and with equal gaps in between. One cause will be represented by one bar.
We will represent the fatality rate on the y-axis with a scale of one unit as 5% as the max value is 31.8%.
Related Playlists
- BOOK - NCERTCHAPTER - STATISTICSEXERCISE - EXERCISE 14.12videos
STATISTICS
- BOOK - NCERTCHAPTER - STATISTICSEXERCISE - Exercise 14.29videos
STATISTICS
- BOOK - NCERTCHAPTER - QUADRILATERALSEXERCISE - SOLVED EXAMPLES8videos
QUADRILATERALS
- BOOK - NCERTCHAPTER - SURFACE AREAS AND VOLUMESEXERCISE - EXERCISE 13.810videos
SURFACE AREAS AND VOLUMES
Similar Questions
A survey conducted by an organisation for the cause of illness and death among the women between the ages 15-44 (in years) worldwide, found the following figures (in %) :
Which condition is the major cause of women's ill health and death worldwide?View SolutionA survey conducted by an organization for the cause of illness and death among the women between the ages 15 - 44 (in years) worldwide, found the following figures (in %):
 View Solution
A survey conducted by an organisation for the cause of illness and death among the women between the ages 15-44 (in years) worldwide, found the following figures (in %) :

Represent the information given above graphically.View SolutionStudy the following information carefully and answer the given questions.
Six persons i.e. M, N, O, P, Q and R who all are sitting around a hexagonal table facing towards the center. They all are of different height and weight such that the one who is the tallest is not the lightest among all. They all are of different age i.e. 14, 22, 28, 30, 35 and 60 but not necessarily in the same order.
The one who is the heaviest among all sits third to the right of N, who is 60 years of age. The one who is twice the age of Q is the third lightest among all. The one who is 35 years of age is the second tallest, who sits second to the right of Q, who is not the immediate neighbour of N. Only one person sits between N and the one who is the third heaviest among all, who is 14 years of age. The one who is younger than Q is not the lightest. Q is shorter than only two people. O's age is half the age of M. M sits third to the right of the one who is the shortest in height among all. The one who is older than P is taller than Q. The one who is 30 years old is the heaviest among all. The one who sits opposite to R is the second heaviest among all. R sits second to the right P. M is taller than the one who is 14 years old.
Who among the following is the shortest person in this group?View SolutionAn insurance company selected 2000 drivers at random in a particular city to find a relationship between age and accidents. The obtained are given in the following table: Age of Drivers (in years) Accidents in one year 0 1 2 3 over 3 18-29 30-50 above 50 440 505 360 160 125 45 110 60 35 61 22 15 35 18 9 Find the probability of the following events for a driver chosen at random from the life city: being 18-29 years of age and having exactly 3 accidents in one year. being 30-50 years of age and having one or more accidents in a year. having no accidents in one year.
View SolutionStudy the following information carefully and answer the given questions.
Six persons i.e. M, N, O, P, Q and R who all are sitting around a hexagonal table facing towards the center. They all are of different height and weight such that the one who is the tallest is not the lightest among all. They all are of different age i.e. 14, 22, 28, 30, 35 and 60 but not necessarily in the same order.
The one who is the heaviest among all sits third to the right of N, who is 60 years of age. The one who is twice the age of Q is the third lightest among all. The one who is 35 years of age is the second tallest, who sits second to the right of Q, who is not the immediate neighbour of N. Only one person sits between N and the one who is the third heaviest among all, who is 14 years of age. The one who is younger than Q is not the lightest. Q is shorter than only two people. O's age is half the age of M. M sits third to the right of the one who is the shortest in height among all. The one who is older than P is taller than Q. The one who is 30 years old is the heaviest among all. The one who sits opposite to R is the second heaviest among all. R sits second to the right P. M is taller than the one who is 14 years old.
Who among the following faces P?View SolutionStudy the following information carefully and answer the given questions.
Six persons i.e. M, N, O, P, Q and R who all are sitting around a hexagonal table facing towards the center. They all are of different height and weight such that the one who is the tallest is not the lightest among all. They all are of different age i.e. 14, 22, 28, 30, 35 and 60 but not necessarily in the same order.
The one who is the heaviest among all sits third to the right of N, who is 60 years of age. The one who is twice the age of Q is the third lightest among all. The one who is 35 years of age is the second tallest, who sits second to the right of Q, who is not the immediate neighbour of N. Only one person sits between N and the one who is the third heaviest among all, who is 14 years of age. The one who is younger than Q is not the lightest. Q is shorter than only two people. O's age is half the age of M. M sits third to the right of the one who is the shortest in height among all. The one who is older than P is taller than Q. The one who is 30 years old is the heaviest among all. The one who sits opposite to R is the second heaviest among all. R sits second to the right P. M is taller than the one who is 14 years old.
Four of the following five are alike in a certain way and hence form a group . Find the one that does not belong to the group.View SolutionRead the following text and answer the following questions on the basis of the same:
The term sexually transmitted disease (STD) is applied to the group of diseases that spread by sexual contact. Some infections like hepatitis-B and HIV can spread by sharing injection needles, surgical instruments etc. Except for hepatitis B, HIV infections, genital herpes, most of the STDs are completely curable if detected early and treated properly. Though all persons are vulnerable to these infections, their incidences are high in the age group of 15-24 years.
Which among the following is a venereal disease, caused by a virus, which also gets transmitted by blood contact ?View SolutionThe question below consists of a set of labelled sentences. These sentences, when properly sequenced form a coherent paragraph. Select the most logical order of sentences from among the options.
P: Modern medicine has scored significant victories against both, and the major causes of ill health and death are now the chronic degenerative diseases, such as coronary artery disease, arthritis, osteoporosis, Alzheimer's, macular degeneration, cataract and cancer.
Q: It follows that the majority of apparently healthy people are pre-ill.
R: Throughout human history the leading causes of death have been infection and trauma.
S: These have a long latency period before symptoms appear and a diagnosis is made.View SolutionThe questions below consist of a set of labelled sentences. These sentences, when properly sequenced form a coherent paragraph. Select the most logical order of sentences from among the options.
P: Modern medicine has scored significant victories against both, and the major causes of ill health and death are now the chronic degenerative diseases, such as coronary artery disease, arthritis, osteoporosis, Alzheimer.s, macular degeneration, cataract and cancer.
Q: It follows that the majority of apparently healthy people are pre-ill.
R: Throughout human history the leading causes of death have been infection and trauma.
S: These have a long latency period before symptoms appear and a diagnosis is made.View Solution


