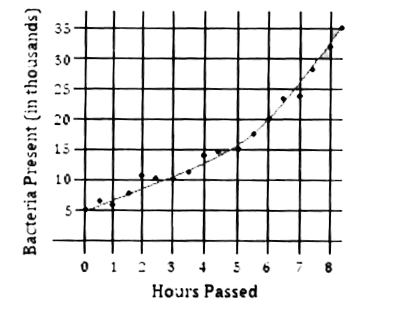
A biologist places a colony consisting of 5000 bacteria into a petri dish. After the intial placement of the bacteria at time t = 0, the biologist measures and estimates the number of bacteria present every half hour. This data was then fitted by an exponential curve of the form y=c.2kt where c and k are constants, t is measured in hours, and y is measured in thousands of bacteria. The scatterplot together with the exponential curve are shown below.

Suppose that the data was fitted with a quadratic function of the form t2+bt+c instead of an exponential function. Assume that the quadratic funtion agrees with the scatterplot at times t = 0 and t = 6. What is the t - coordinate of the vertex of the graph of the quadratic function?
The correct Answer is:74or1.75.
Similar Questions
A biologist places a colony consisting of 5000 bacteria into a petri dish. After the intial placement of the bacteria at time t = 0, the biologist measures and estimates the number of bacteria present every half hour. This data was then fitted by an exponential curve of the form y=c.2kt where c and k are constants, t is measured in hours, and y is measured in thousands of bacteria. The scatterplot together with the exponential curve are shown below.

According to the scatterplot, the biologist'smeasurements indicate that the number of bacteria present quadrupled in 6 hours, and the exponential curve passes through the corresponding data point at time t = 6. The exponential function also agrees with the initial number of bacteria. Compute ck.View SolutionThe population of a bacteria culture doubles in number every 12 minutes. The ratio of the number of bacteria at the end of 1 hour to the number of bacteria at the beginning of that hour is
View SolutionThe growth of bacteria is measured by
View SolutionRate of growth of bacteria is proportional to number of bacteria present at that time. If x is the number of bacteria present at any instant t, then which one of the following is correct? (take proportional constant equal to 1)
View SolutionThe rate of increase of the bacteria in a culture is proportional to the number of bacteria present and it is found that the number doubles in 6 hours. Prove that the bacteria becomes 8 times at the end of 18 hours.
View SolutionA population of bacteria doubles every 2 hours. What is the percent increase after 4 hours ?
View SolutionA population of bacteria doubles every 2 hours . What is the percent increase after 4 hours ?
View SolutionRate of growth of baster is proportional to the number of bacteria present at that time. If x is the number of bacteria present any instant t, then which one of the following is correct ?(take proportional constant equal to 1)
View SolutionThe rate of growth of bacteria is proportional to the number present . If initially, there were 1000 bacteria and the number doubles in 1 hours. Find the number of bacteria after 212 hours . [ take √2=1.414]
View SolutionThe rate of increase of the bacteria in a culture is proportional to the number of bacteria present and it is found that the number doubles in 6 hours. Prove that the bacteria becomes 8 times at the end of 18 hours.
View Solution

