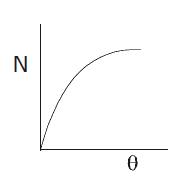
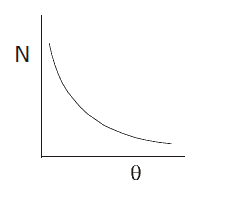
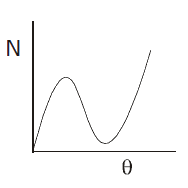
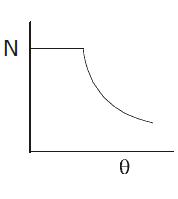
Which of the following may be representing graph between number of scattered particles detected (N) and sacttering angle (θ) in Rutherford's experiment?
A

B

C

D

Text Solution
The correct Answer is:B
|
Updated on:21/07/2023
Topper's Solved these Questions
- BOOK - MOTIONCHAPTER - ATOMIC STRUCTURE & X-RAY EXERCISE - Exercise - 231videos
ATOMIC STRUCTURE & X-RAY
- BOOK - MOTIONCHAPTER - ATOMIC STRUCTURE & X-RAY EXERCISE - QUESTIONS FOR PRACTICE12videos
ATOMIC STRUCTURE & X-RAY
- BOOK - MOTIONCHAPTER - ALTERNATING CURRENTEXERCISE - EXERCISE - 4 (LEVEL - II)14videos
ALTERNATING CURRENT
- BOOK - MOTIONCHAPTER - CALORIMETRY EXERCISE - EXERCISE - 3 Section - B4videos
CALORIMETRY
Similar Questions
Knowledge Check
- Question 1 - Select One
Which of the following may be representing graph between number of scattered particles detected (N) and scattering angle(θ) in Rutherford's experiment?
A B
B C
C D
D
- Question 2 - Select One
Which of the following conclusions regarding the structure of atom is based on Rutherford's α-particle scattering experiment?
AThe positive charge is concentrated in a very small volume of the atom.BThe positive charge is scattered with the electrons throughout the atom.CThe volume occupied by the nucleus is half of the volume of atom.DMost of the space in the atom is occupied by the neutrons. - Question 3 - Select One
Which of the following conclusions regarding the structure of atom is based on Rutherford's α-particle scattering experiment?
AThe positive charge is concentrated in a very small volume of the atom.BThe positive charge is scattered with the electrons throughout the atom.CThe volume occupied by the nucleus is half of the volume of atom.DMost of the space in the atom is occupied by the neutrons.
In the Rutherford scattering experiment the number of α particles scattered at anangle θ=60∘ is 12 per min. The number of α particles per minute when scattered at an angle of 90∘ are
View SolutionWhich of the following conclusions couldnot be derived from Rutehrford's α-particle scattering experiment?
View SolutionWhich of the following conclusions could not be derived from Rutherford's alpha-particle scattering experiments?
View SolutionIn the Rutherford scattering experiment the number of αparticles scattered at anangle θ=60∘ is 12 per min. The number of α particles per minute when scatterd at an angle of90∘ are
View SolutionFrom the α-particle scattering experiment, Rutherford conculded that
View Solution
