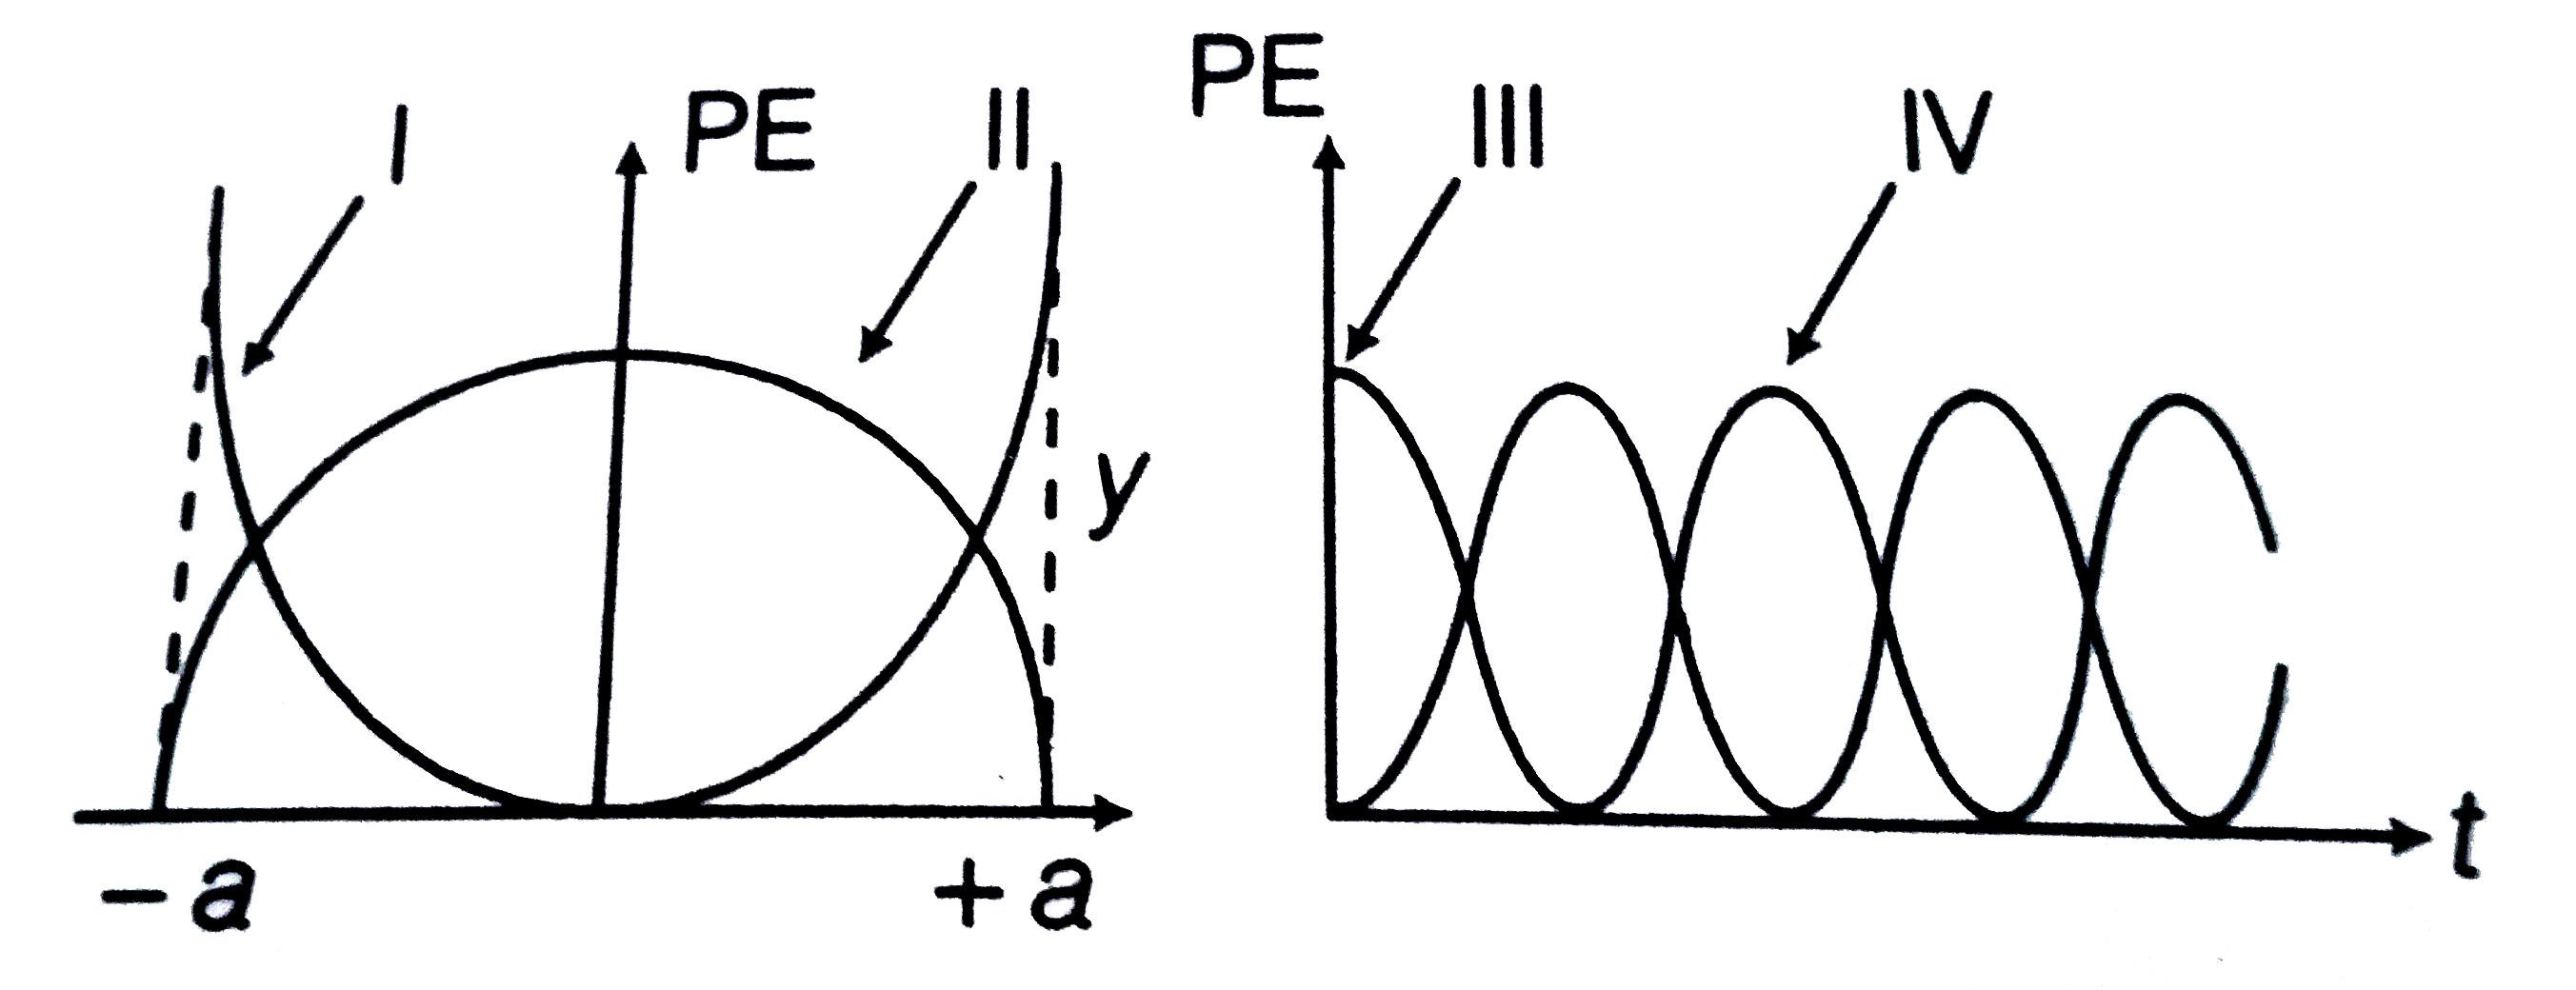
Which of the following graph represents the equation y-mx + C?
A

B

C

D

Text Solution
The correct Answer is:C
|
Topper's Solved these Questions
- KINEMATICSBook:FULL MARKSChapter:KINEMATICSExercise:ADDITIONAL QUESTIONS SOLVED (SHORT ANSWER QUESTIONS - 1 (2 MARKS))
Explore 20 Videos
- KINEMATICSBook:FULL MARKSChapter:KINEMATICSExercise:ADDITIONAL QUESTIONS SOLVED (NUMERICAL QUESTIONS)
Explore 42 Videos
- KINEMATICSBook:FULL MARKSChapter:KINEMATICSExercise:TEXTUAL QUESTIONS SOLVED (LONG ANSWER QUESTIONS)
Explore 14 Videos
- HEAT AND THERMODYNAMICSBook:FULL MARKSChapter:HEAT AND THERMODYNAMICSExercise:ADDITIONAL QUESTIONS SOLVED (Numerical Problems)
Explore 16 Videos
- KINETIC THEORY OF GASESBook:FULL MARKSChapter:KINETIC THEORY OF GASESExercise:Addtional Numerical Problems
Explore 10 Videos
Similar Questions
Knowledge Check
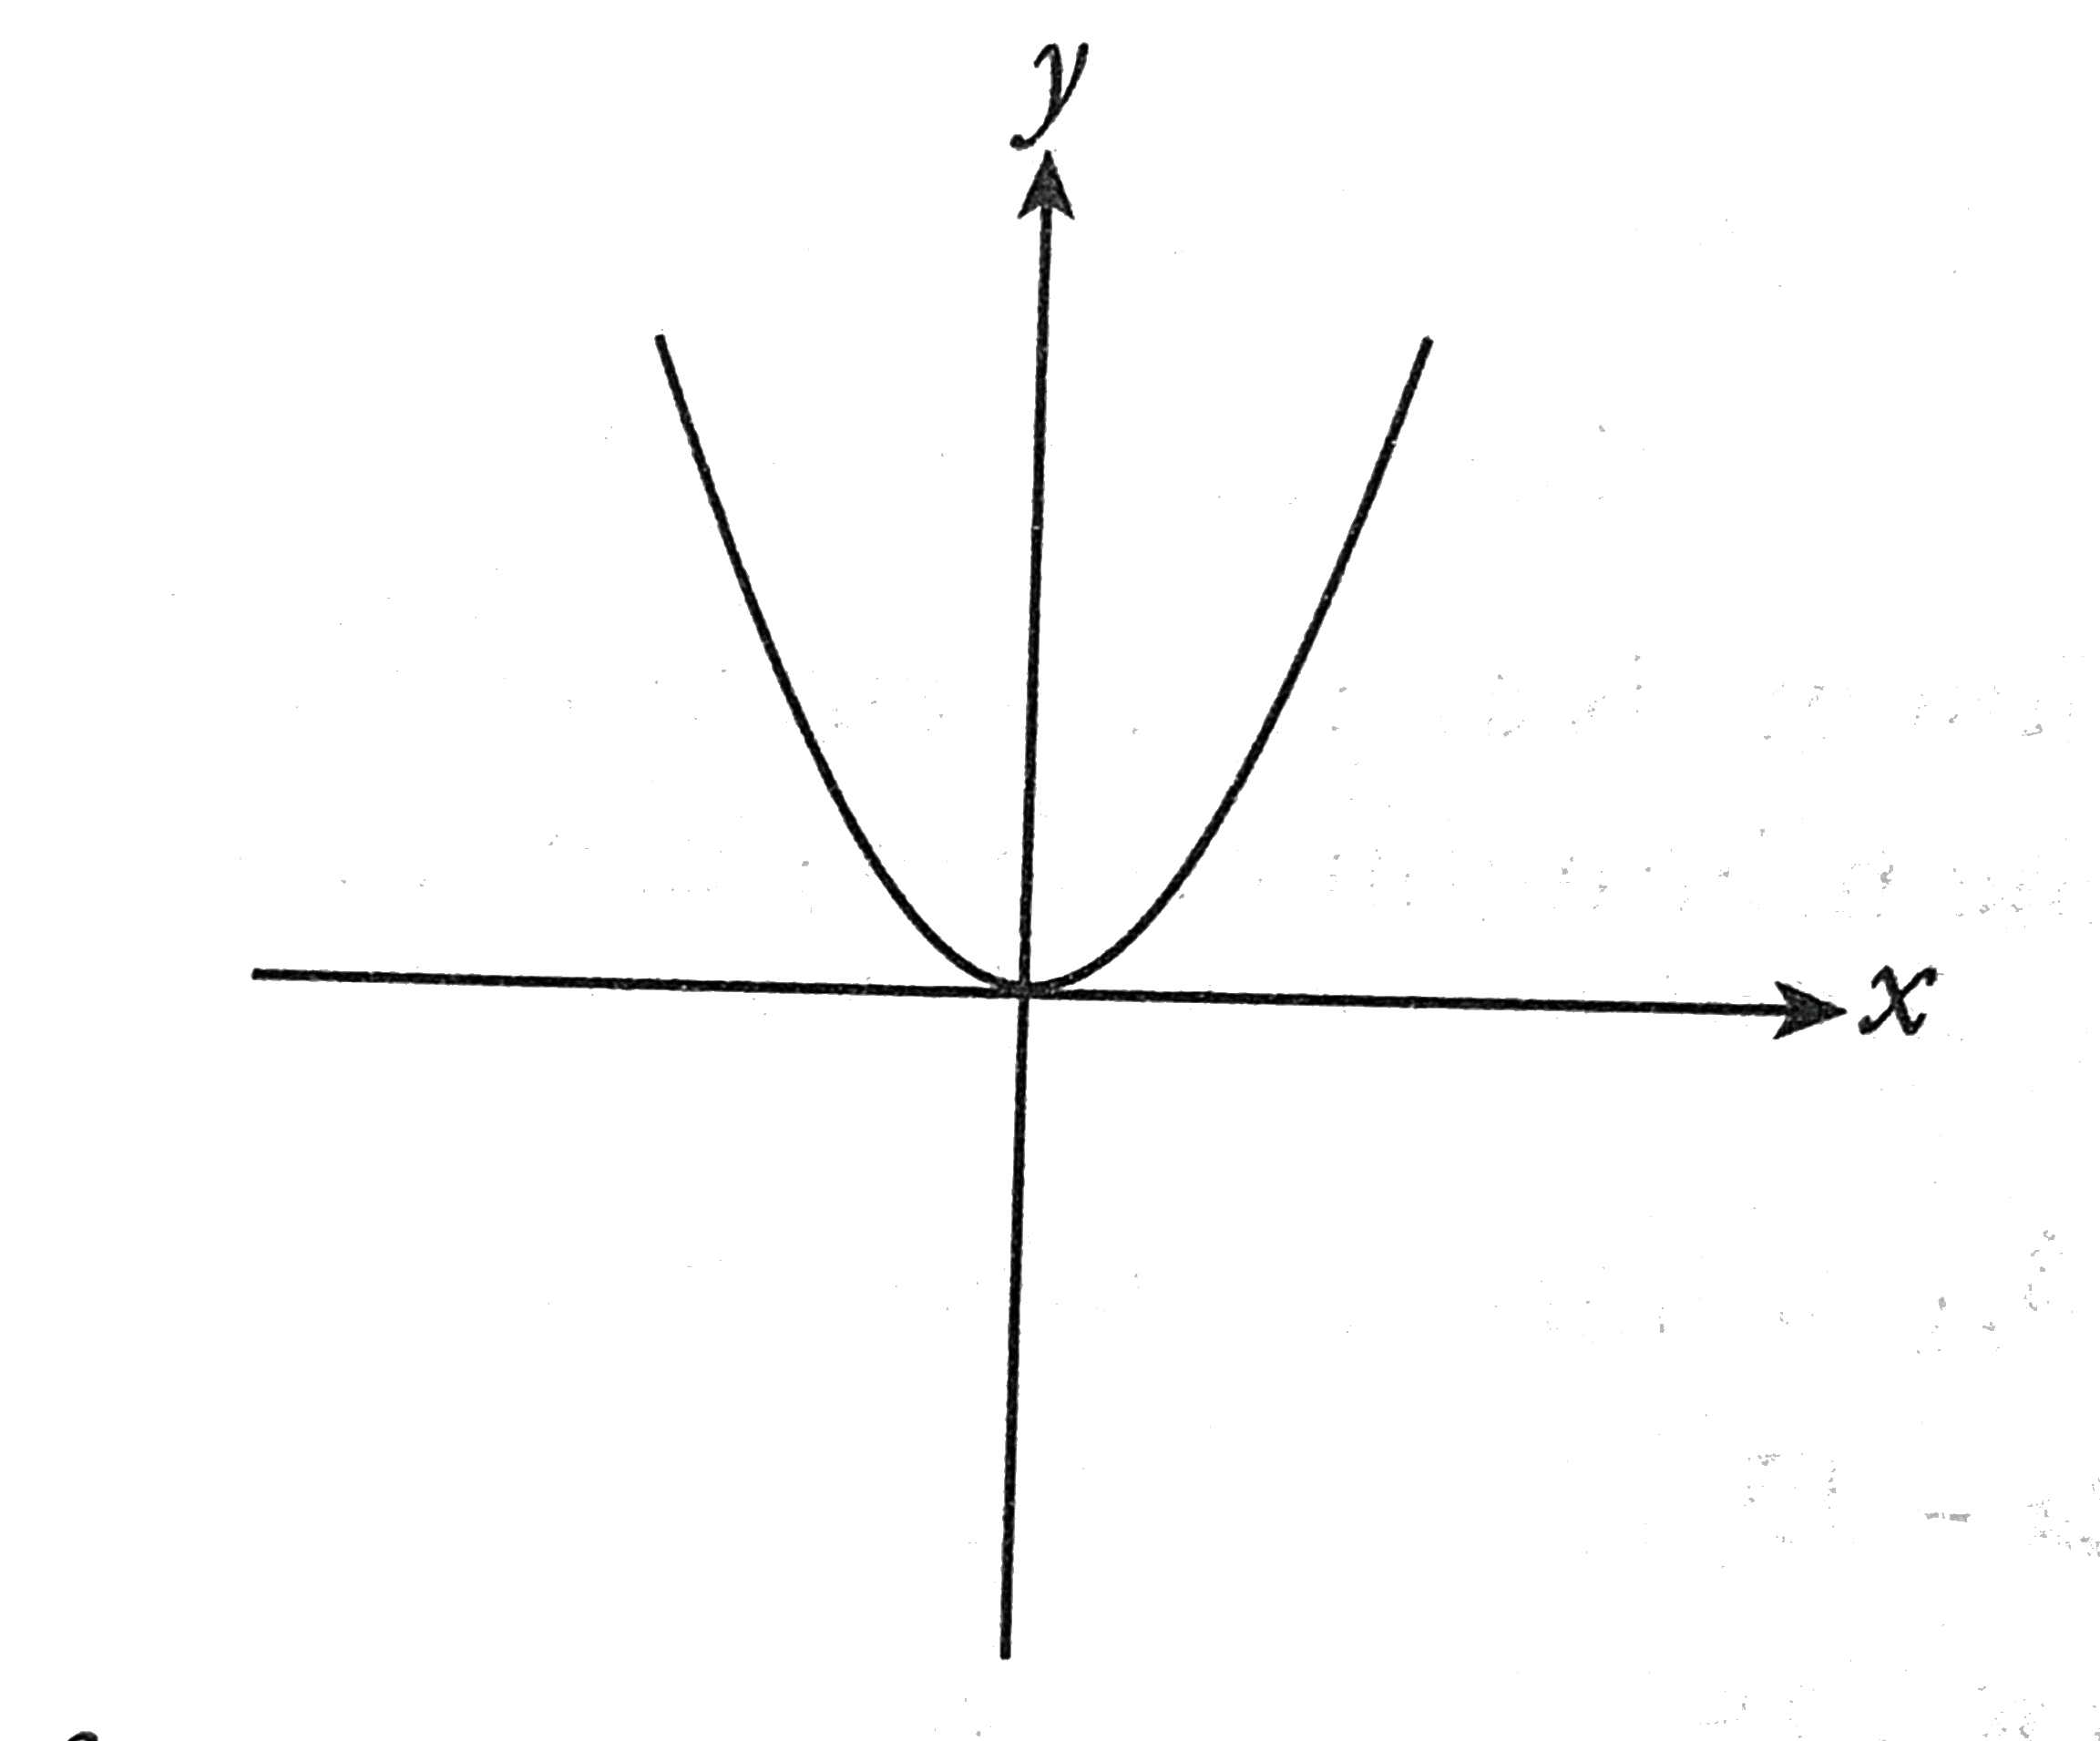
The quadratic y=f(x) is shown above. Which of the following graphs represents the function y=f(x+3)−4?A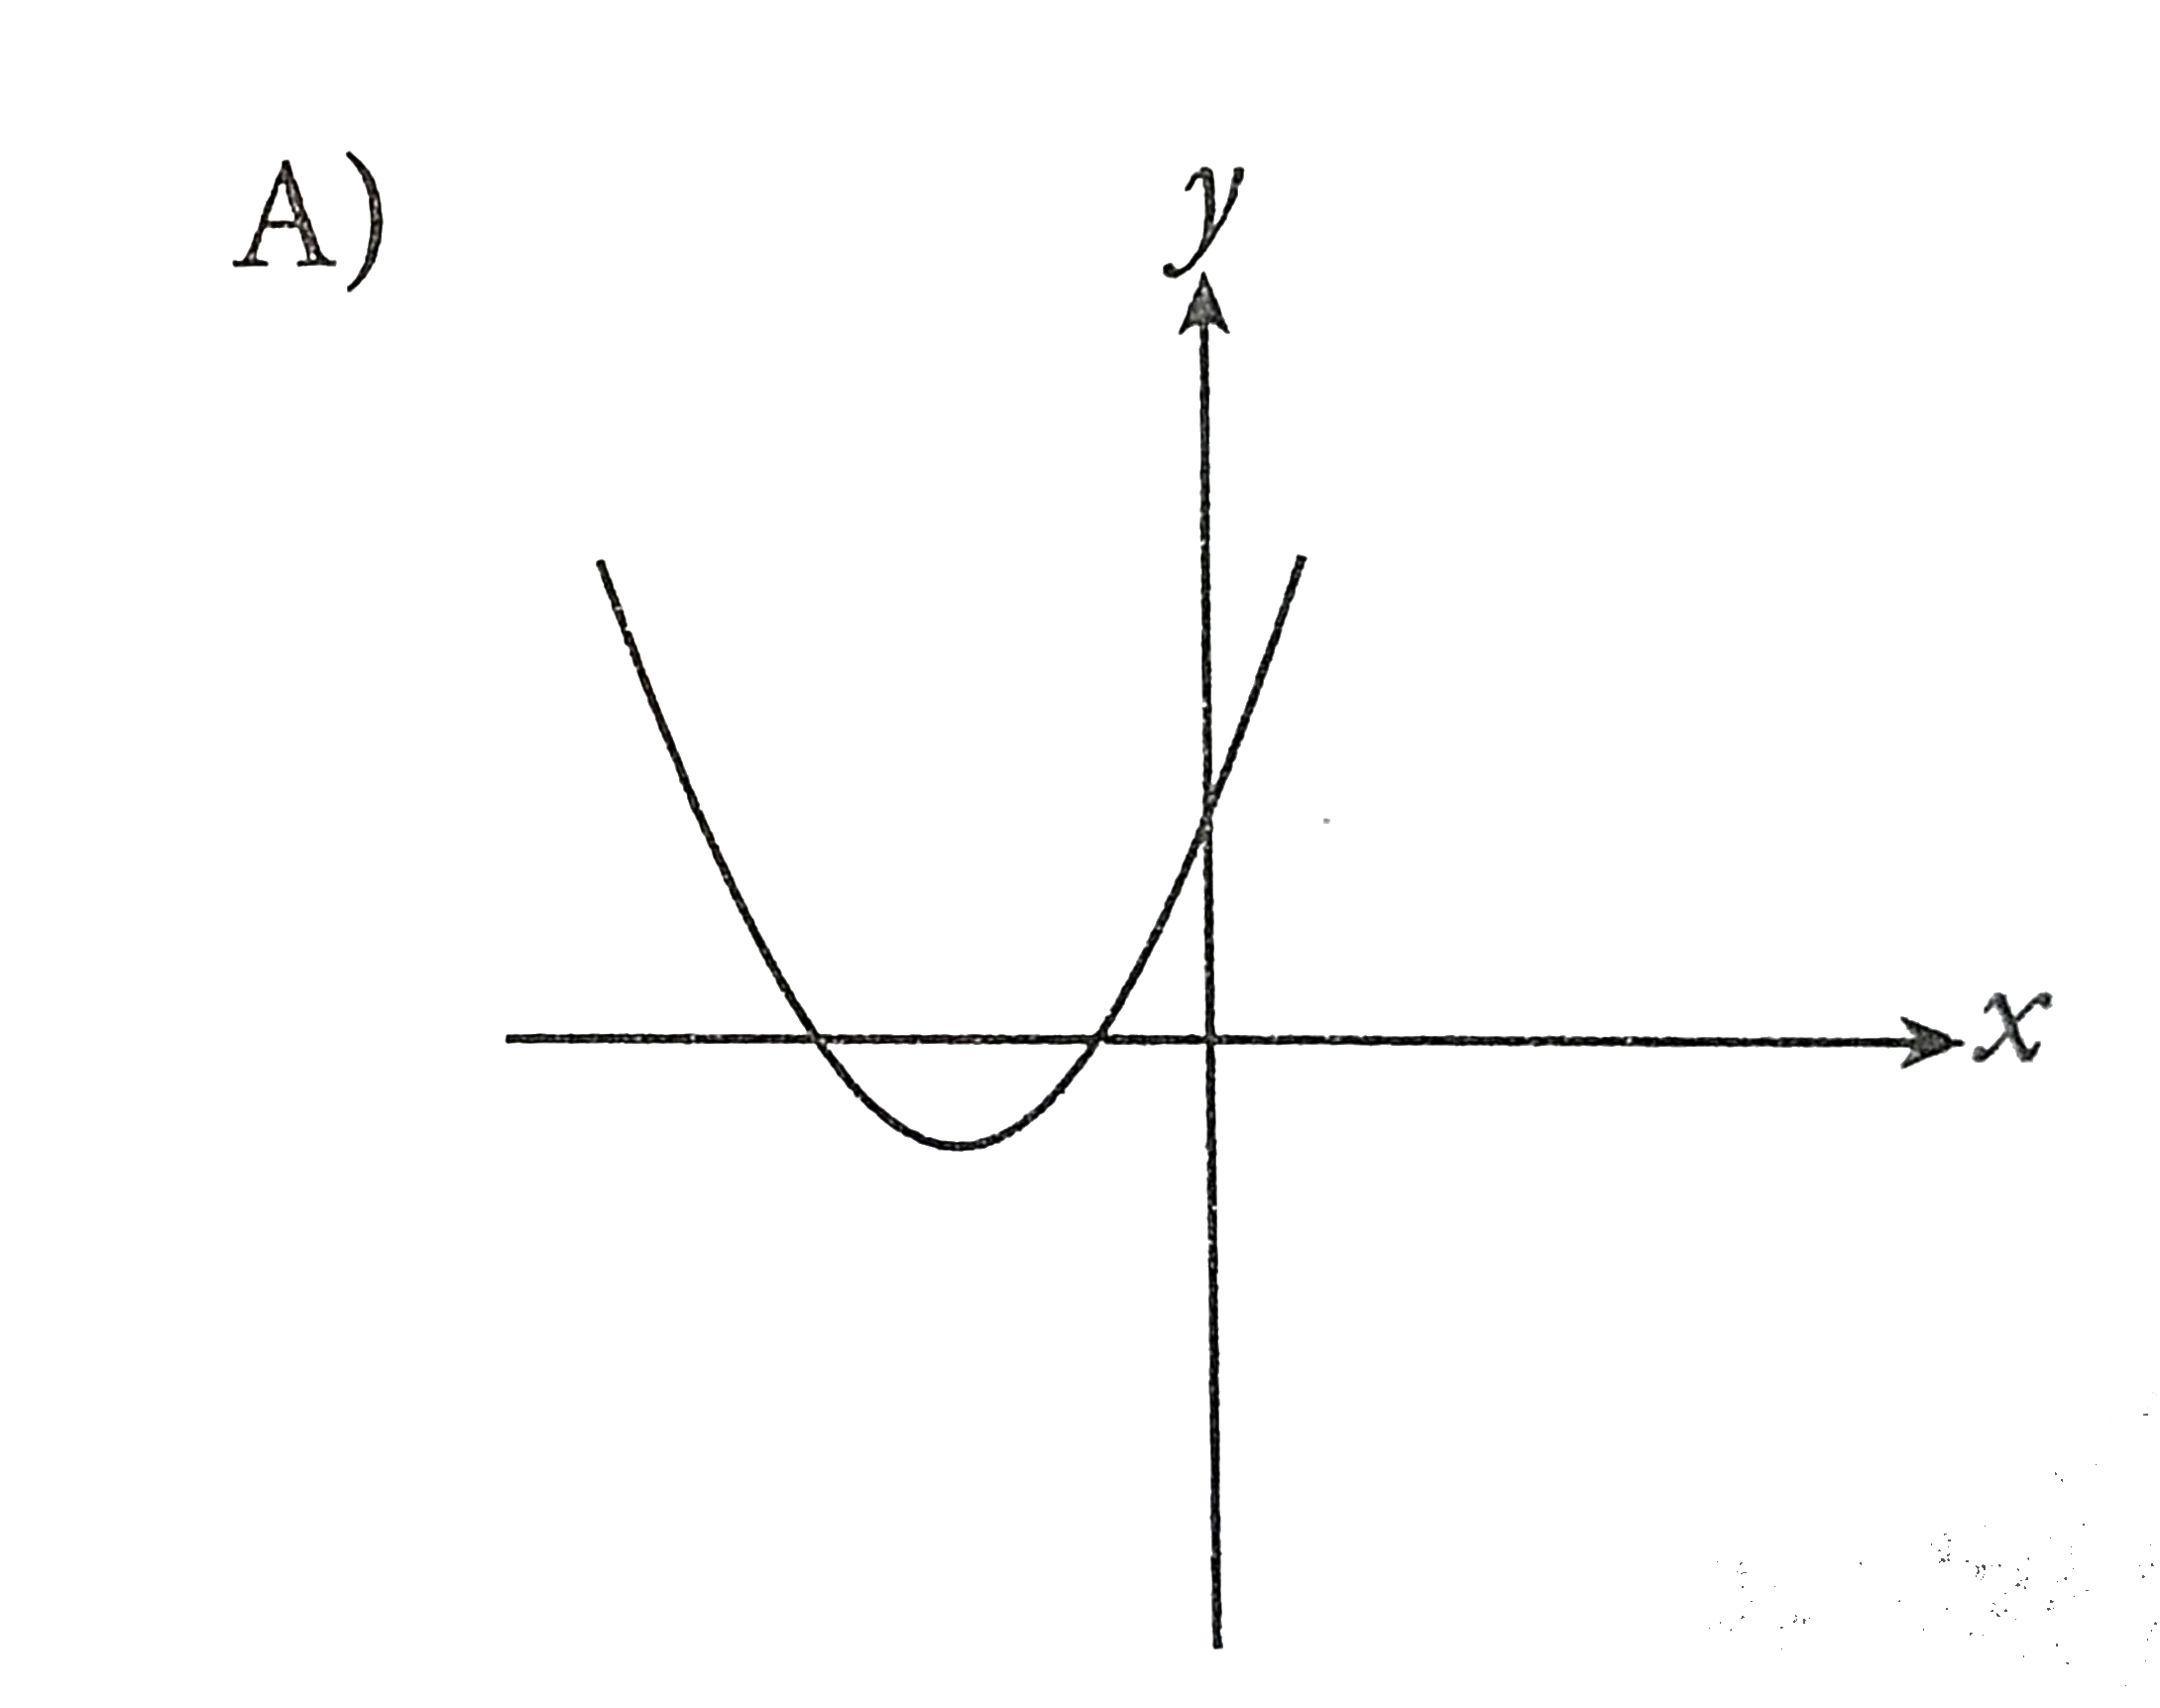 B
B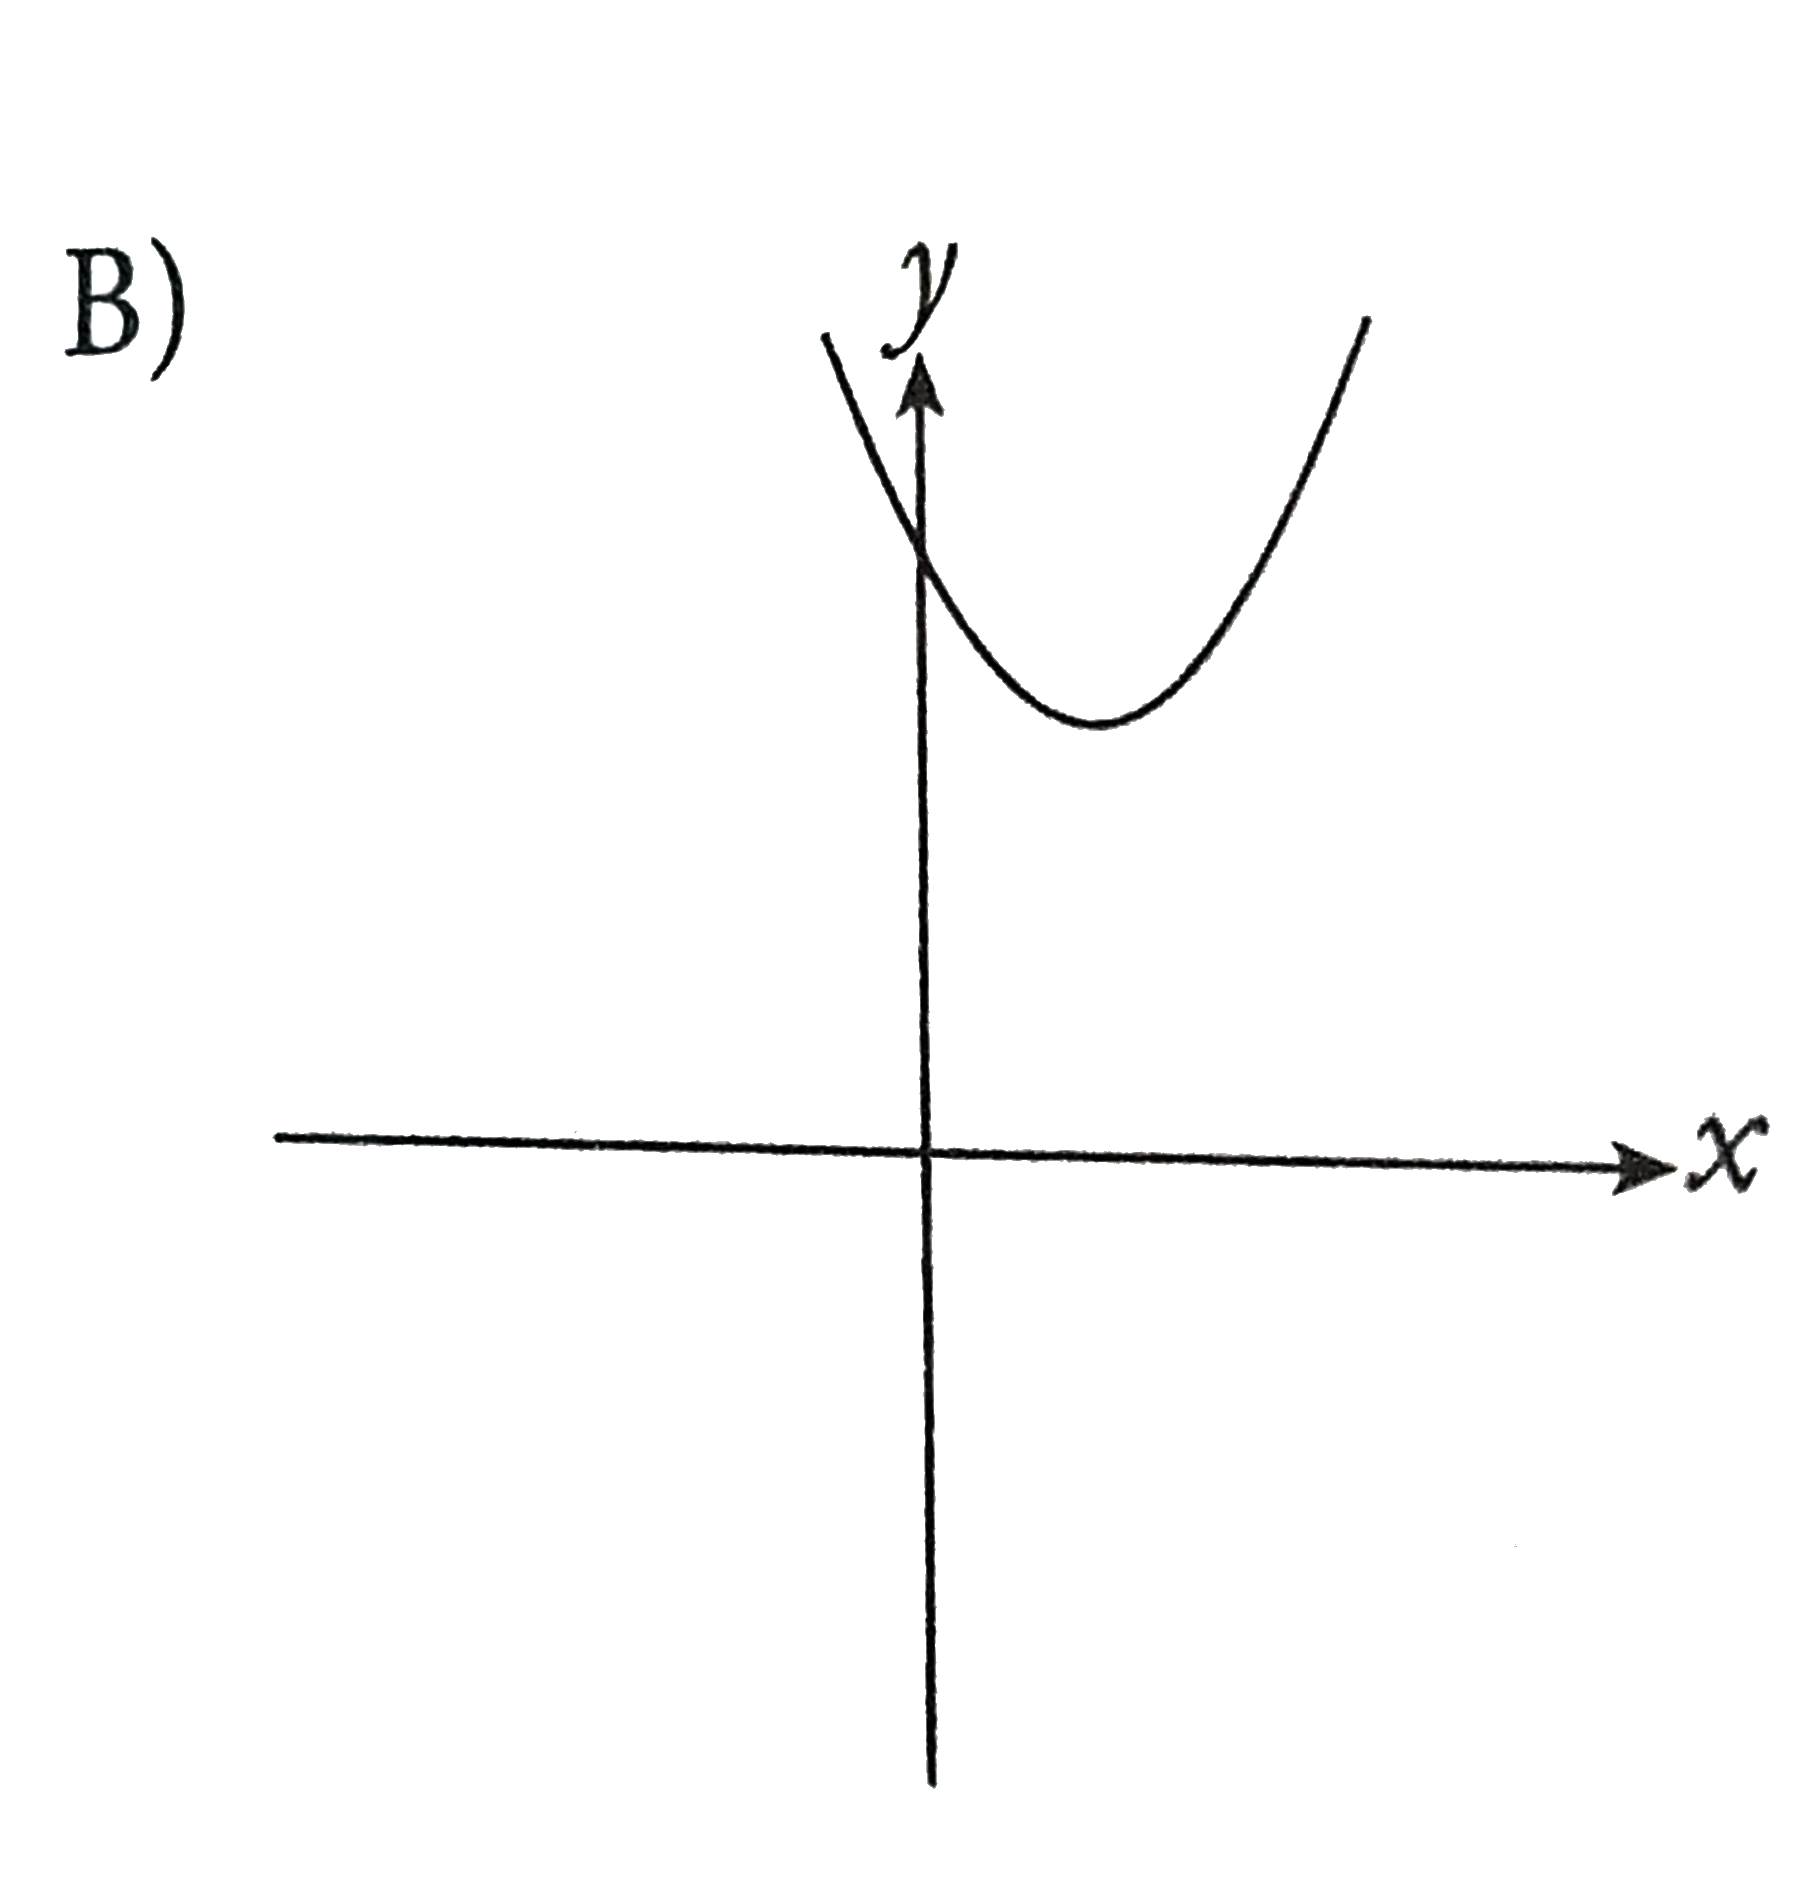 C
C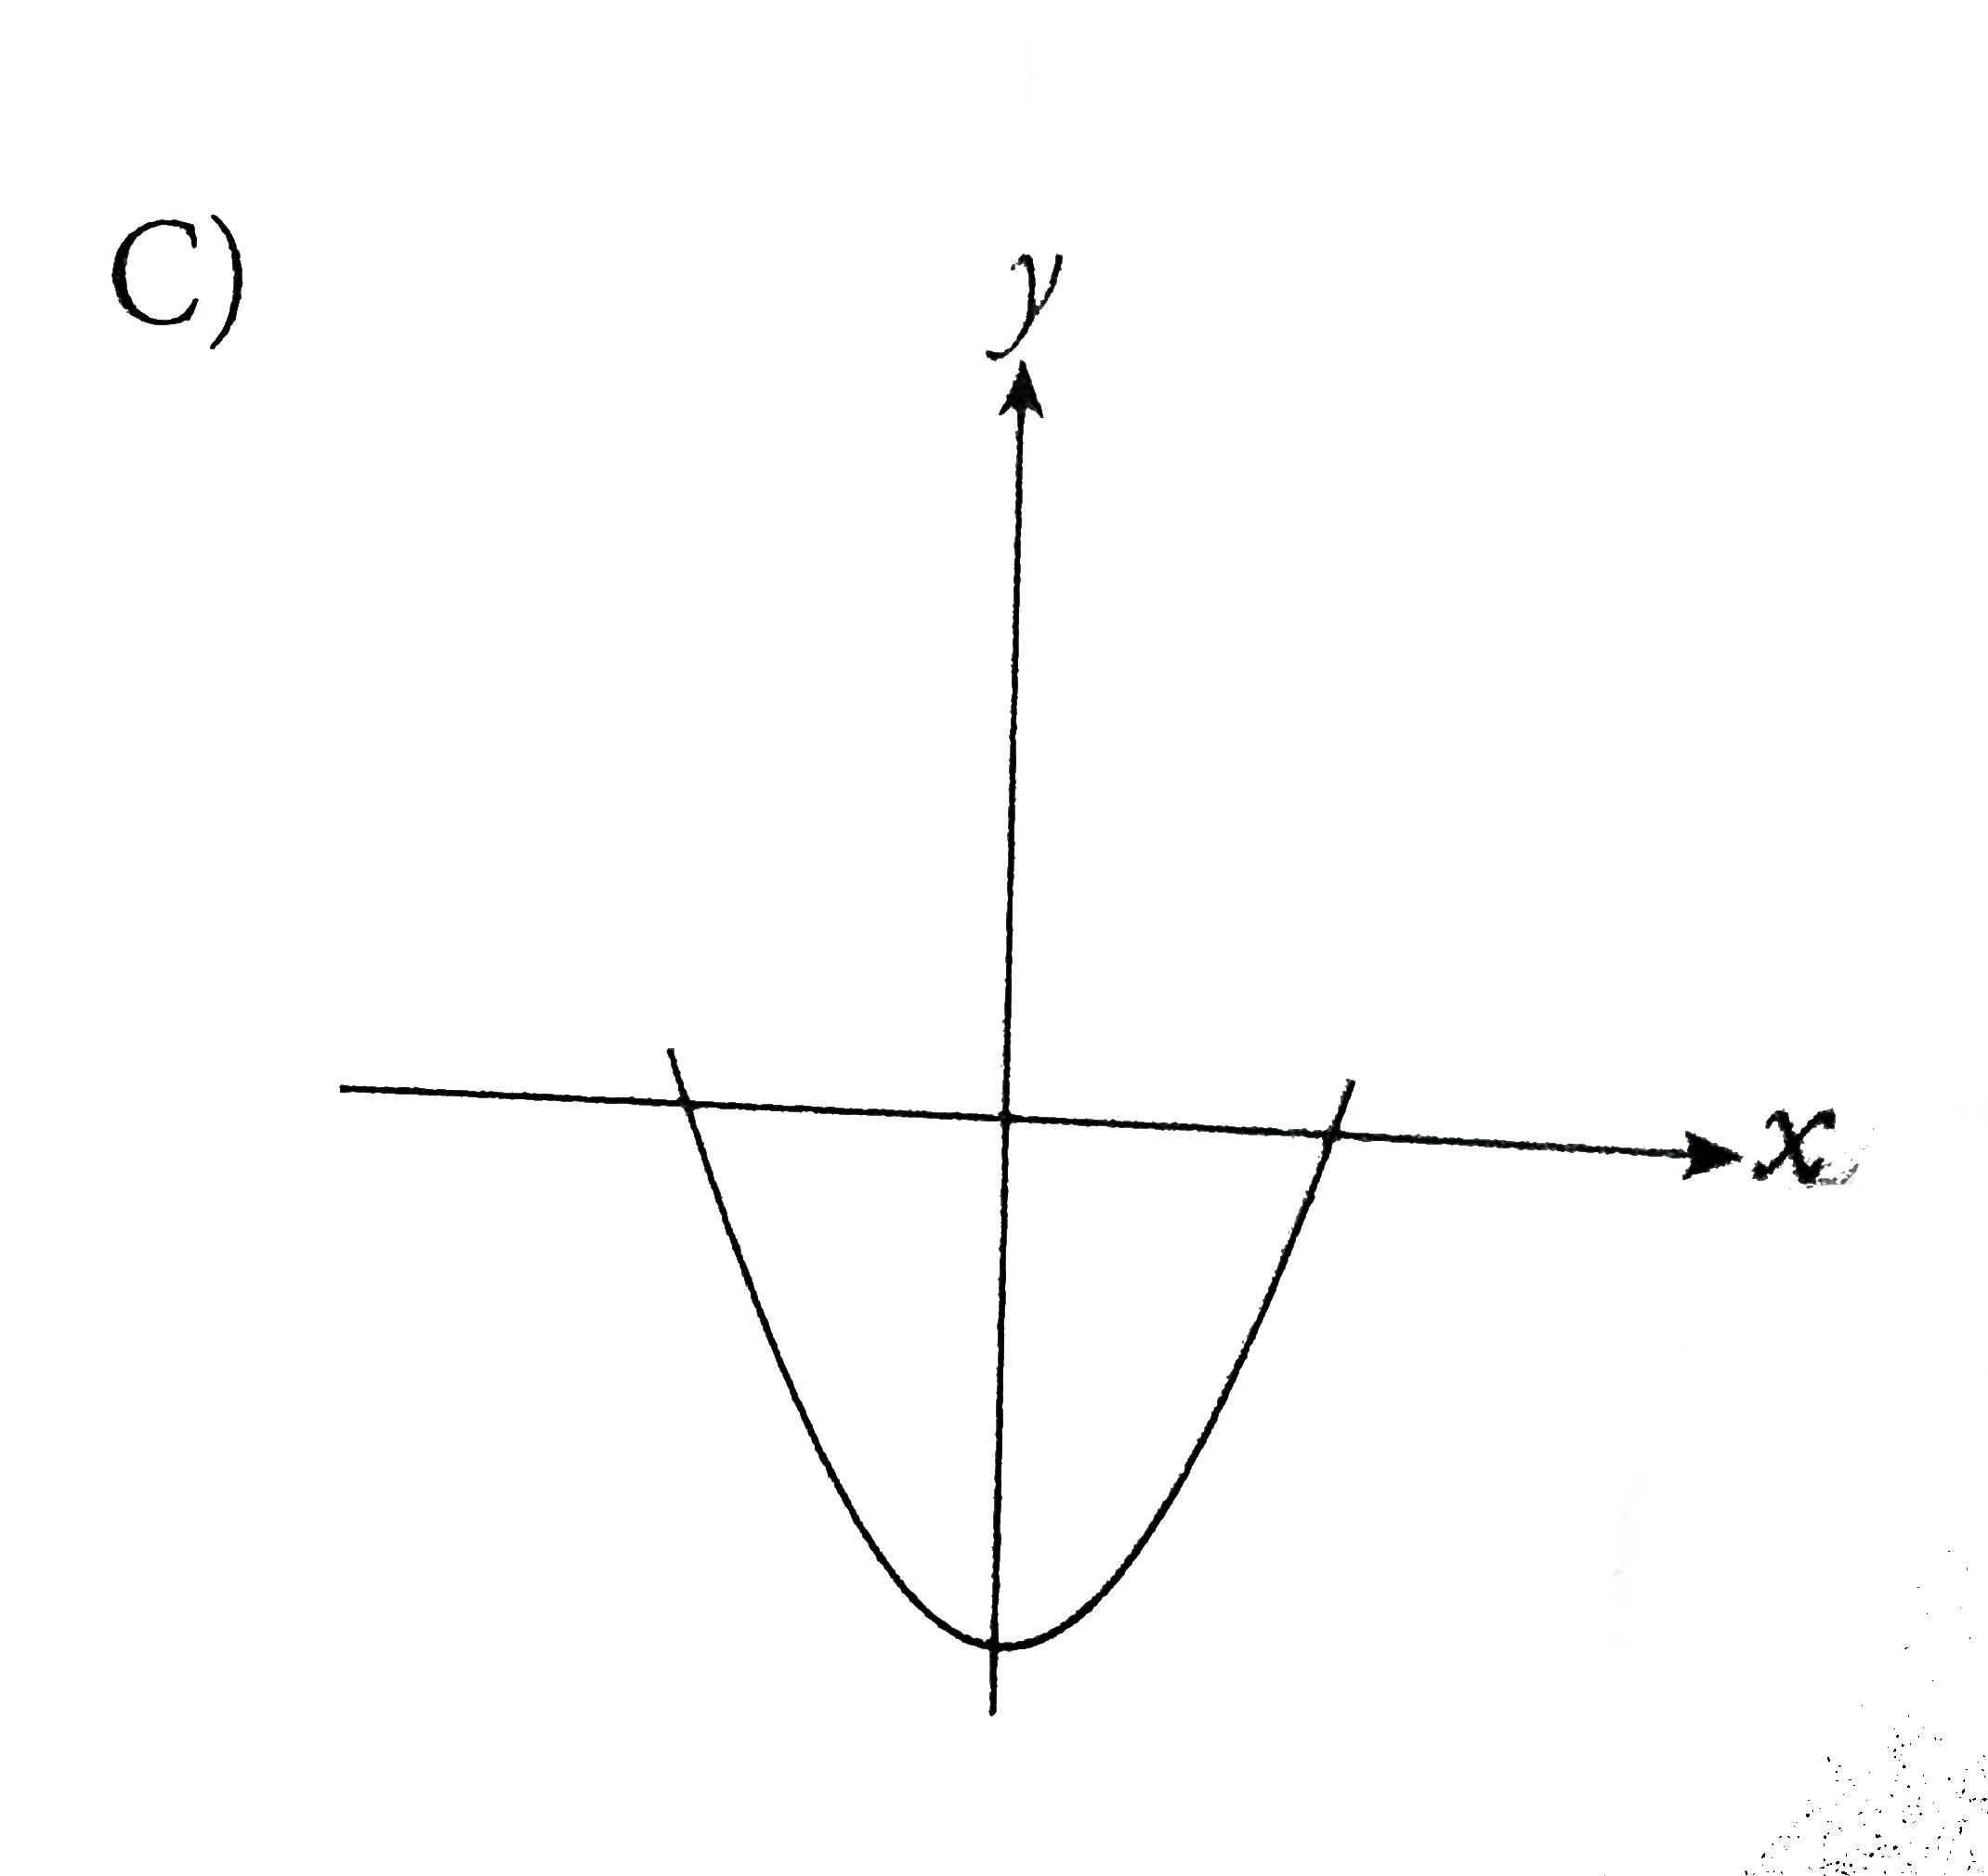 D
D
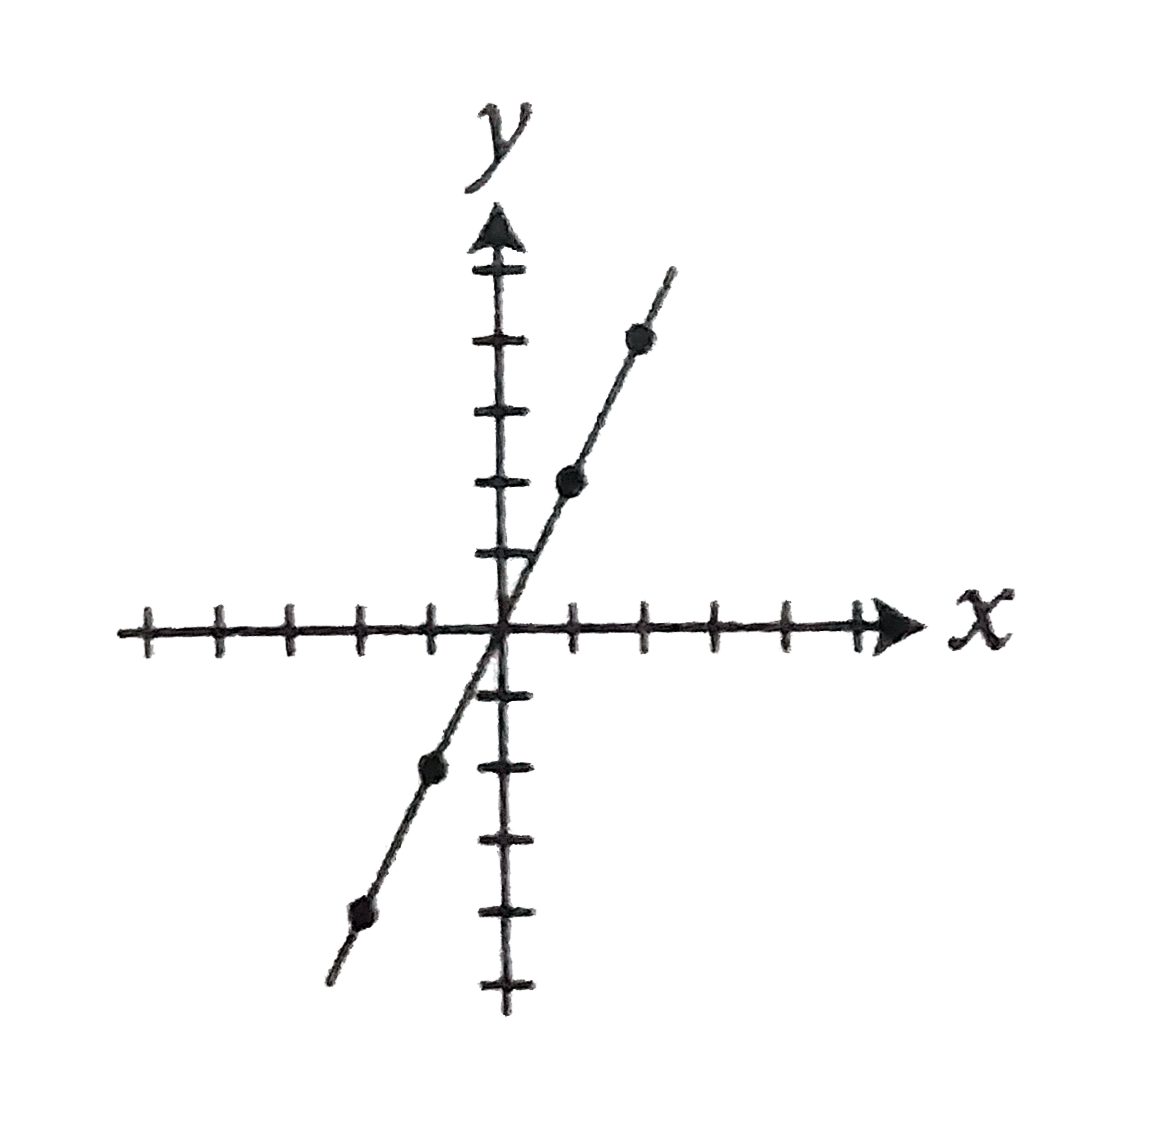
The graph above shows y=2x. Which of the following graphs represents y=|2x|?A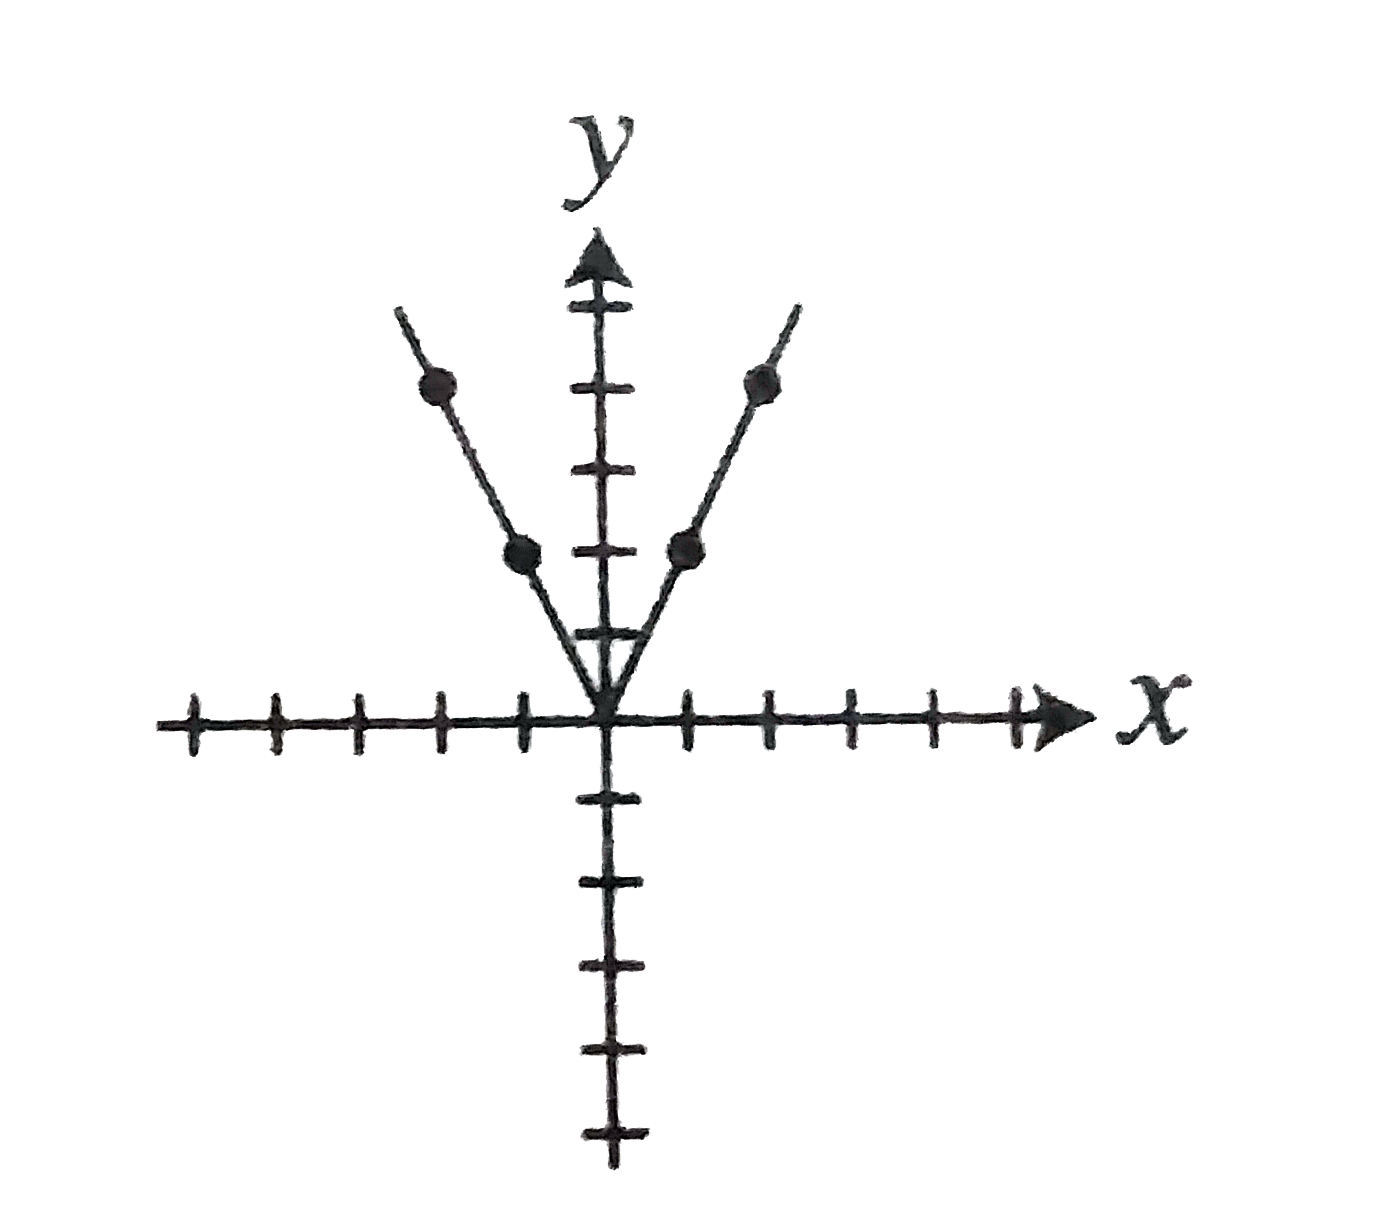 B
B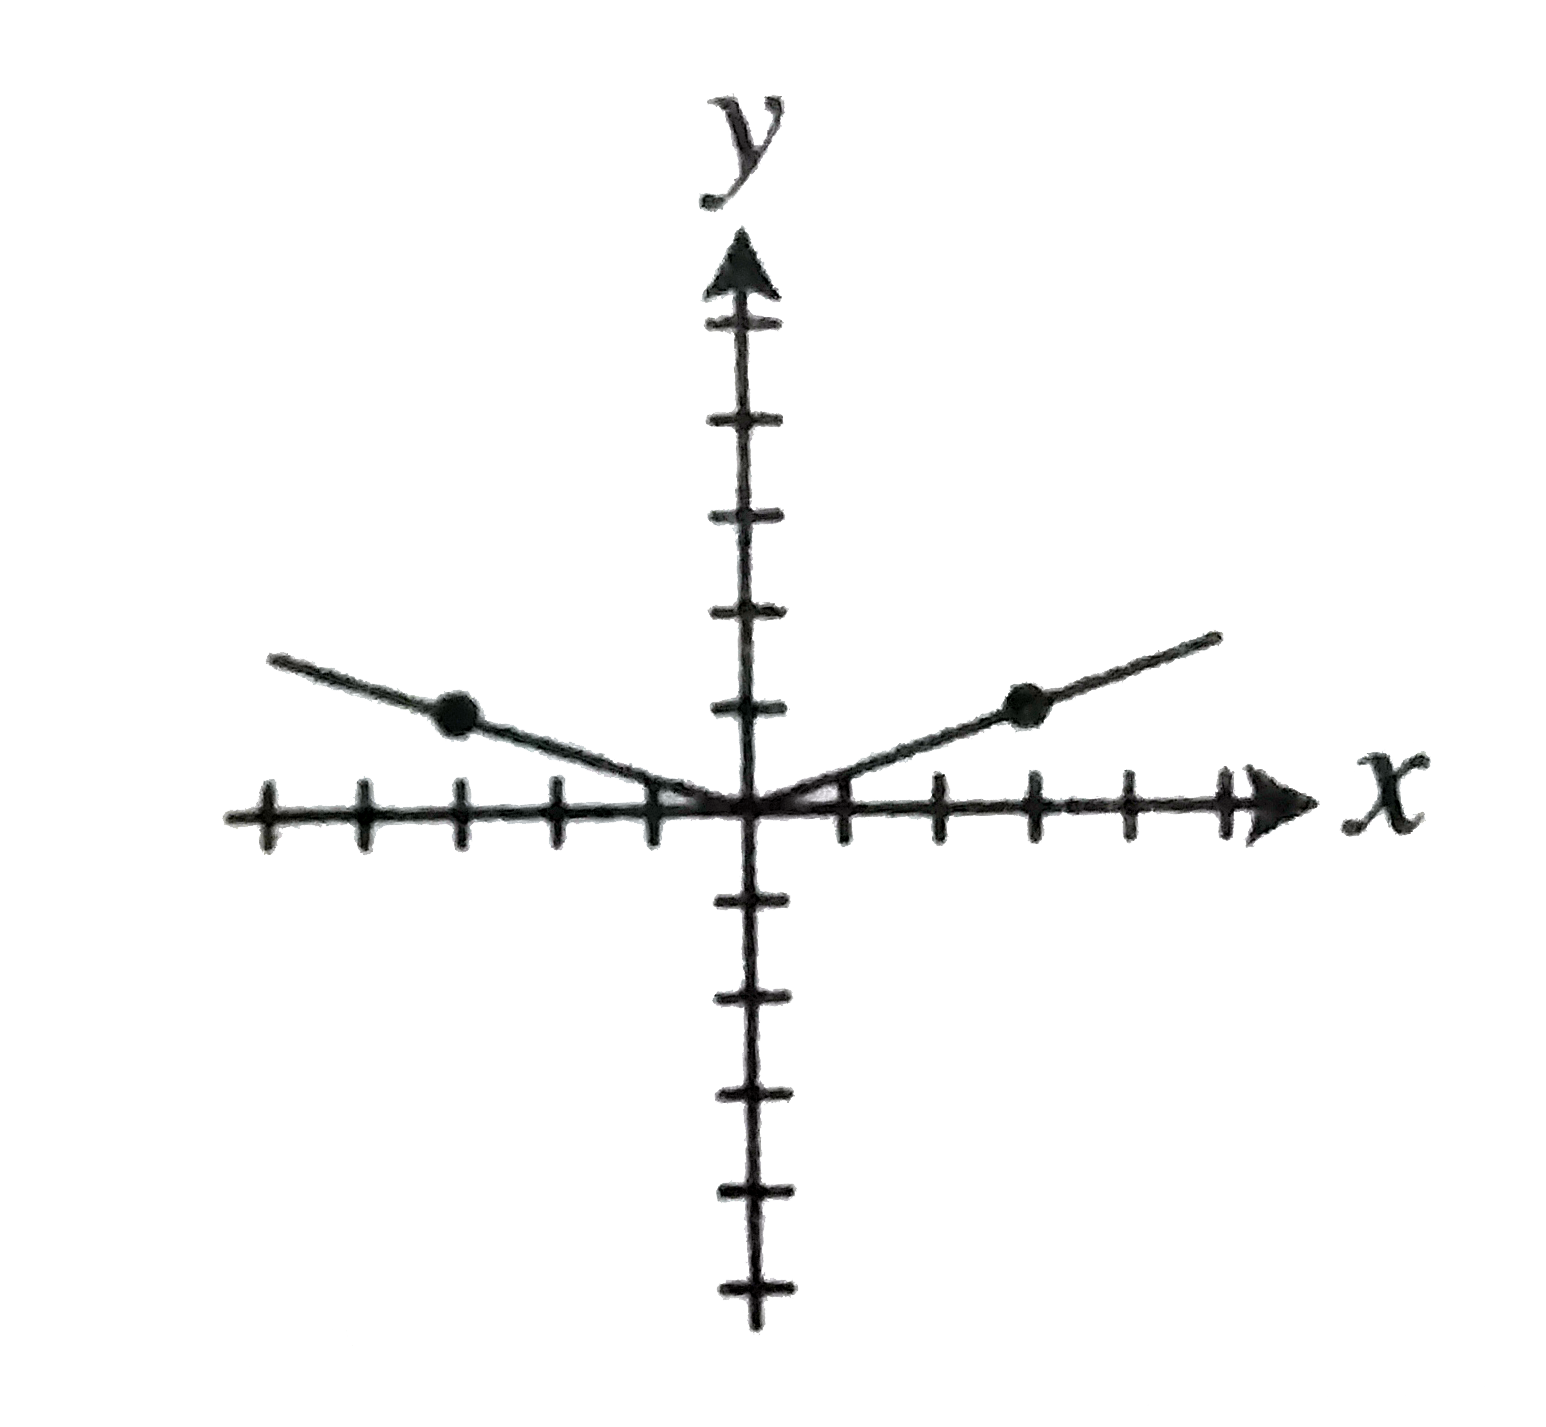 C
C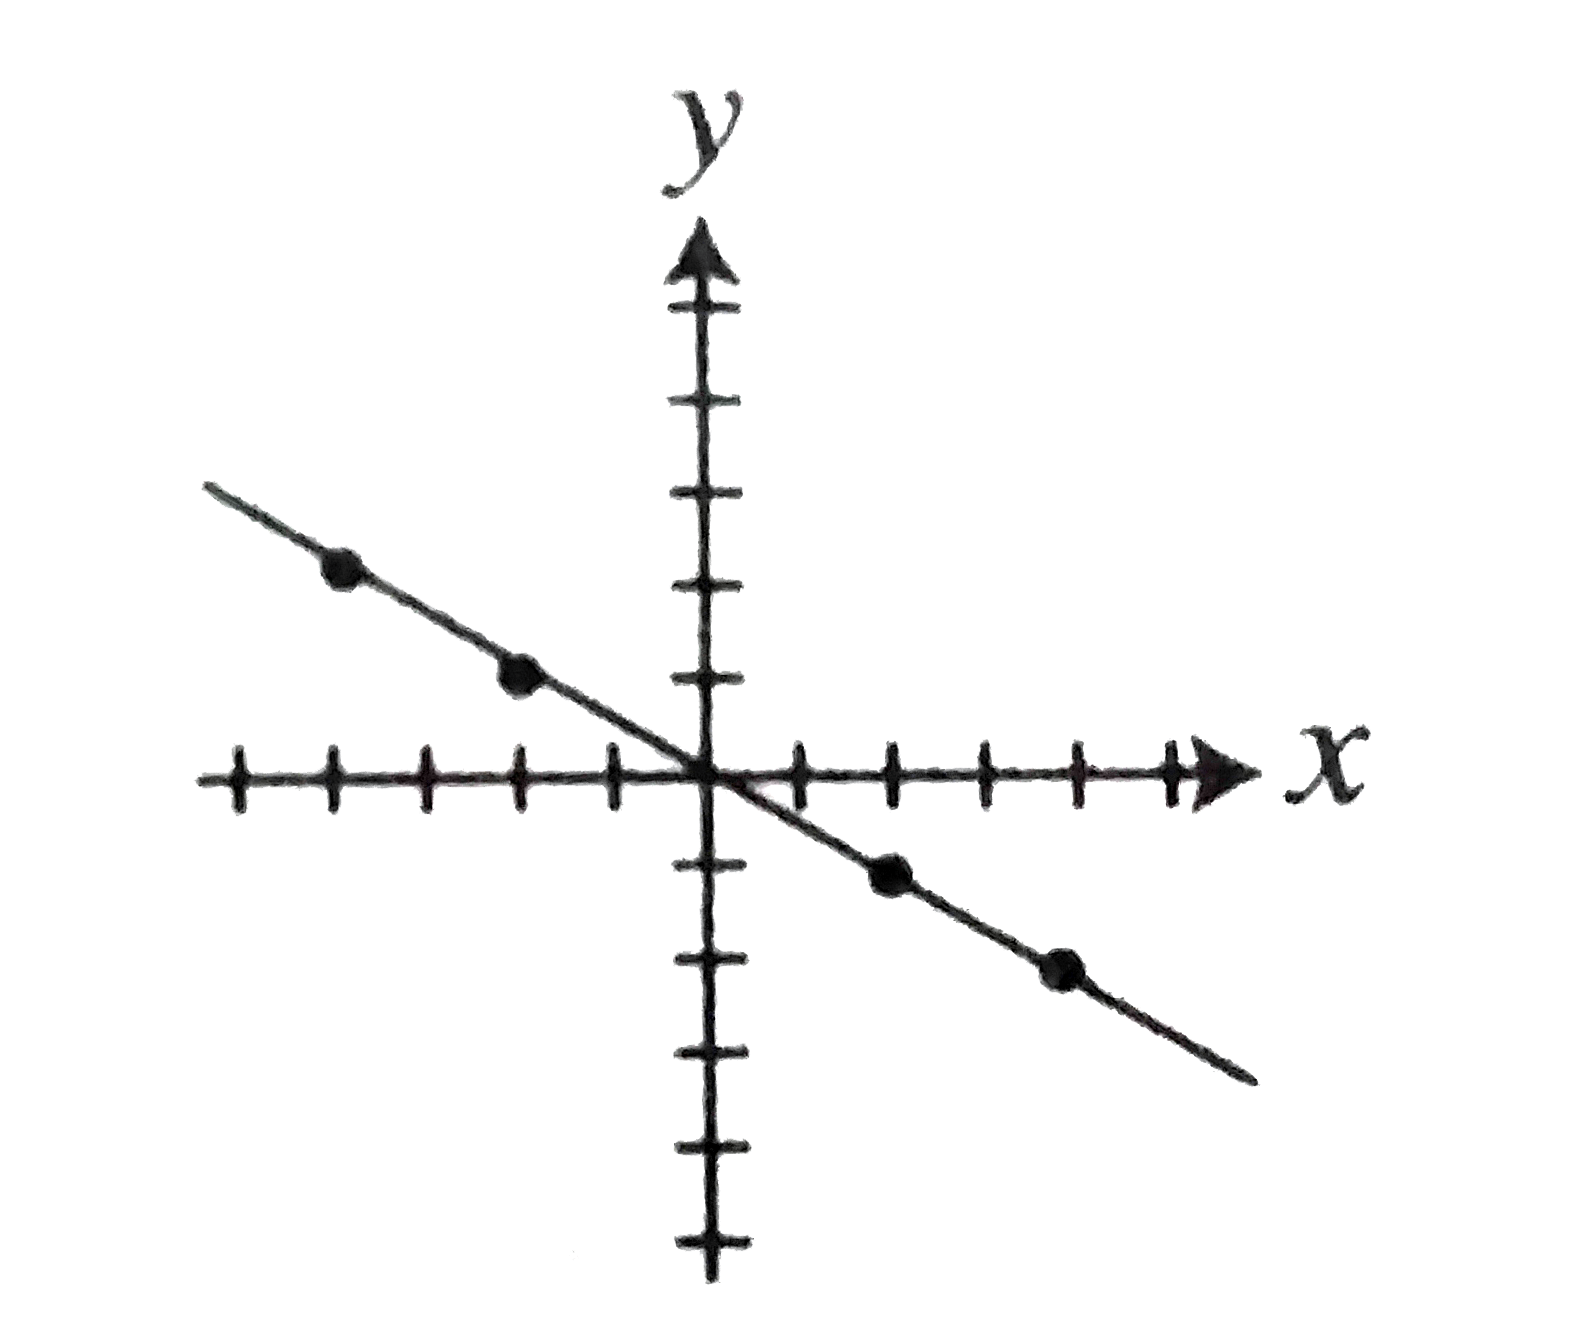 D
D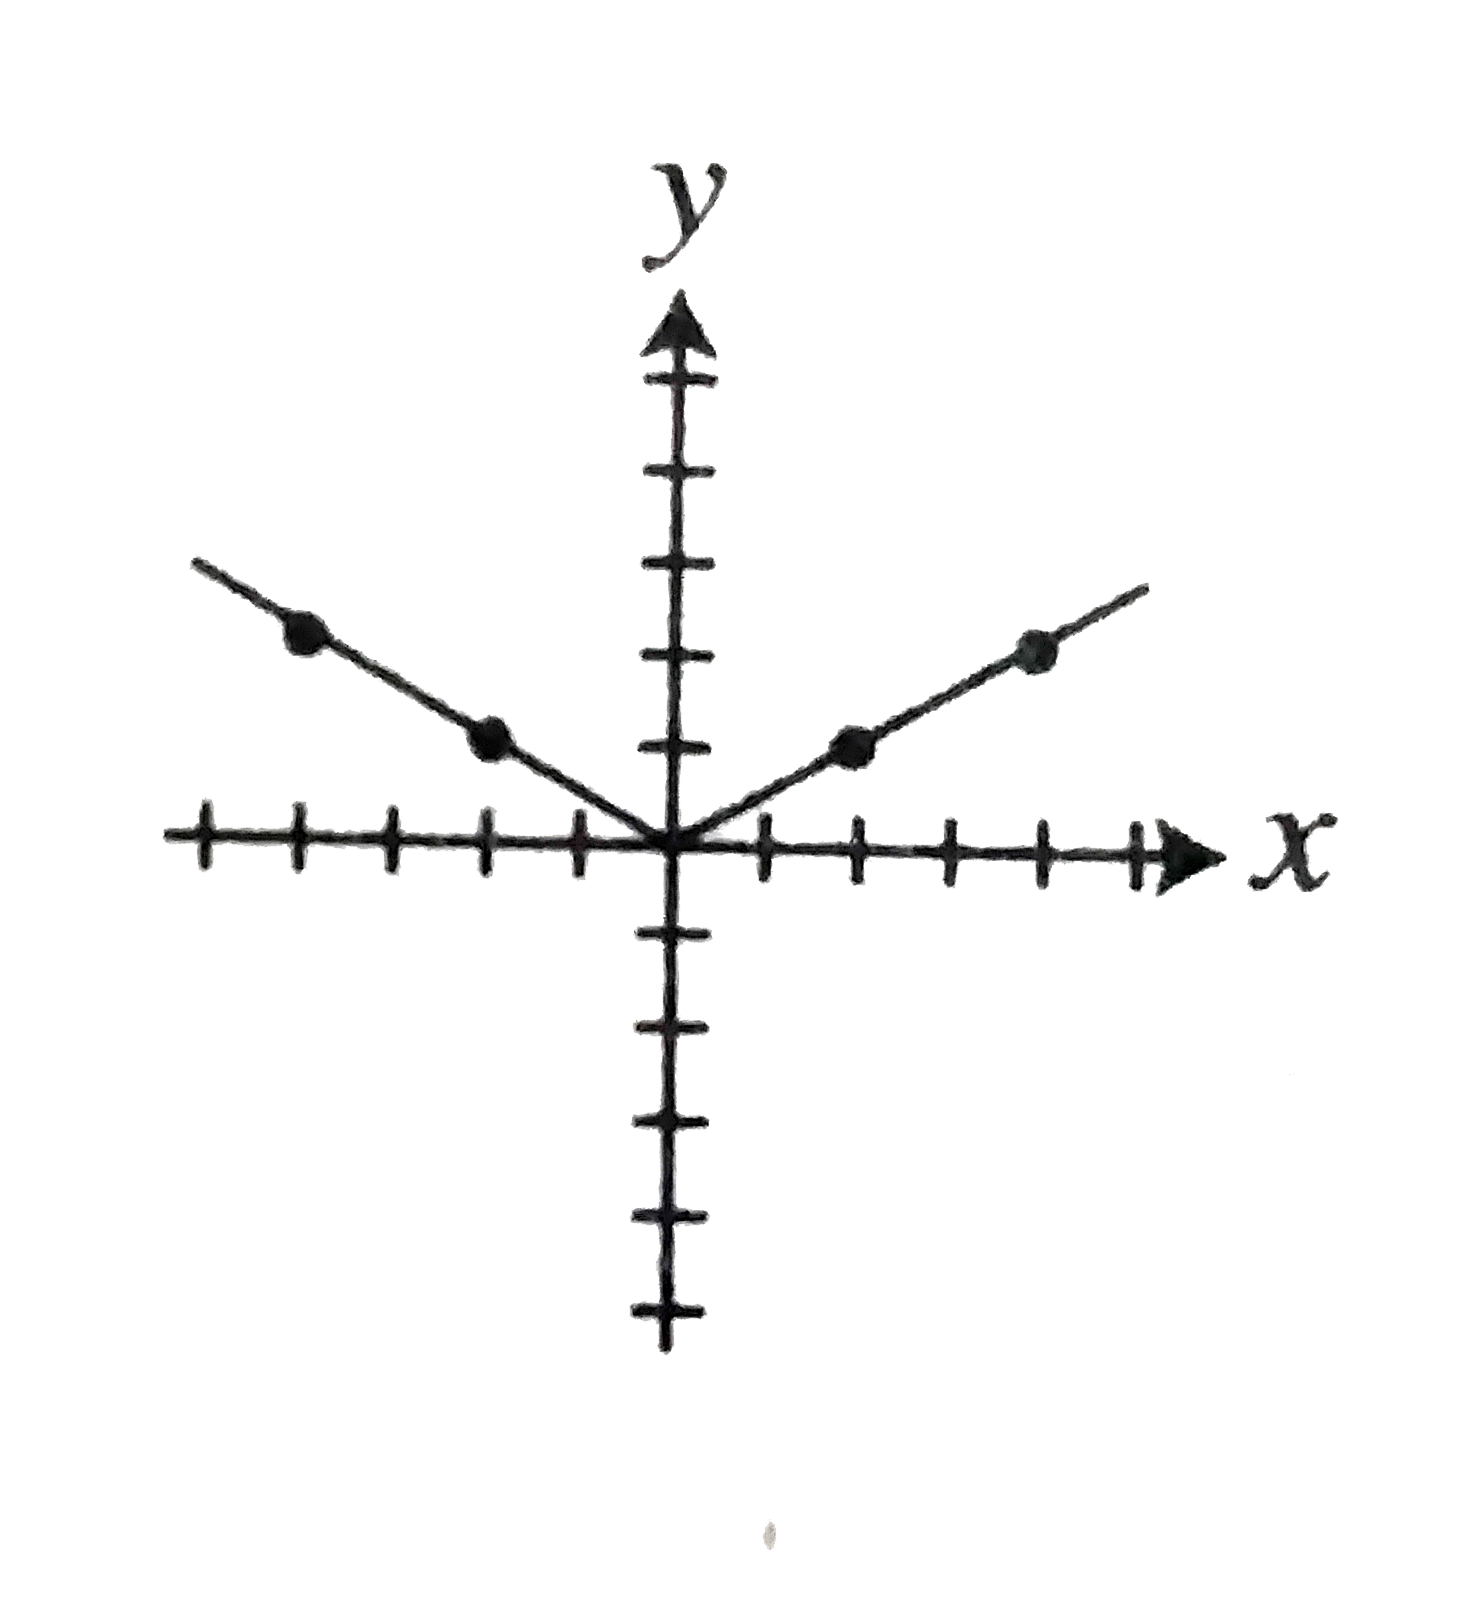
Which of the following is the graph of the equation y = 2x − 5 in the xy-plane?
A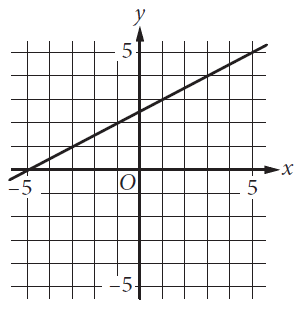 B
B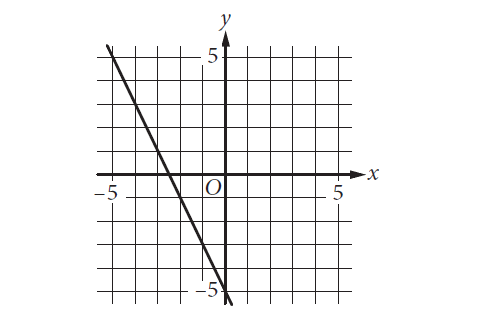 C
C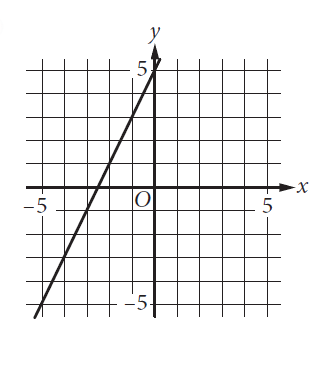 D
D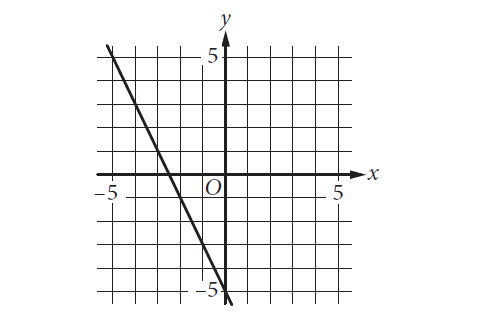
What do the following figures represent?

View Solution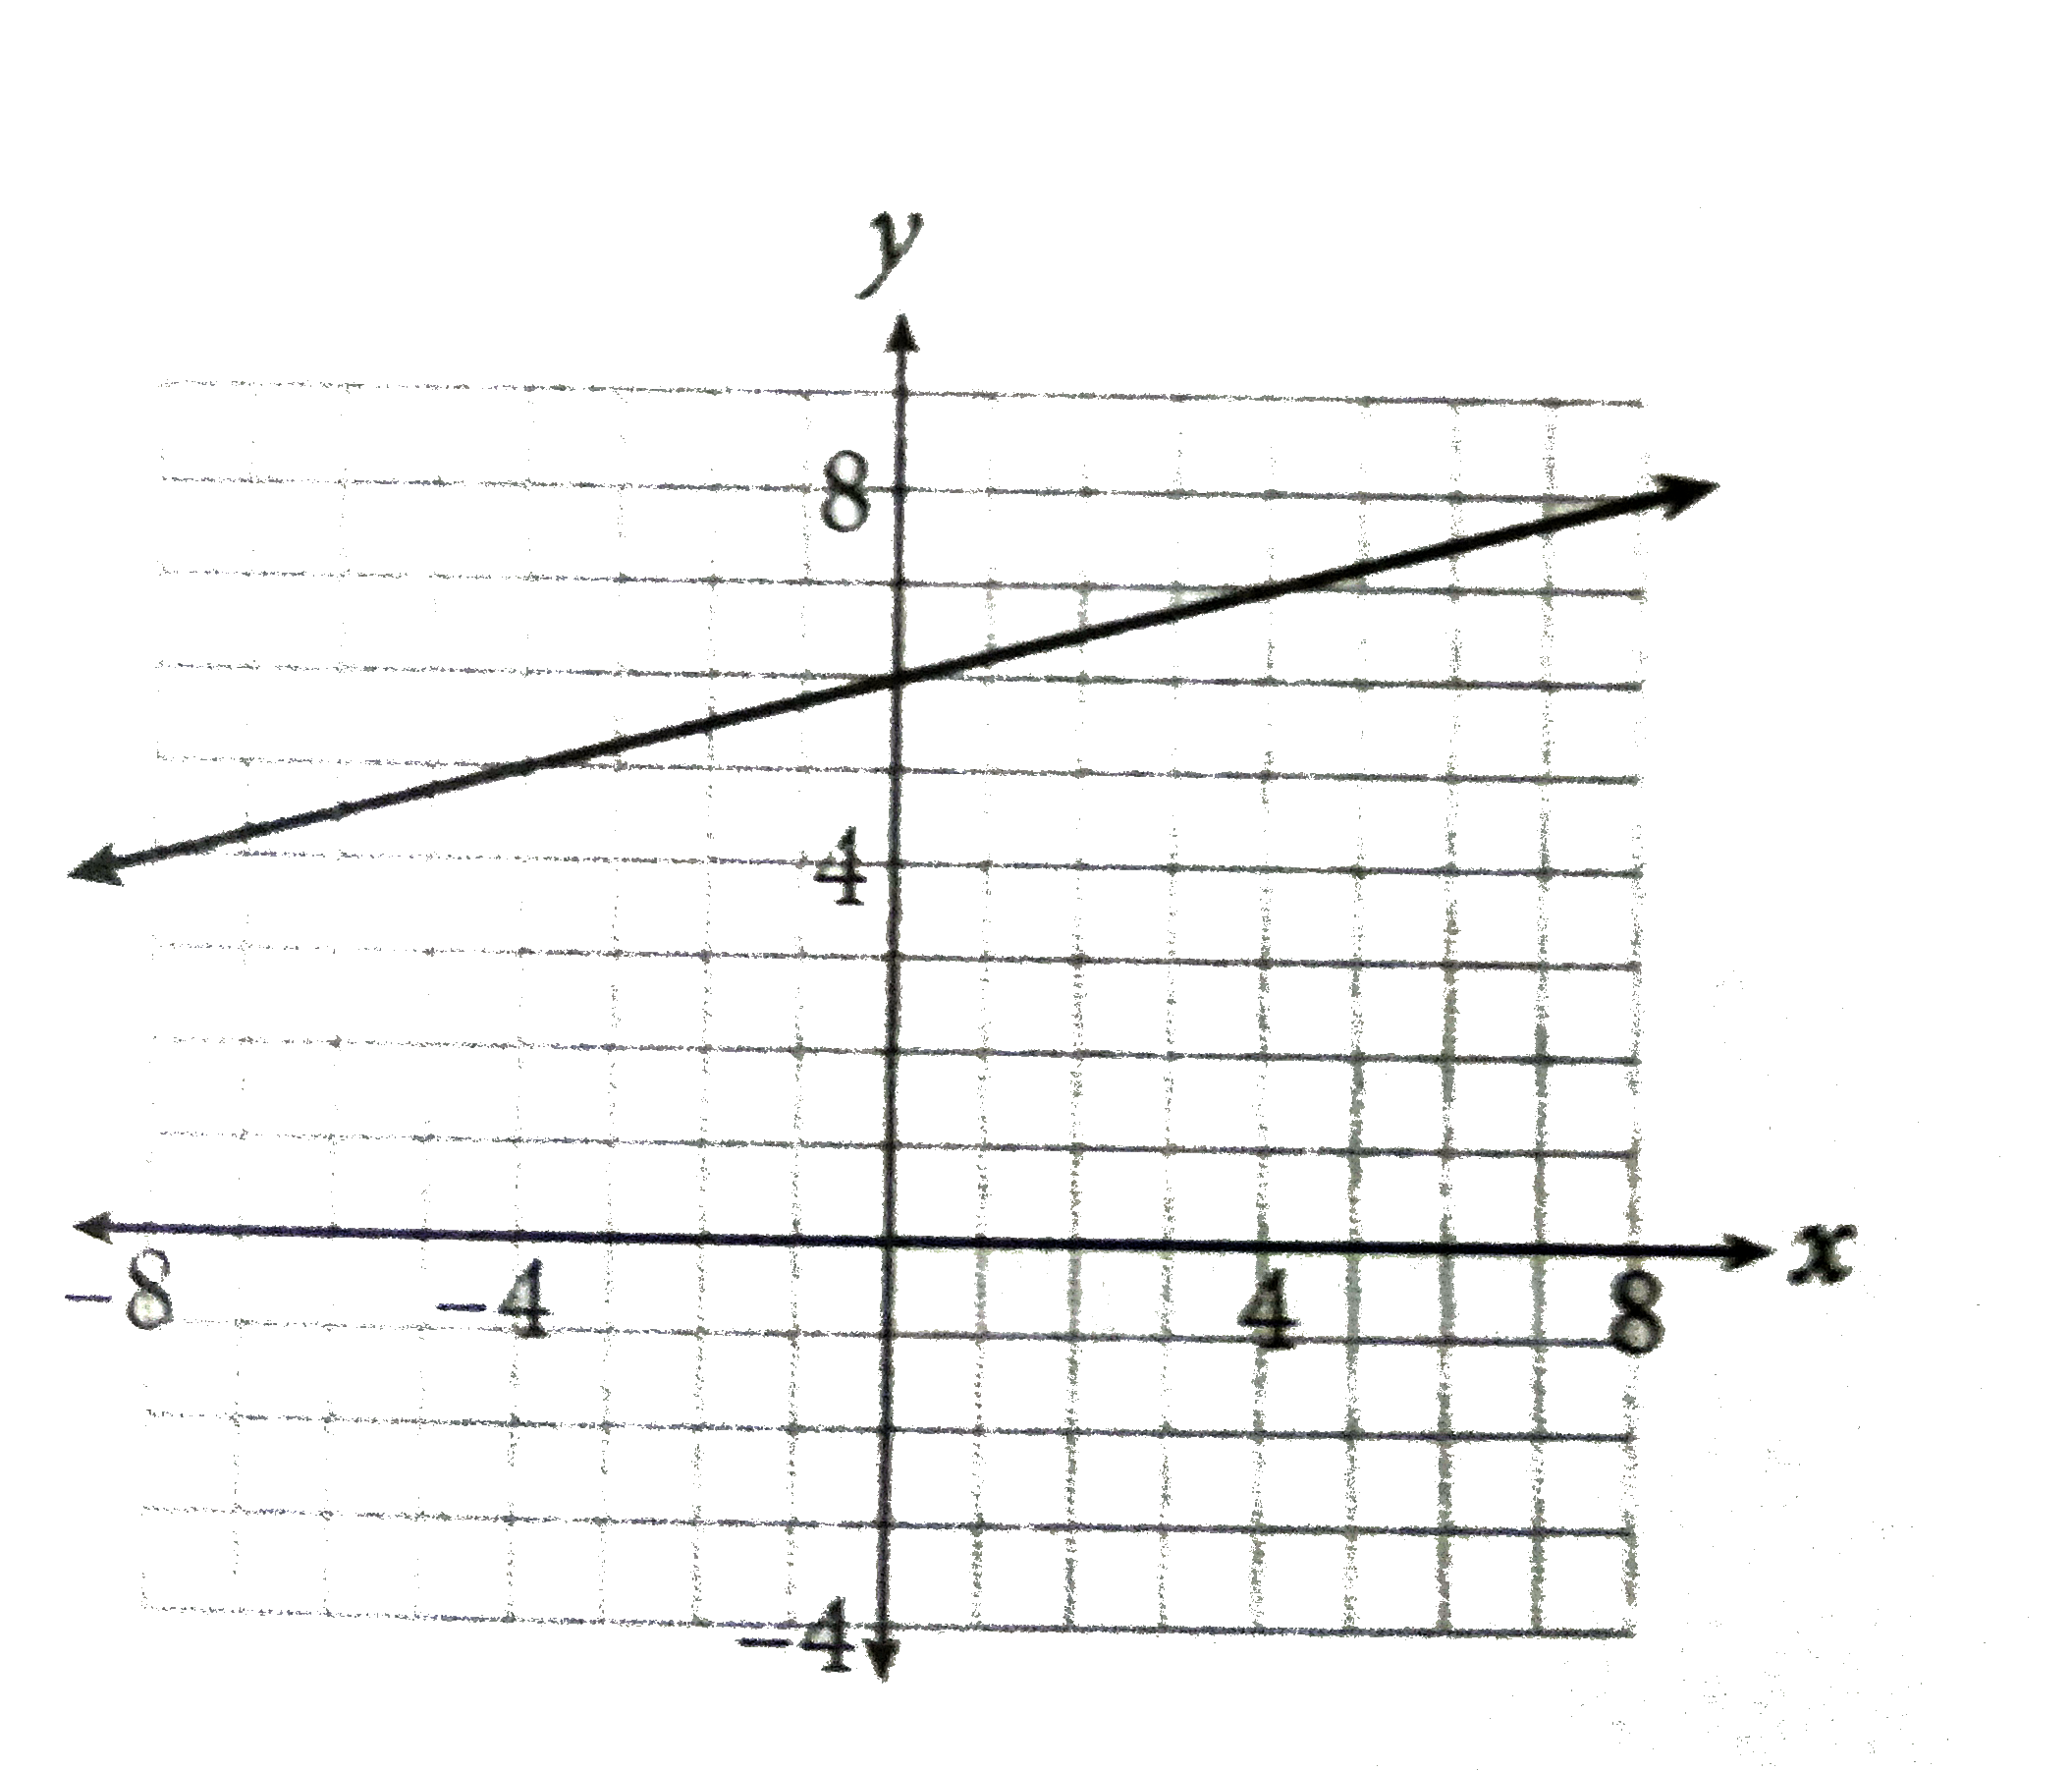
Which of the following equations represents the line shown in the graph?
View Solutiony=x2+16x+28
The equation above represents the graph of a parabola in the xy-plane. Which of the following represents an equivalent form of the equation that includes the minimum value of y as a constant?
View Solution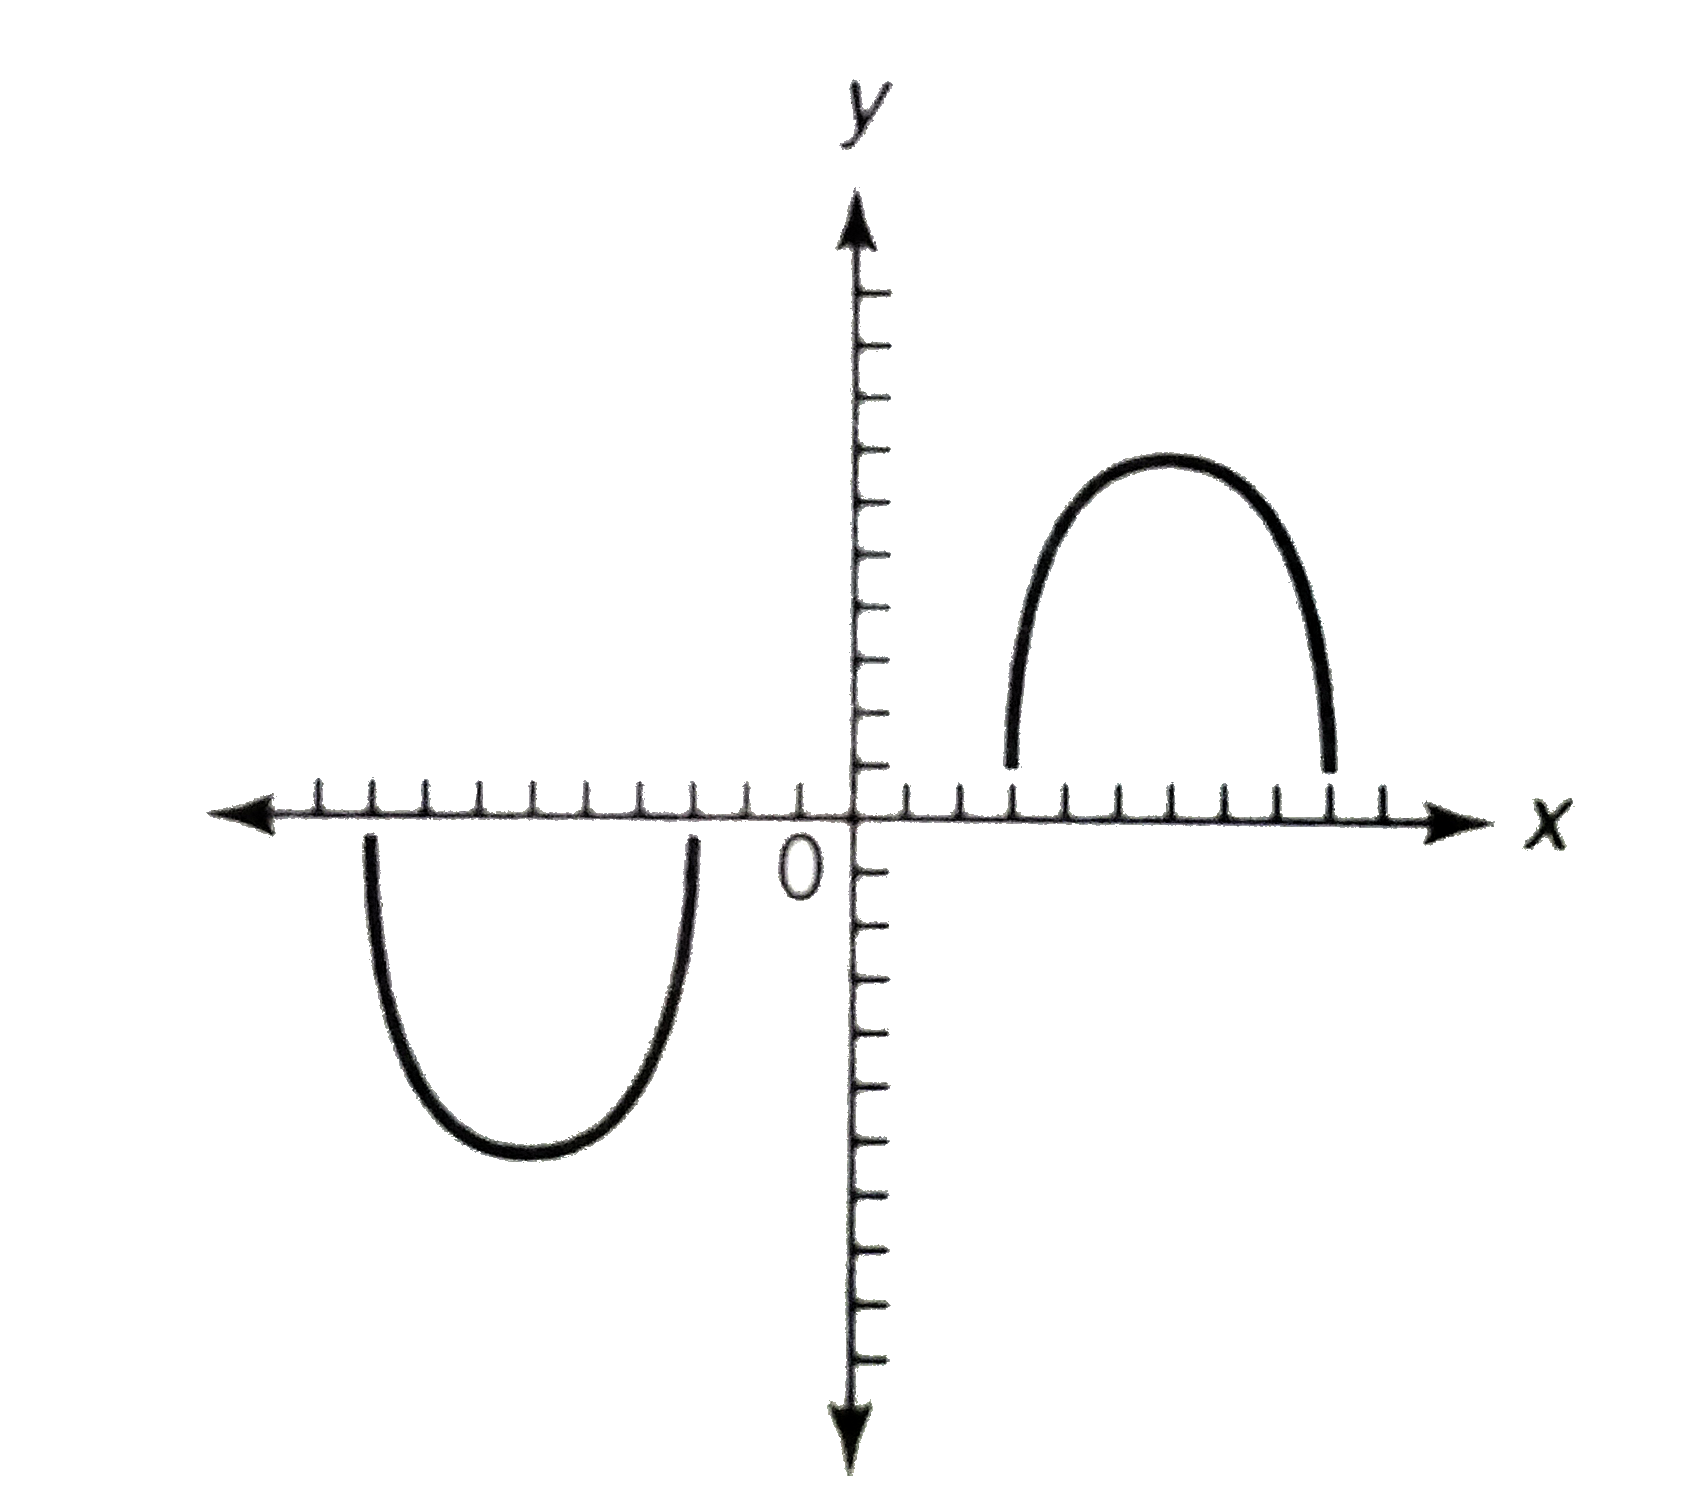
The graph of the function f is shown above. Which of the following could represent the graph of y=|f(x)|?
View SolutionWhich of the following graph is correctly represented?
View Solution


