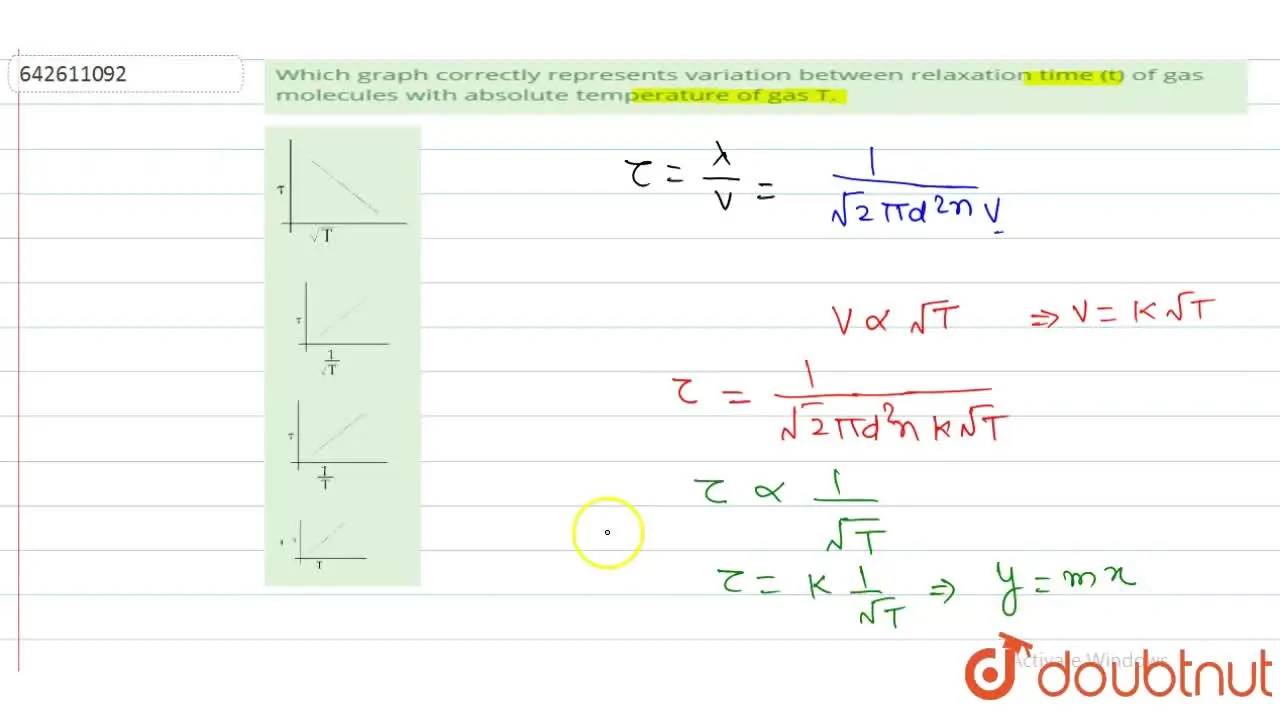
Which graph correctly represents variation between relaxation time (t) of gas molecules with absolute temperature of gas T.
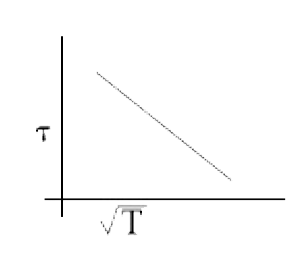
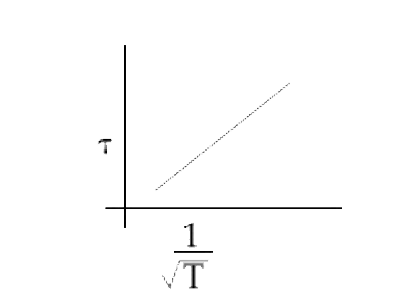
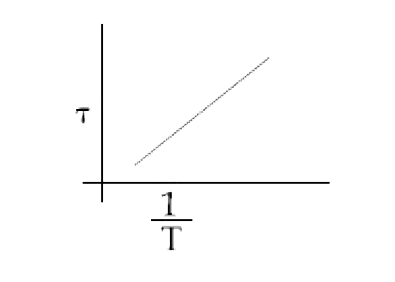
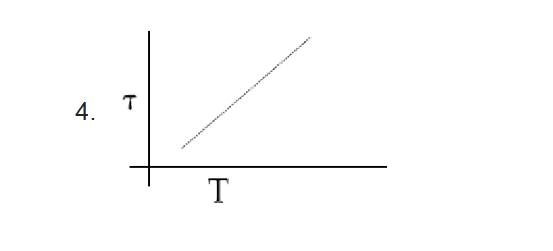
The correct Answer is:2
Step by step video & image solution for Which graph correctly represents variation between relaxation time (t) of gas molecules with absolute temperature of gas T. by Physics experts to help you in doubts & scoring excellent marks in Class 12 exams.
Related Playlists
Similar Questions
Which of the following diagram correctly represents the variation of internal energy (U) of gas under expansion at constant temperature.
View SolutionWhich of the following graphs correctly represents the variation of β=−dV/dPV
with P for an ideal gas at constant temperature?View SolutionWhich of the following graphs correctly represents the variation of β=−dV/dPV
with P for an ideal gas at constant temperature?View SolutionWhat is the mean translation kinetic energy of a perfect gas molecule at temperature T?
View SolutionWhich of the following graphs correctly represents the variation of g on the - Earth?
View SolutionThe graph which represents the variation of mean kinetic energy of moleules with temperature ∘C is ?
View SolutionThe average kinetic energy of a molecule of a gas at absolute temperature T is proportional to
View SolutionWhich of the following graphs correctly represents the variation of β=−(dVdP)/V with P for an ideal gas at constant temperature
View SolutionWhich of the following graphs correctly represents the relation between In (E) and In (T), where E is the amount of radiation emitted per unit time from a unit area of the body and T is the absolute temperature ?
View SolutionThe mean square speed of the molecules of a gas at absolute temperature T is proportional to
View Solution

