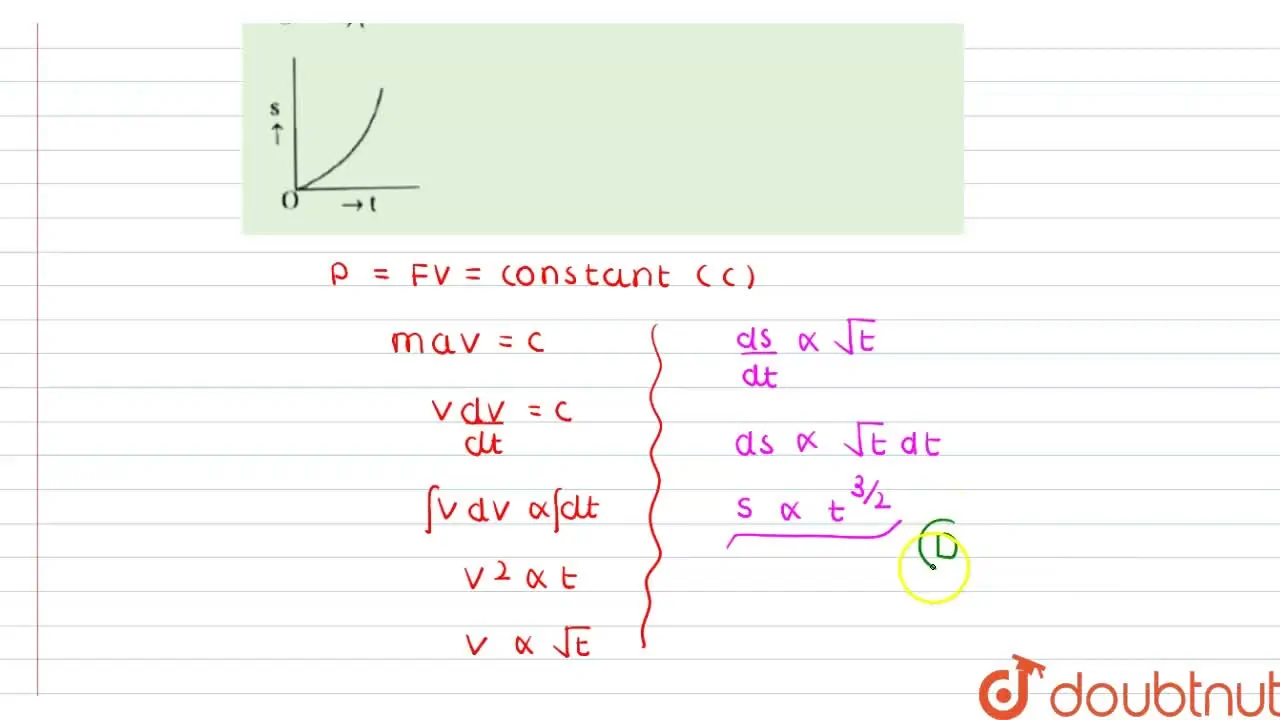
Under the source of constant power a body start to move . Which one of following graph truly represents the change of displacement (s) with time (t) ?Solution in Gujrati
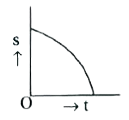
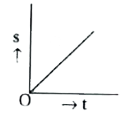
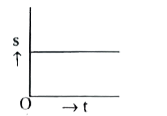
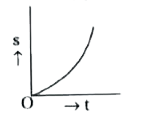
The correct Answer is:D
P=Fv
=mast [∴F=ma,v=st]
=m×st2×st [∴a=st2]
= In ms2t3
P,m are constant
∴s2∝t3 ∴Graph of s→t
∴S∝t(32) same as in (D)
Related Playlists
- BOOK - KUMAR PRAKASHANCHAPTER - WORK, ENERGY AND POWER EXERCISE - SECTION - F Questions From Module (Sample questions for preparation of competitive exams)23videos
WORK, ENERGY AND POWER
- BOOK - KUMAR PRAKASHANCHAPTER - WORK, ENERGY AND POWER EXERCISE - QUESTION PAPER (SECTION - A)6videos
WORK, ENERGY AND POWER
- BOOK - KUMAR PRAKASHANCHAPTER - WORK, ENERGY AND POWER EXERCISE - SECTION - D NCERT Exemplar Solutions (Long Answer Type Questions)5videos
WORK, ENERGY AND POWER
- BOOK - KUMAR PRAKASHANCHAPTER - WAVESEXERCISE - SECTION-F (Questions From Module) (Sample questions for preparation of competitive exams)23videos
WAVES
Similar Questions
A Sphere makes an inslastic collision with another sphere of same mass , then both the spheres are moving .The angle between their direction of motion will be ……..
05:50View SolutionWhen force is exerted on a body what is necessary for work done ?
View SolutionA block of mass 1 kg is pushed up a surface inclined to horizontal at an angle of 30∘ by a force of 10 N parallel to the inclined surface (figure) . The coefficient of friction between block and the incline is 0.1 .If the block is pushed up by 10 m along teh inclined calculate

(a) work done against gravity
(b) work done against force of friction
(c ) increases in potential energy
(d) increases in kinetic energy
(e) work done by applied force03:40View SolutionIn a standing wave formed by two atoms separated by 1.21Å, there are 3 nodes and 2 antinodes. Find its wavelength.
View SolutionA body starts moving unidirectionally under the influence of a source of constant power . Which one of the graph corectly shows the variation of displacement (s) with time (t)?
View SolutionA body starts moving unidirectionally under the influence of a source of constant power . Which one of the graph correctly shows the variation of displacement (s) with time (t) ?
02:10View SolutionA body is moving unidirectionally under the influence of a source of constant power. Its displacement in time t is proportional to
View SolutionA body is moving unidirectionally under the influence of a source of constant power. Its displacement in time t is proportional to
View SolutionA body is moving unidirectionally under the influence of a source of constant power. Its displacement in time t is proportional to
06:33View SolutionA body is moving unidirectionally under the influence of a source of constant power. Its displacement in time t is proportional to
View SolutionA body is moving under the expense of a constant power. If .X. is the displacement in time .t., then .x. is proportional to
View SolutionA body is moving unidirectionally under the influence of a source of constant power. It displacement in time t is proportional to
View SolutionA body is moving indirectionally under the influence of a source of constant power . Its displacement in time t is proportional to
View SolutionA body is moving under the expense of a constant power. If 'X' is the displacement in time 't', then 'x' is proportional to
04:54View SolutionA body is moving undirectionally under the influence of a source of constant power. It displacement in time t is proportional to
View Solution

