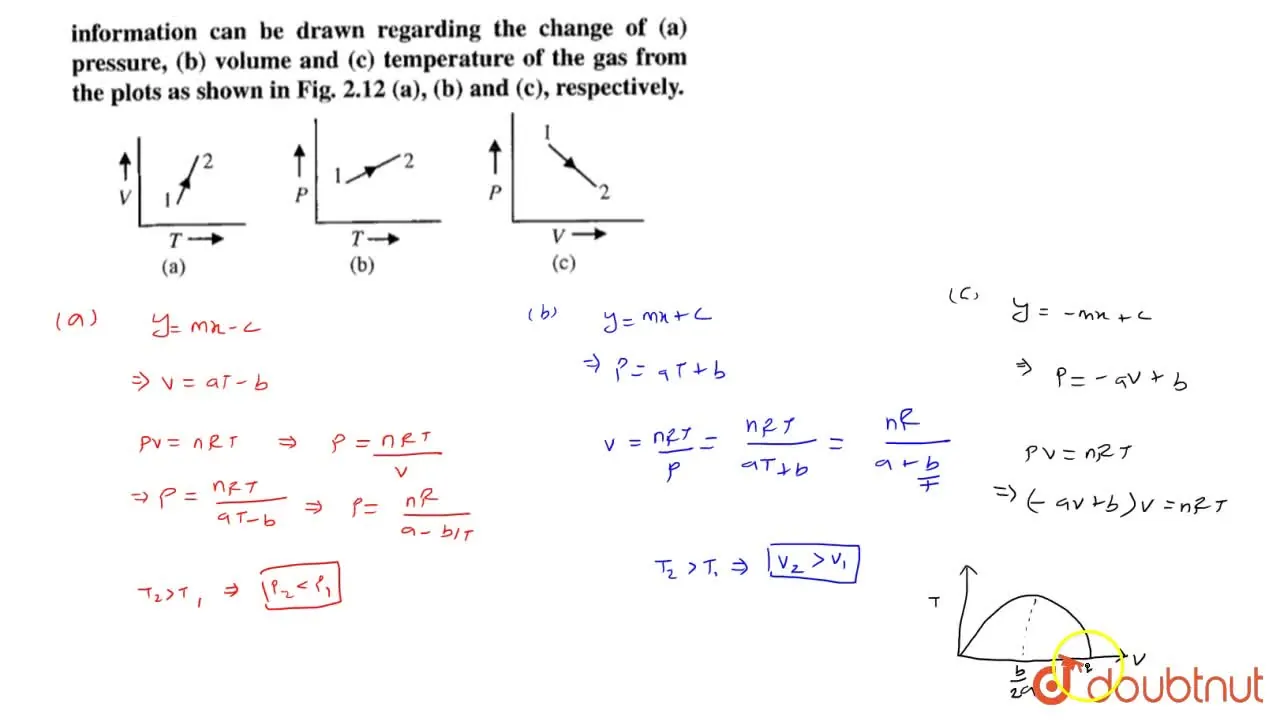
The three diagrams below depict three different processes for a given mass of an ideal gas. What information can be drawn regarding the change of (a) pressure, (b) volume and (c ) temperature of the gas from the plots as shown in Fig., respectively.
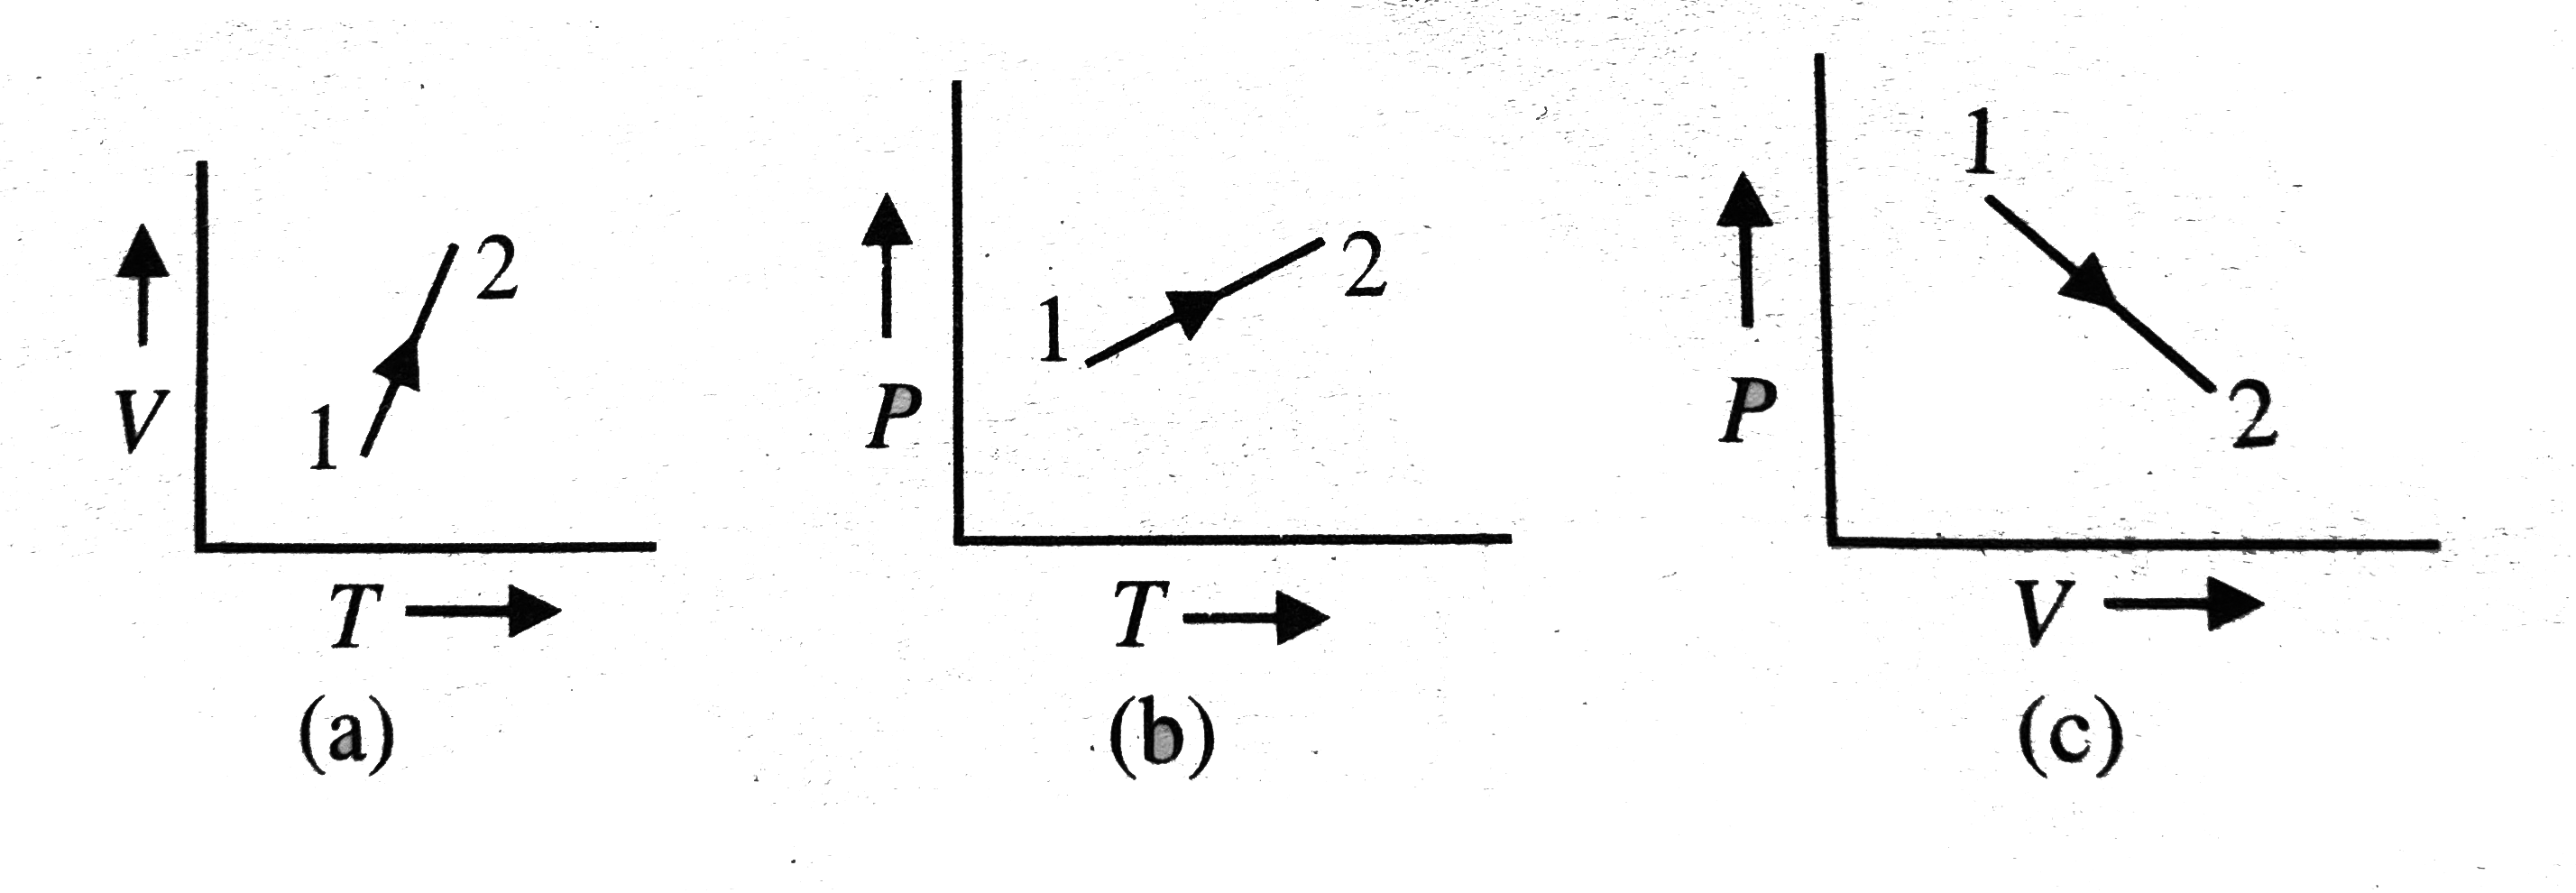
(a) As the given curve is a straight line with positive slope and negative intercept the V-axis, its equation will be
So the gas equation in the light of above yields
Now from Fig. , so .
(b) As the given curve is straight line with positive slope and positive intercept with the P-axis, its equation will be
So the gas equation in the light of above yeilds
Now from Fig. so .
(c ) As the given curve is a straight line with negative slope and positive intercept with the P-axis, its equation will be
So the gas equation in the light of above yields
.
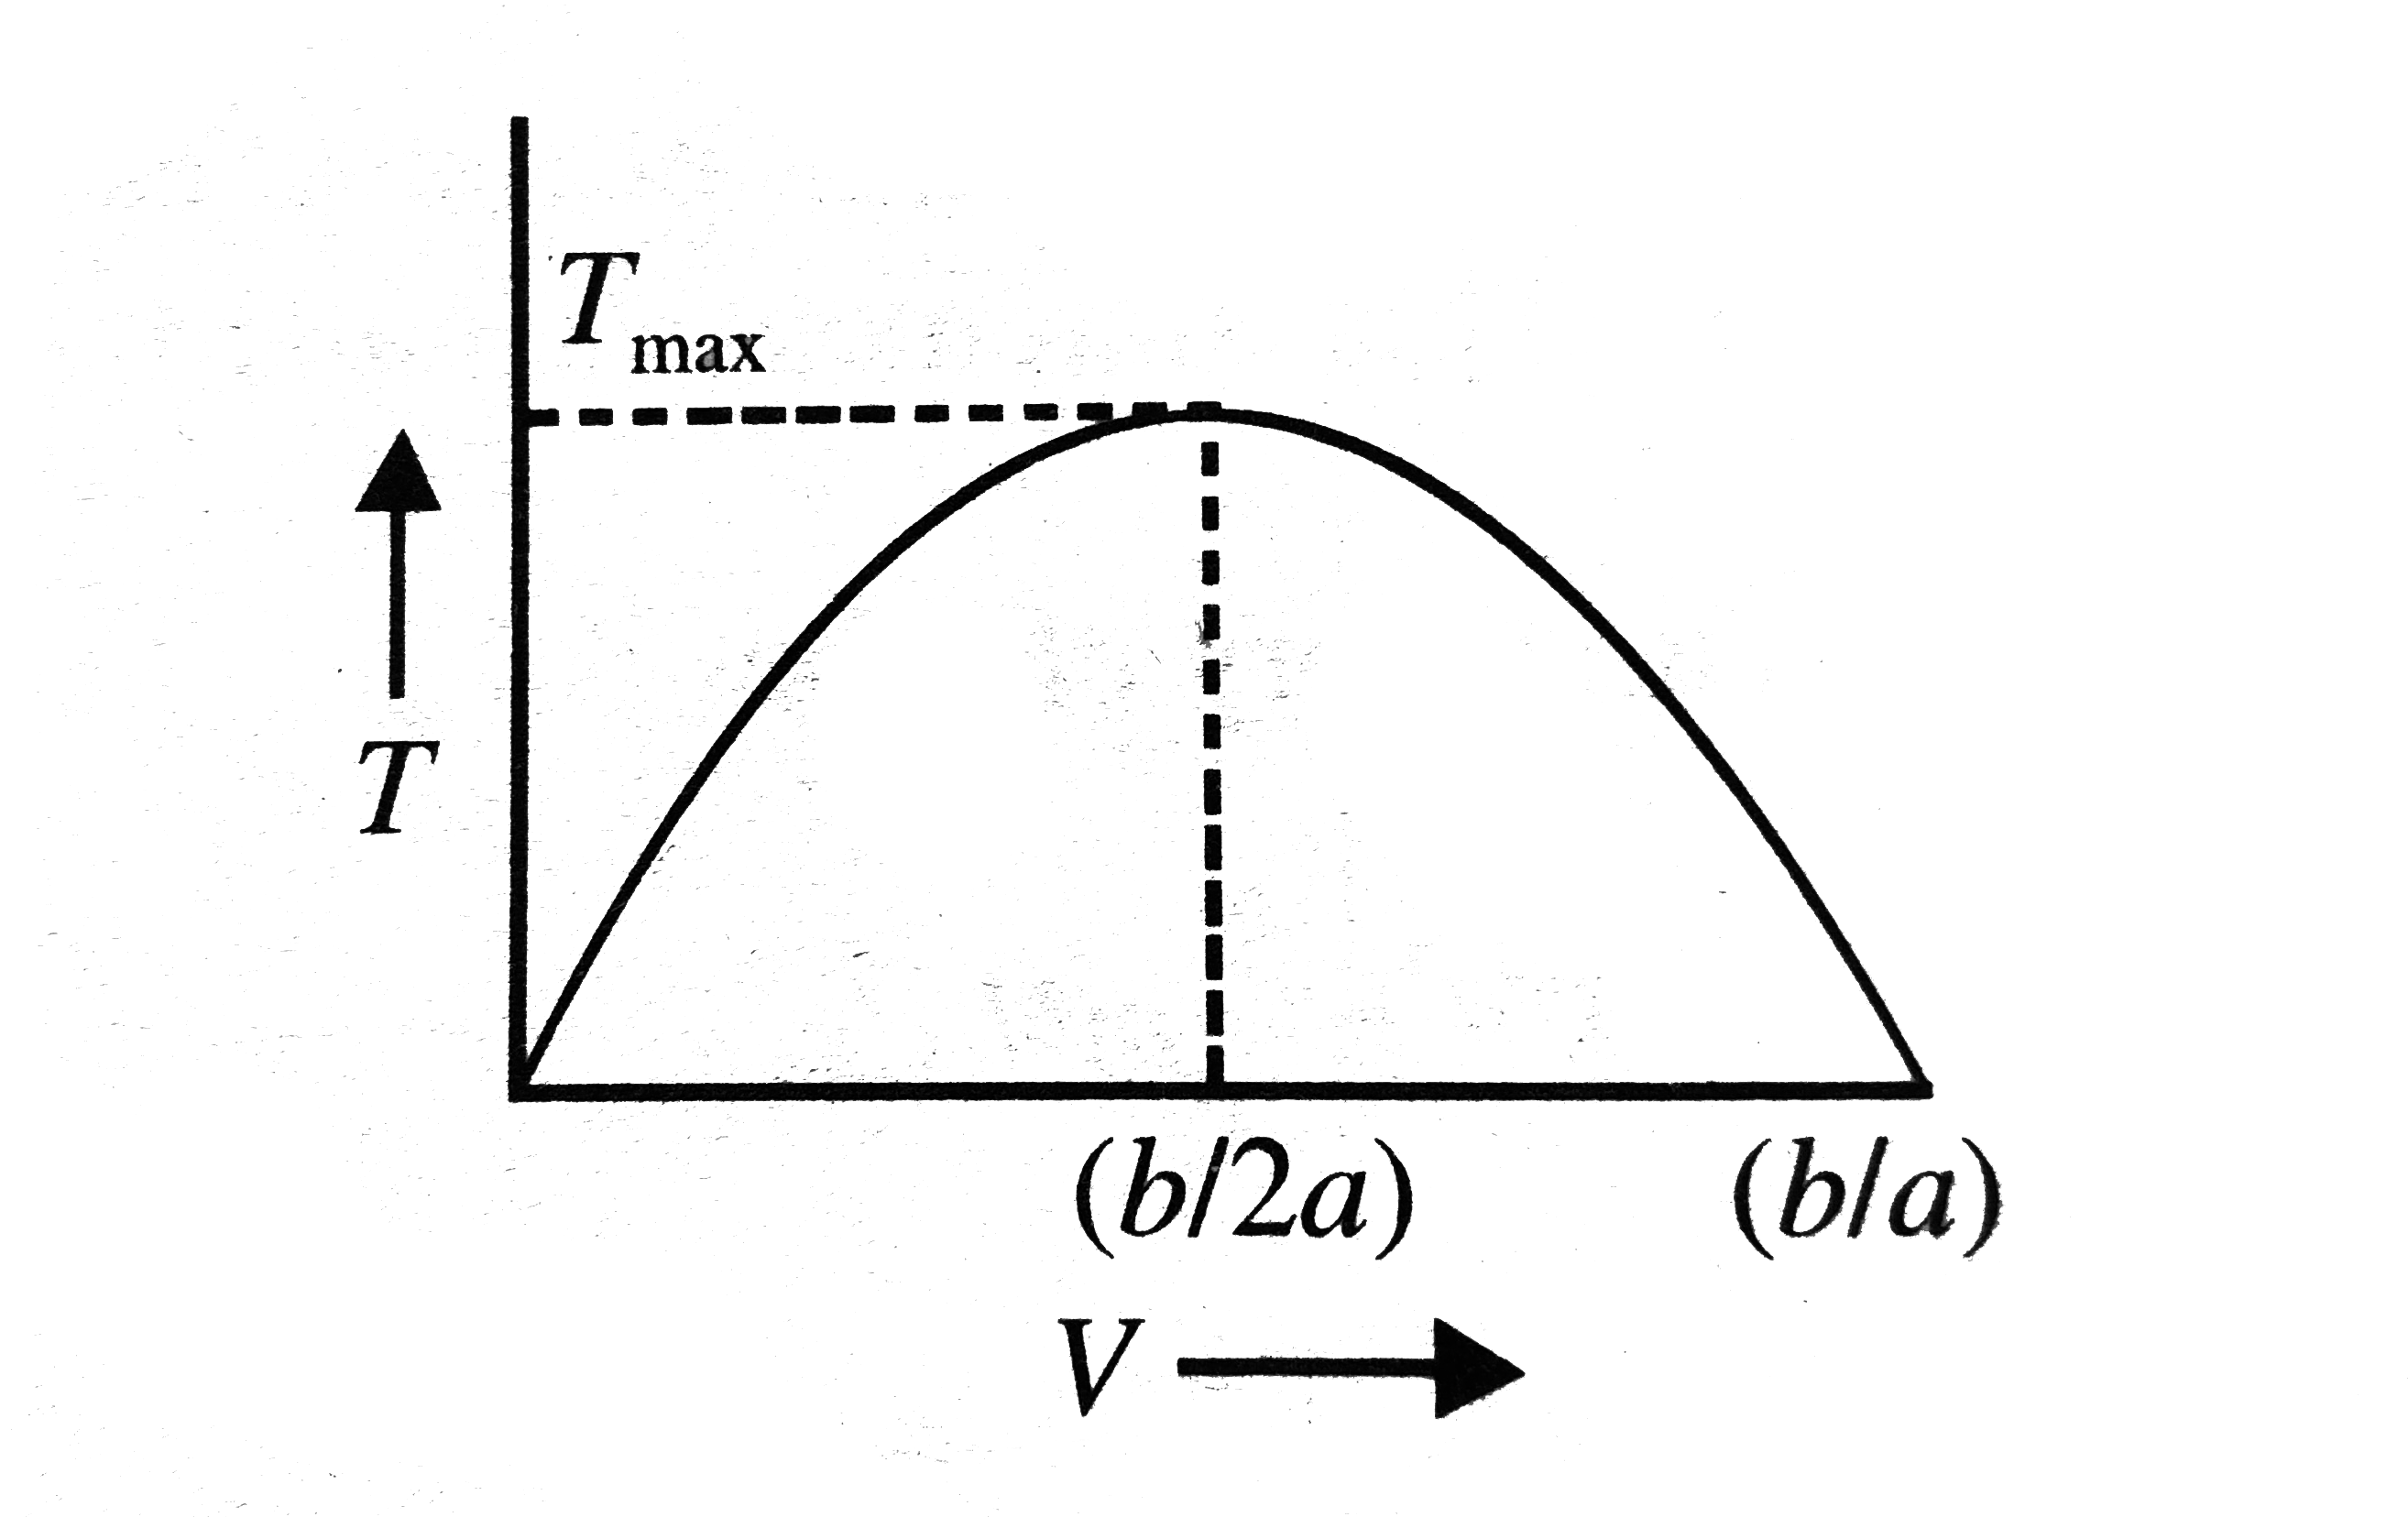
This is the equation of a parabola as shown in Fig. So during expansion, the temperature of gas first increases, reach a maximum and then decreases.
Related Playlists
- BOOK - CENGAGE PHYSICSCHAPTER - KINETIC THEORY OF GASES AND FIRST LAW OF THERMODYNAMICSEXERCISE - Solved Examples14videos
KINETIC THEORY OF GASES AND FIRST LAW OF THERMODYNAMICS
- BOOK - CENGAGE PHYSICSCHAPTER - KINETIC THEORY OF GASES AND FIRST LAW OF THERMODYNAMICSEXERCISE - Exercise 2.120videos
KINETIC THEORY OF GASES AND FIRST LAW OF THERMODYNAMICS
- BOOK - CENGAGE PHYSICSCHAPTER - KINETIC THEORY OF GASESEXERCISE - Compression2videos
KINETIC THEORY OF GASES
- BOOK - CENGAGE PHYSICSCHAPTER - LINEAR AND ANGULAR SIMPLE HARMONIC MOTIONEXERCISE - Multiple Correct Answer Type9videos
LINEAR AND ANGULAR SIMPLE HARMONIC MOTION
Similar Questions
The figures given below depict different processes for a given amount of an ideal gas.
 View Solution
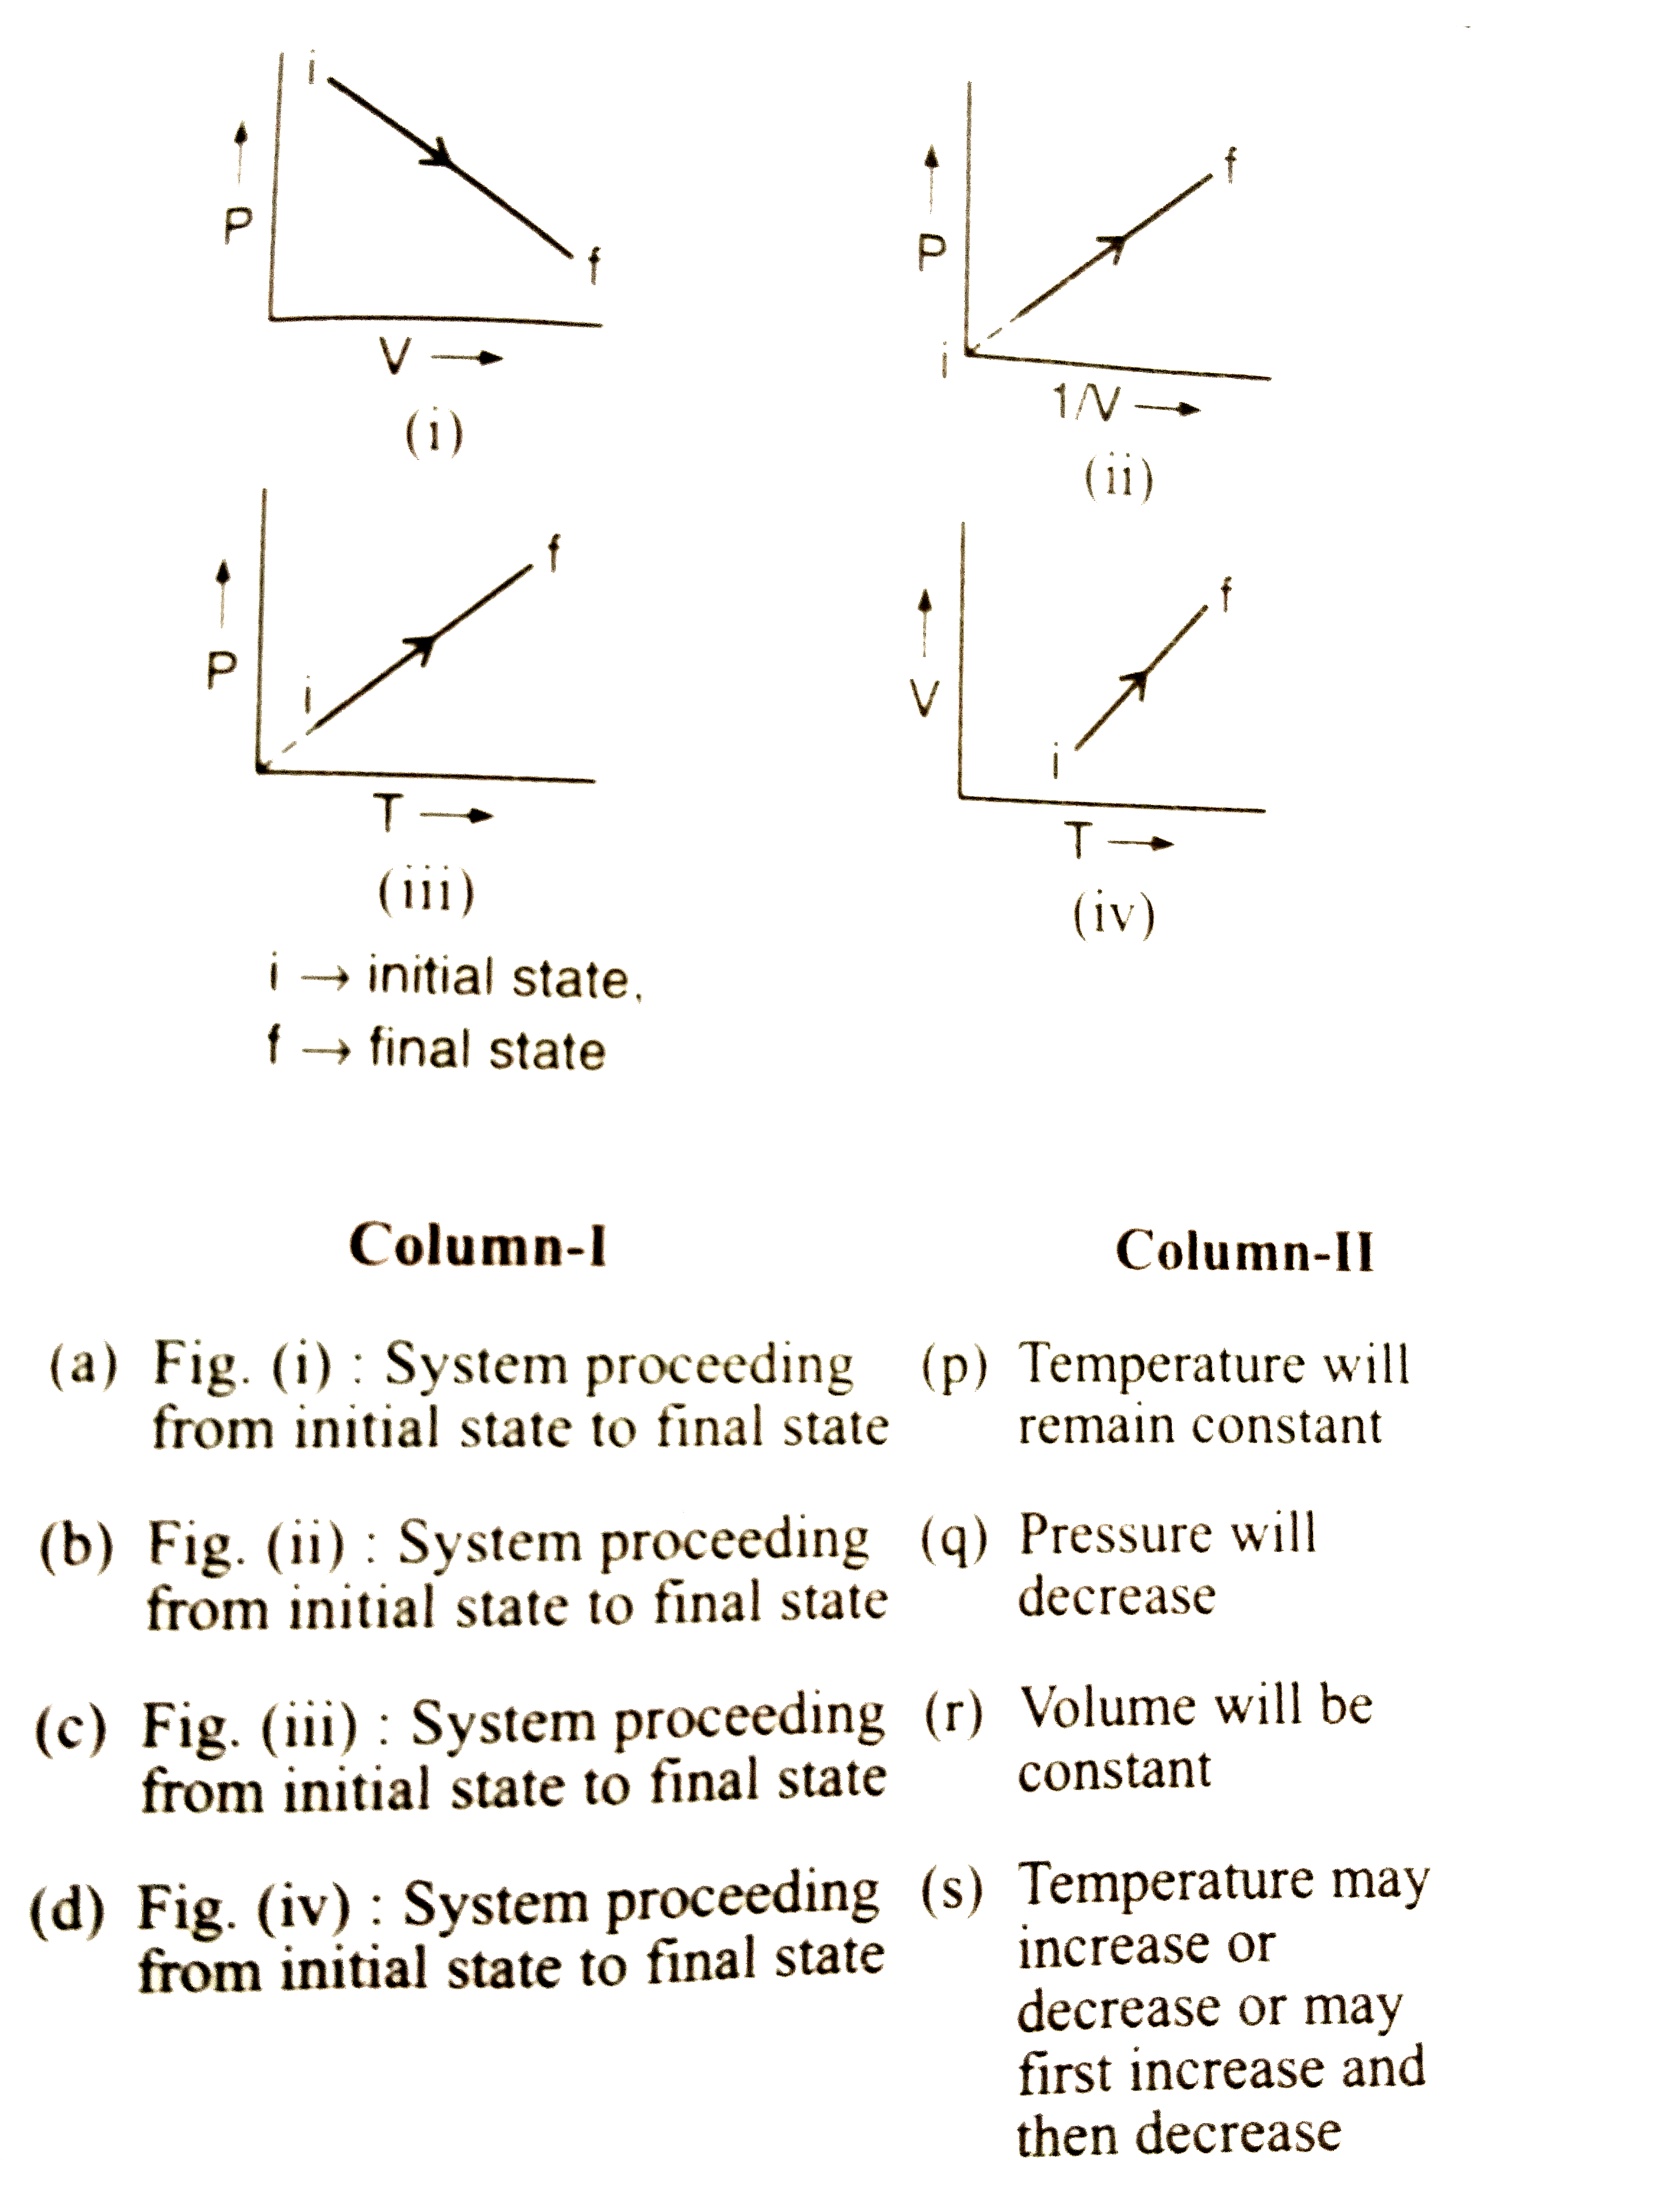
The diagrams below depict the different process for a give amount of an ideal gas. Match the column -I with Column-II
 View Solution
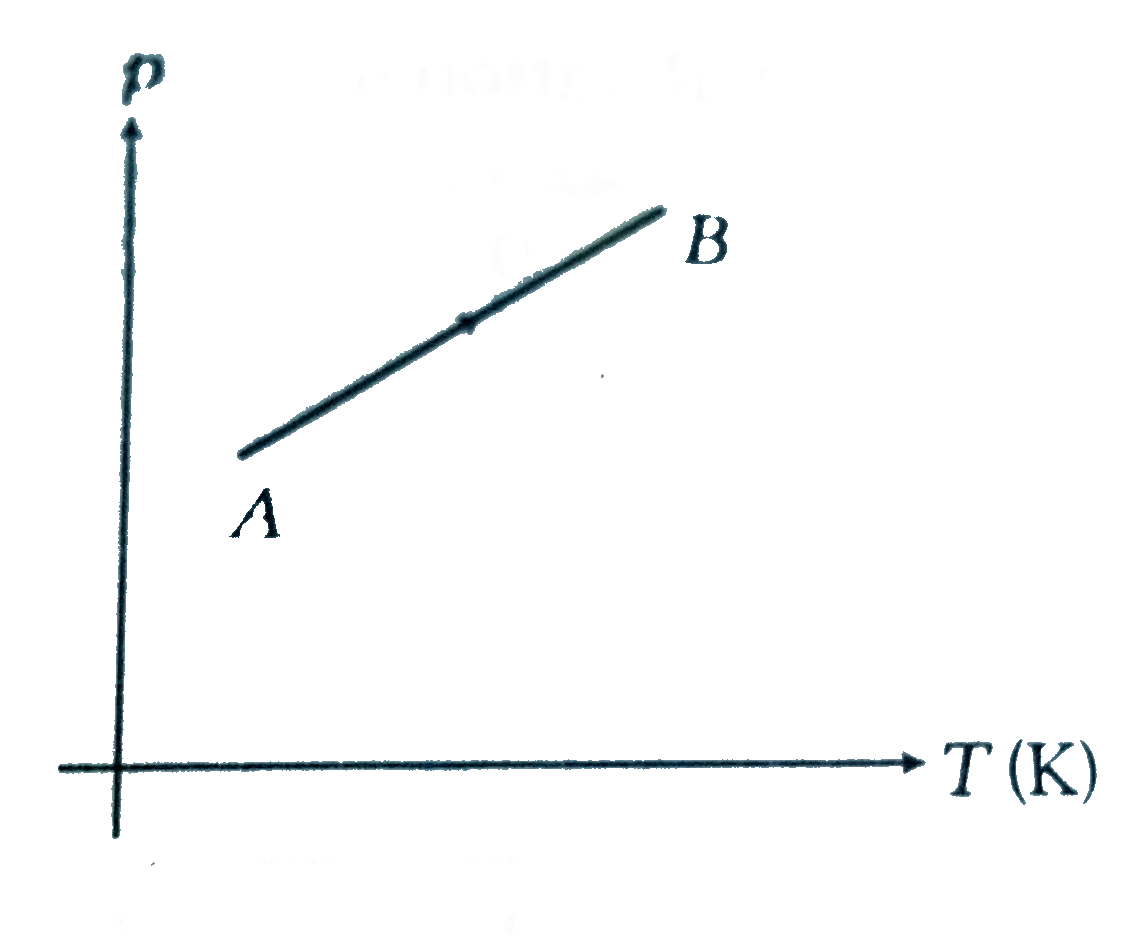
The p−T graph for the given mass of an ideal gas is shown in figure. What inference can be drawn regarding the change in Volume (whtherit is constant, increasing or decreasing) ?
 View Solution
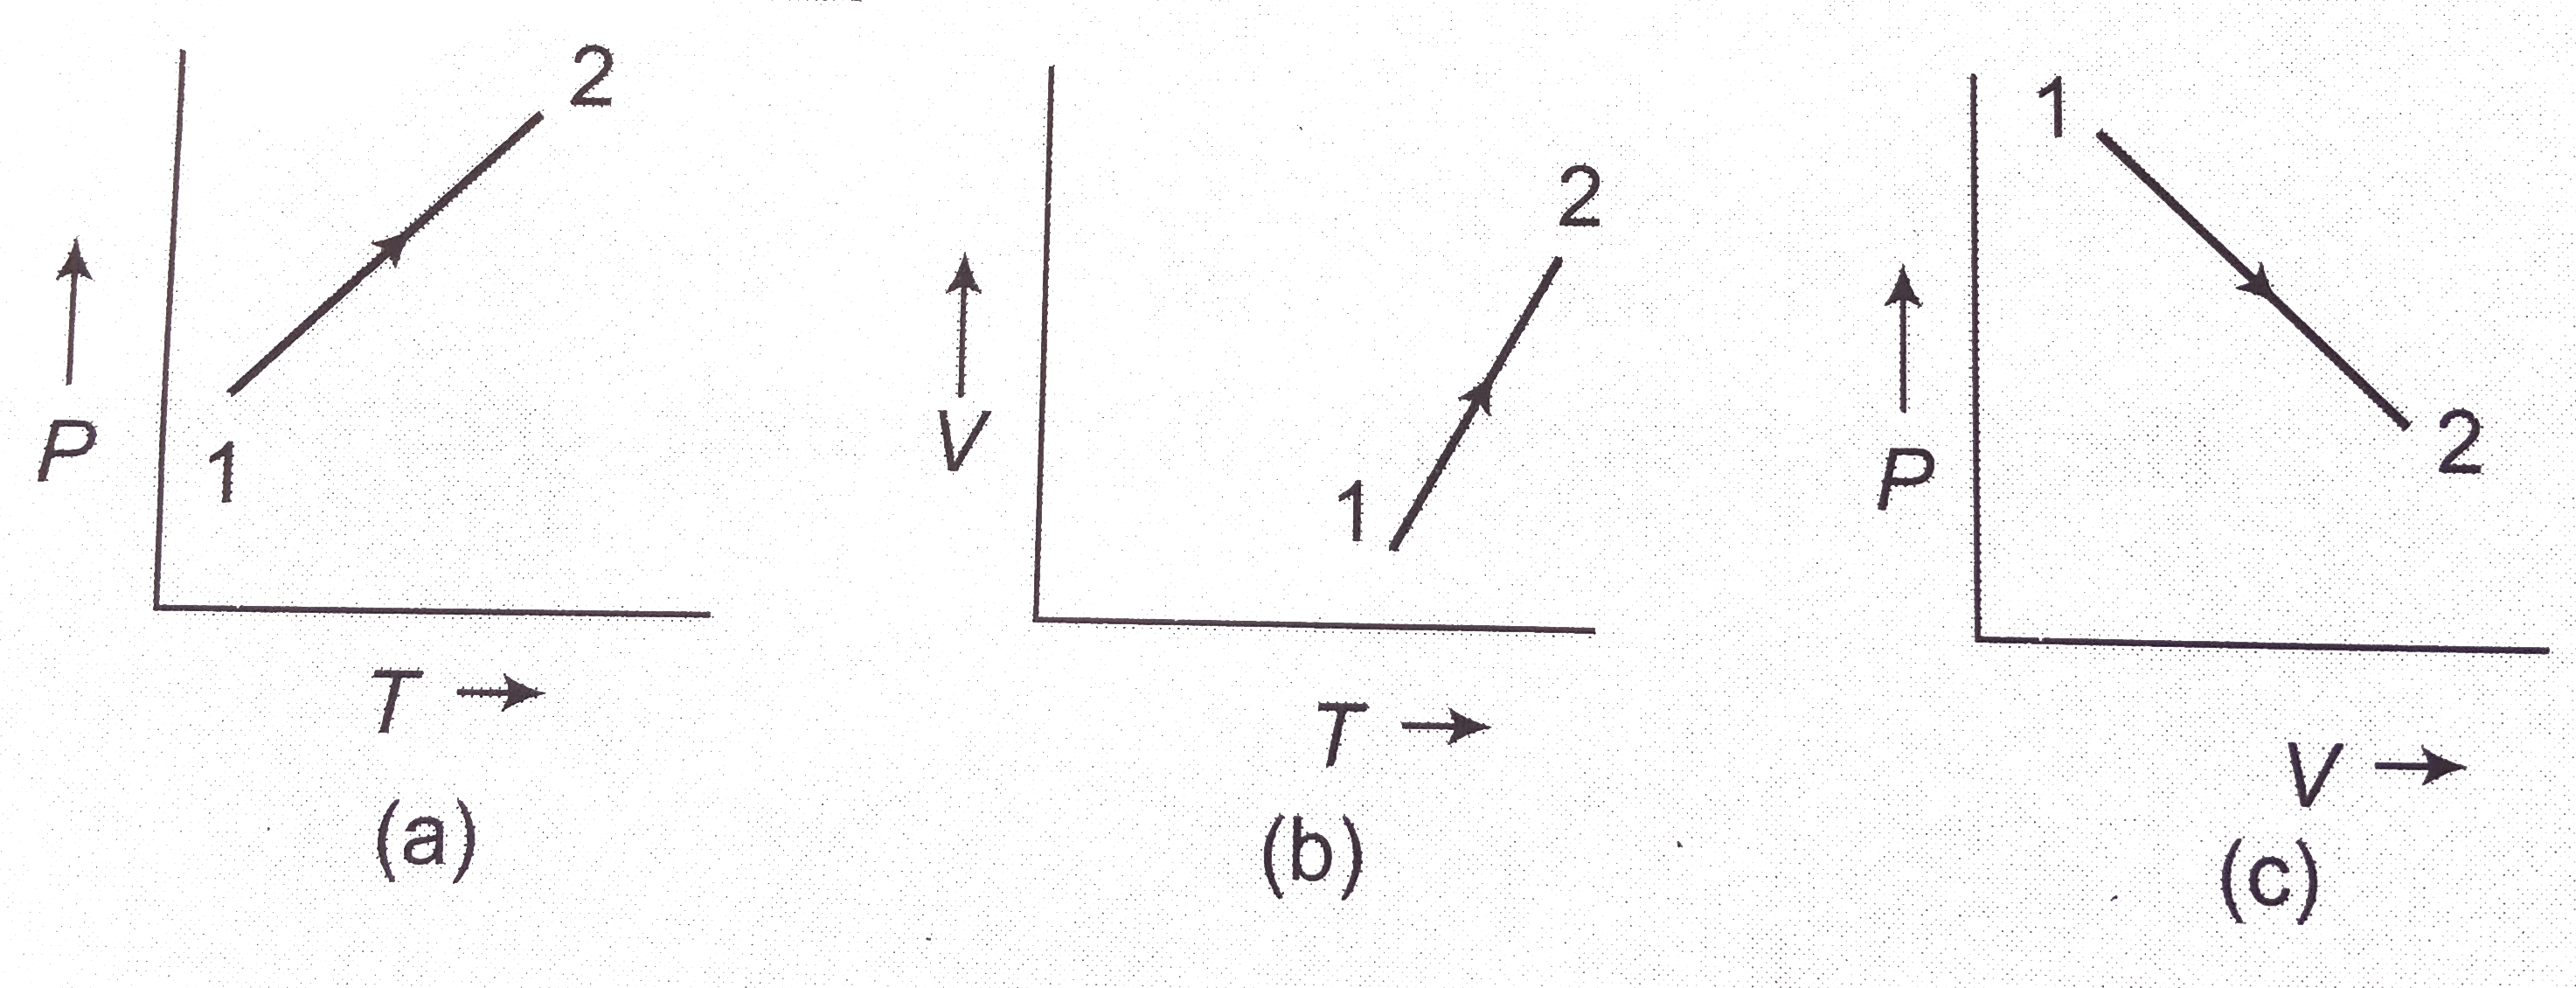
For given mass of an ideal gas, consider the following diagrams
What is variation of volume in (a), pressure in (b) and temperature in (c).View SolutionV−T diagram for a process of given mass of ideal gas is as shown in fig. During the process pressure of the gas
_E01_072_Q01.png) View Solution
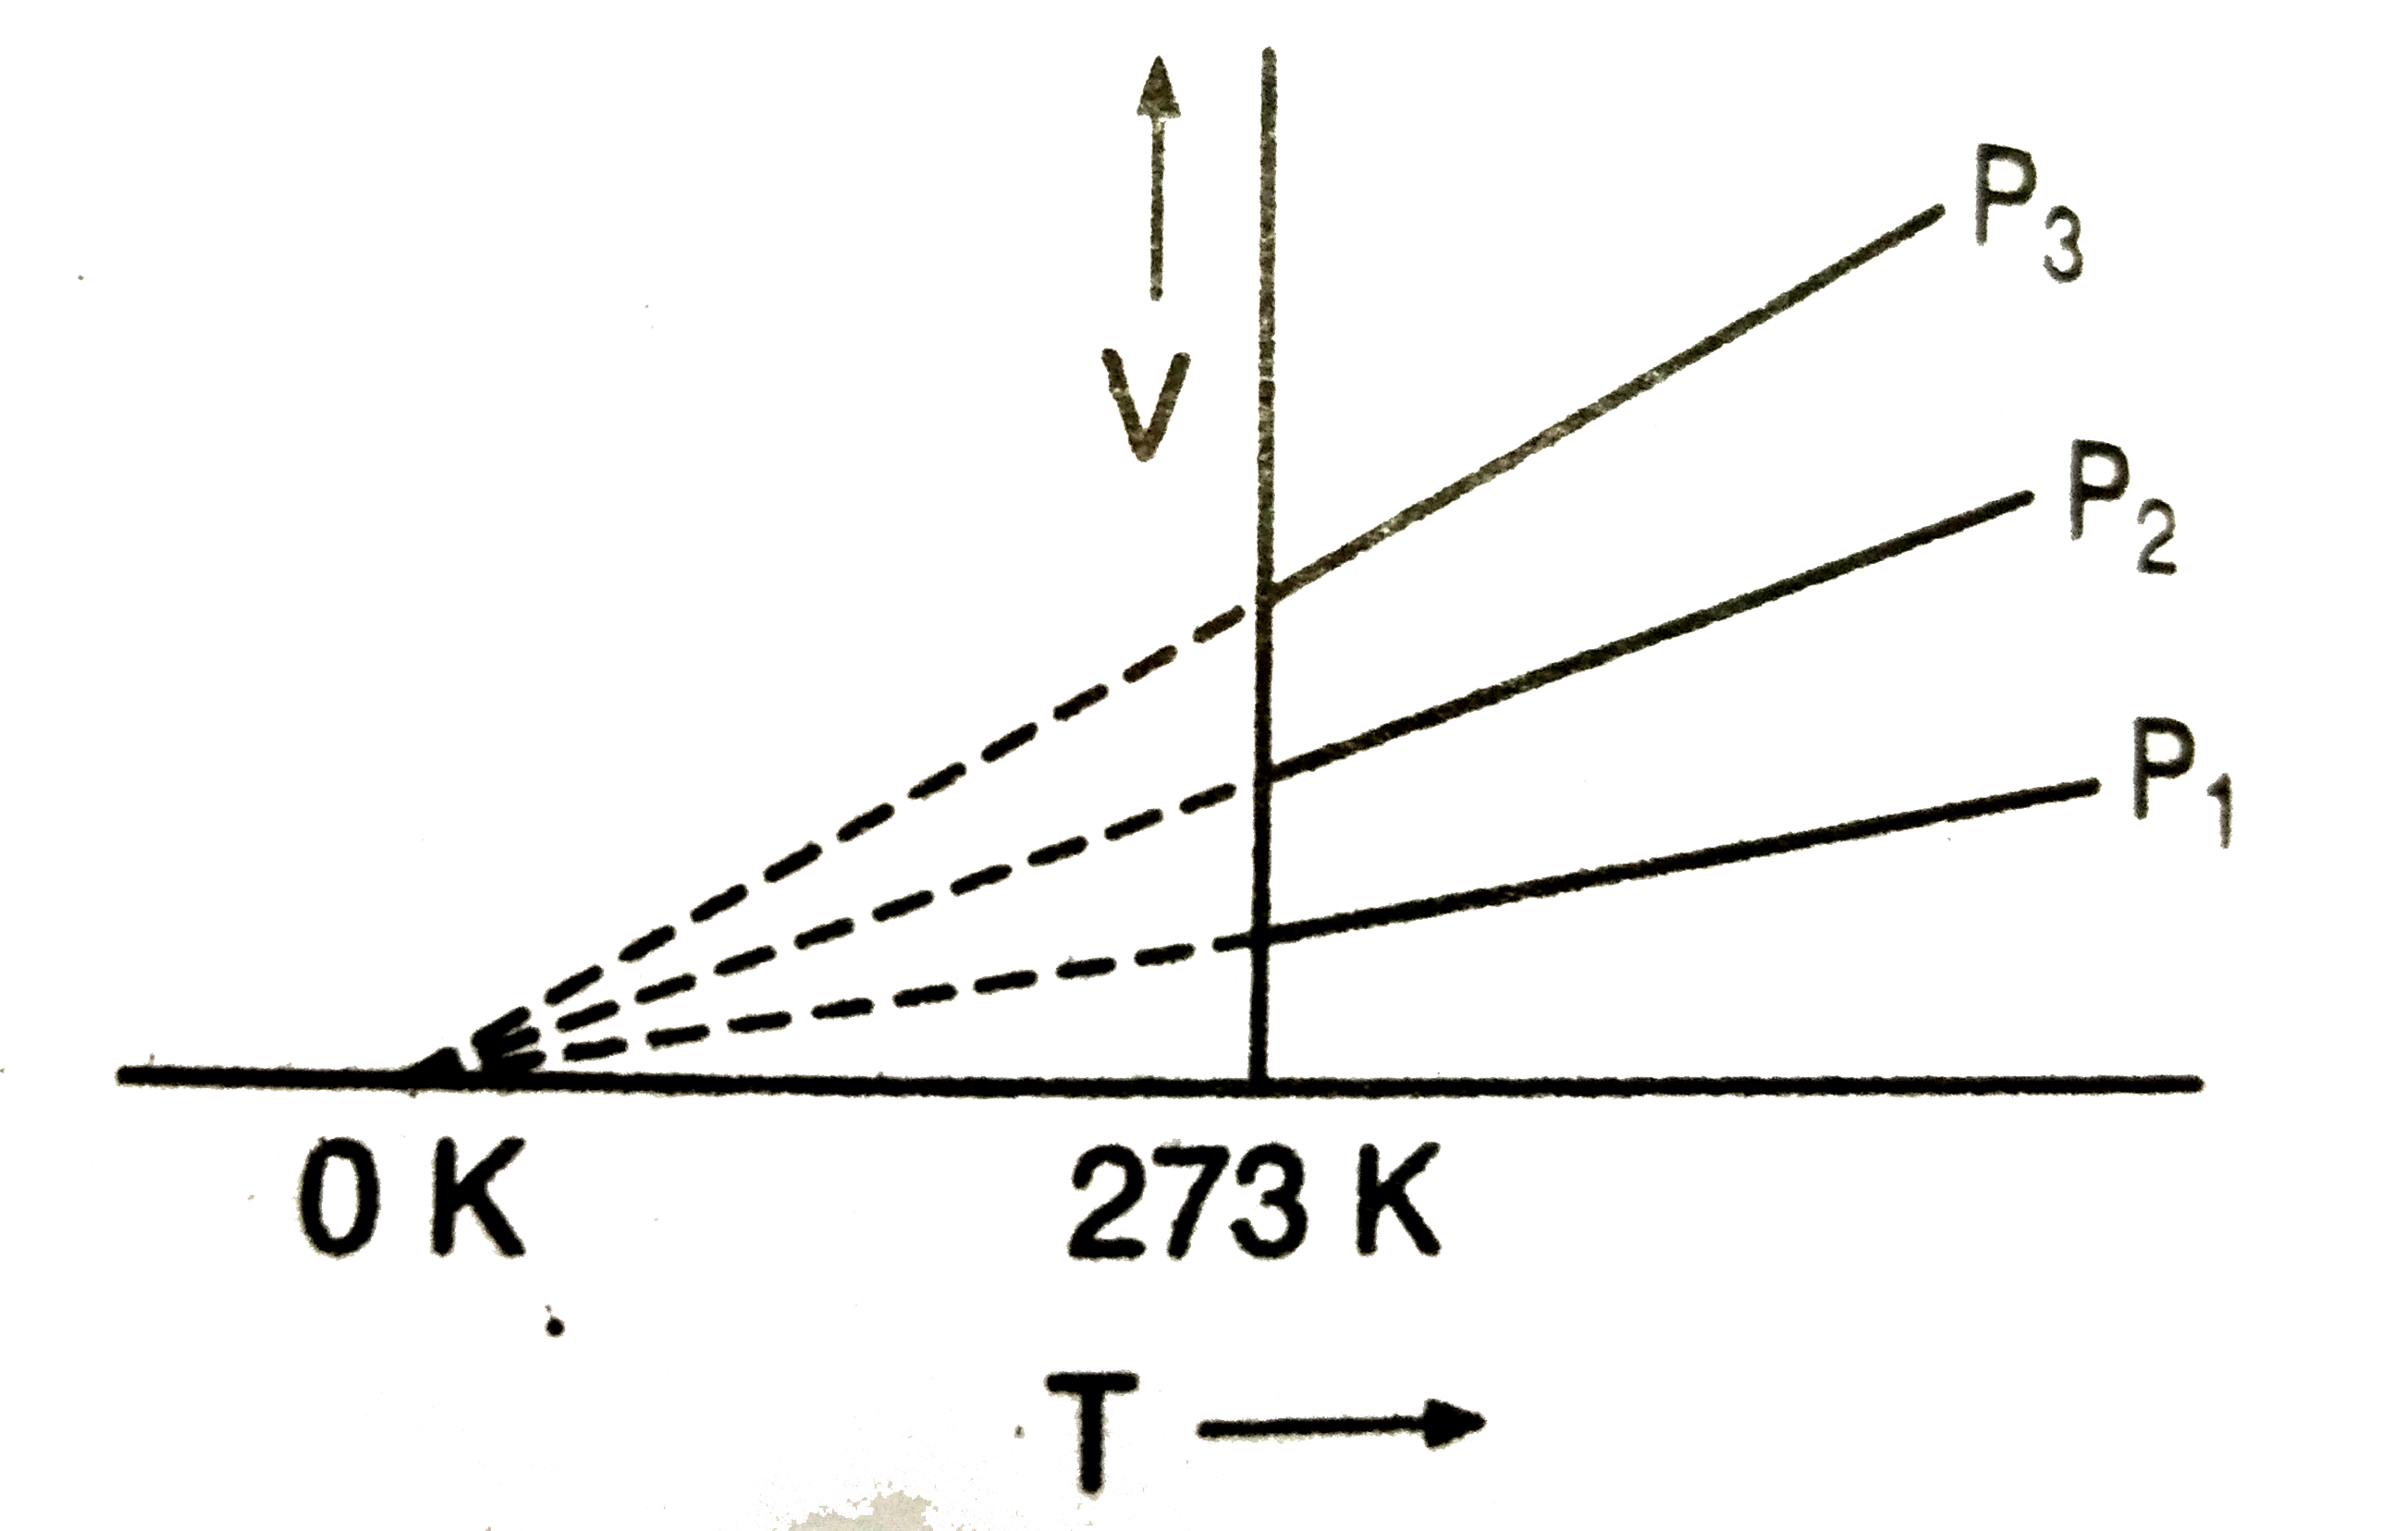
View SolutionThe volume-temperature graphs of a given mass of an ideal gas at constant pressure are shown below. What is the correct order of pressure ?
 View Solution
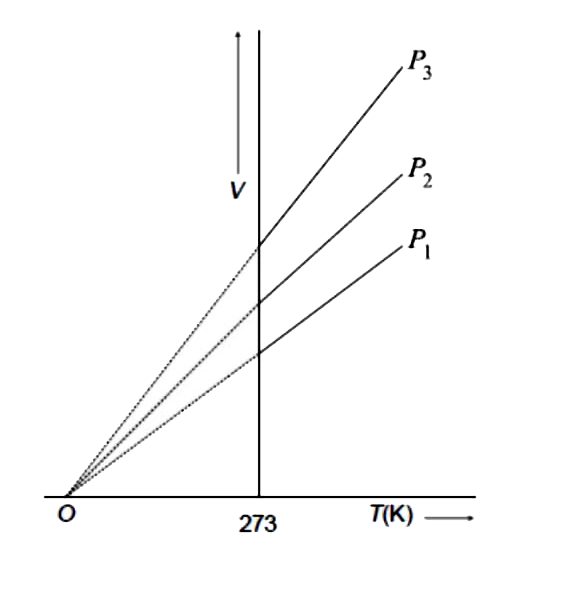
The volume-temperature graphs of a given mass of an ideal gas at constant pressures are shown below. What is the correct order of pressures ?
 View Solution
The raise in the temperature of a given mass of an ideal gas at constant pressure and at temperature 27∘ to double its volume is
View SolutionThe volume of a given mass of a gas in a vessel is reduced to half at constant temperature what is the change in pressure?
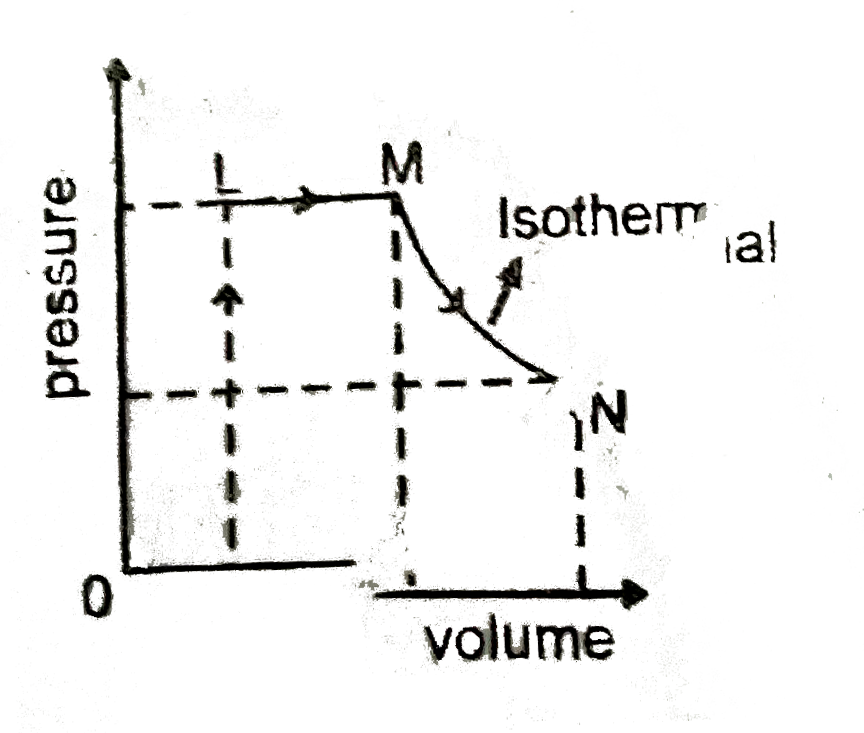
View SolutionA fixed mass of an ideal gas undergoes changes of pressure and volume starting at L, as shown in Figure. Which of the the following is correct:
 View Solution

