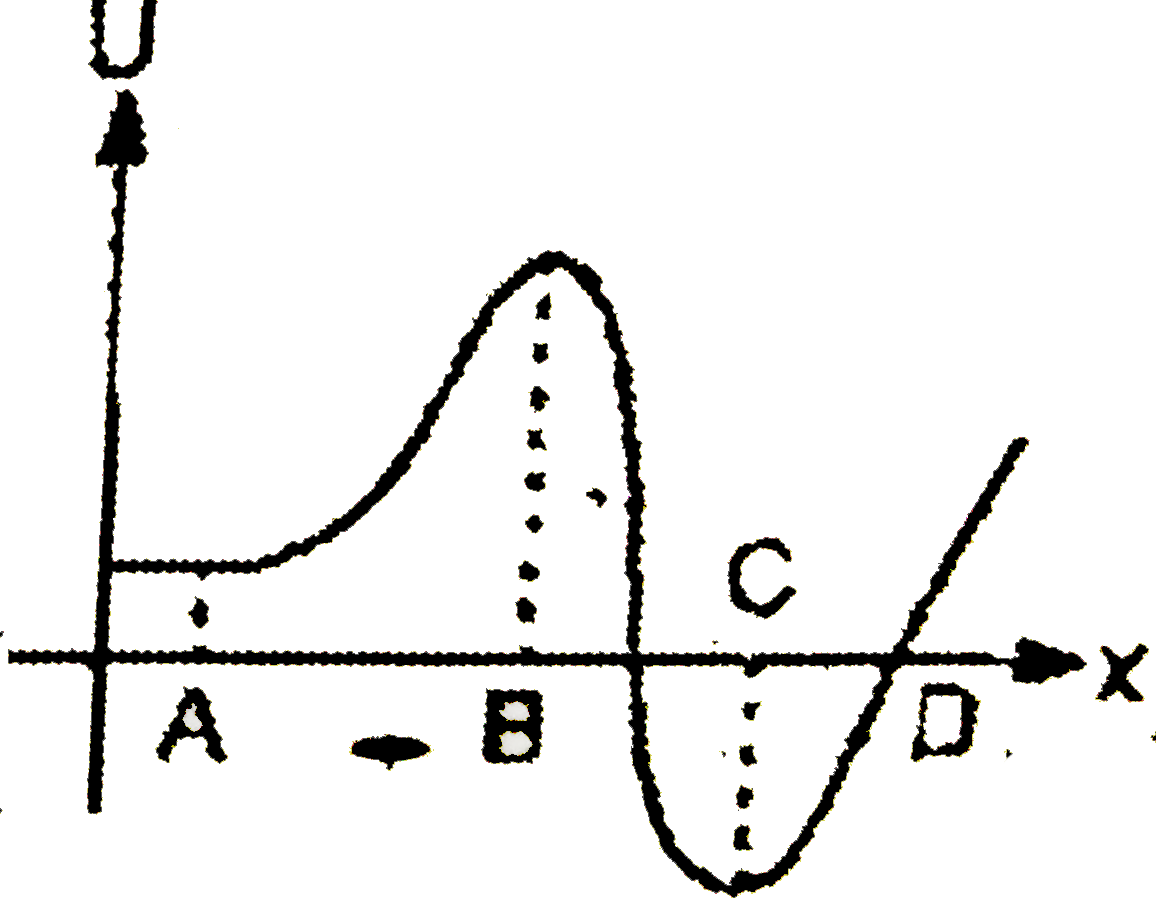
The following plot shows the variation of potential energy (U) of a system versus position (x). From the graph we can interpret that :

Point D is position of neutral equilibrium
Point B is position of unstable equilibrium
Point C is position of stable equilibrium
Point A is position of neutral equilibrium
The correct Answer is:B, C, D
Topper's Solved these Questions
- WORK AND ENERGYBook:ANURAG MISHRAChapter:WORK AND ENERGYExercise:Level 3
Explore 34 Videos
- WORK AND ENERGYBook:ANURAG MISHRAChapter:WORK AND ENERGYExercise:Matching types problems
Explore 14 Videos
- WORK AND ENERGYBook:ANURAG MISHRAChapter:WORK AND ENERGYExercise:Level 1
Explore 53 Videos
- UNIT AND DIMENSIONSBook:ANURAG MISHRAChapter:UNIT AND DIMENSIONSExercise:Matching Type Problem
Explore 4 Videos
Similar Questions
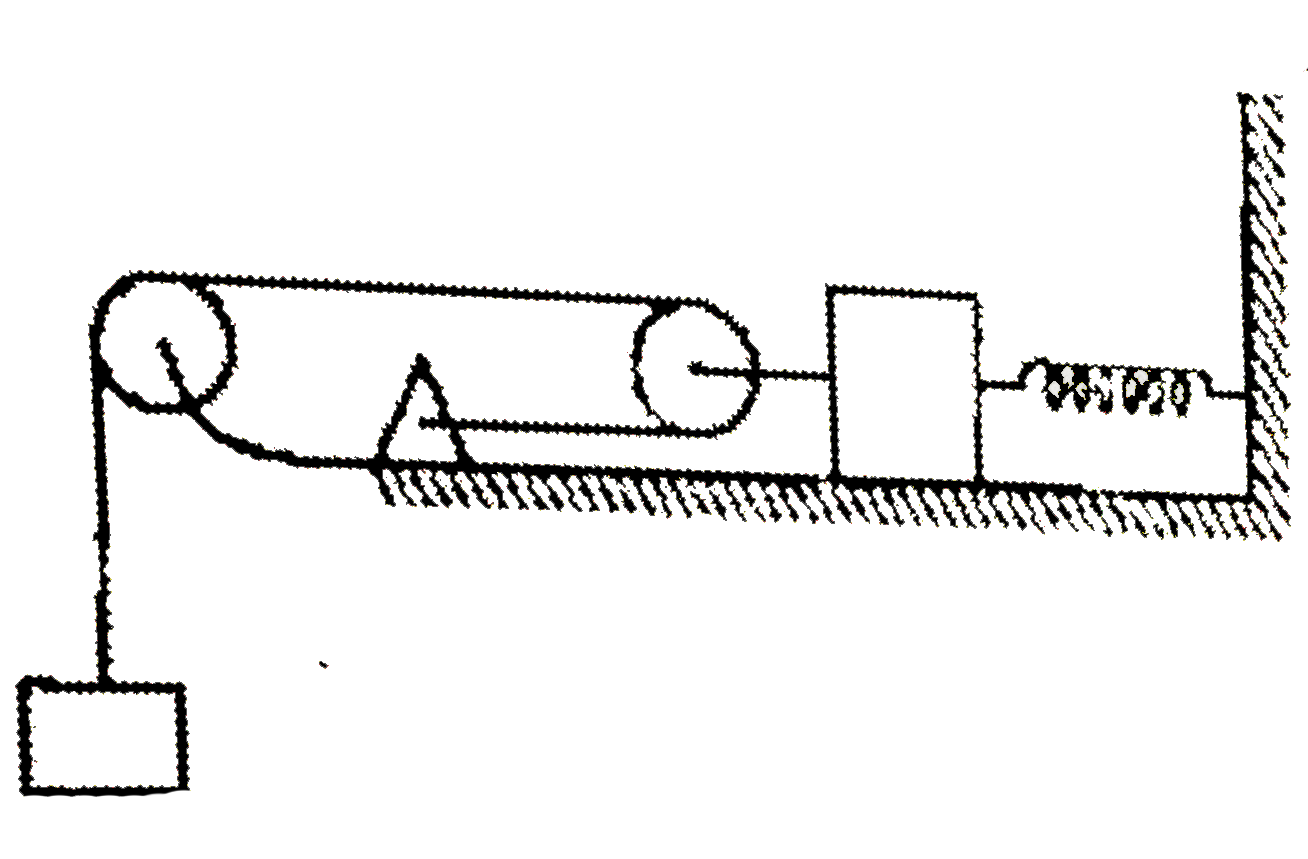
In the shown figure, the spring and string is ideal. The spring the stiffness of 100N/m and m=1kg friction exists between mass 2m and surface with coefficient μ=0.8. The system is released with spring from its relaxed position. Based on above data, answer the following question: (take g=10m/s2)

Maximum extension in spring is :
View SolutionMatch the following :
Column-I Column-II(A)Work done by all the forces(P)Change in potential energy(B)Work done by conservative forces(Q) Change in kinetic energy(C)Work done by external forces(R) Change in mechanical energy(S) None
View SolutionA small block of mass m is kept on a rough inclined surface of inclination θ fixed in an elevator. The elevator goes up with a uniform velocity v and te block does not slide n te wedge. The work done by the force of friction on the block in time t will be
View SolutionMatch the column :
Column-I (Quantity)Column-II(Unit)(a)Energy density (Energy per unit volume)(p)dyne/cm2(b)Force constant of a spring(r)kg−m/s(c)Pressure(r)erg/cm2(s)pascal
View SolutionThe given plot shows the variation of U, the potential energy of interaction between two particles with the distance separating them r,
View SolutionIdentify the correct variation of potential energy U as a function of displacement x from mean position (or x^(2) ) of a harmonic oscillator ( U at mean position = 0 )
View SolutionPotential Energy U(x) and associated force F(x) bears the relation F(x)=−ddxU(x).
Dependence of potential energy of a two−particle system separation x between them is shown in the following figure.

Which of the following graphs shows correct variation in assoicated force F(x) with x?
View SolutionPlot a graph showing variation of current versus voltage for the material Ga.
View SolutionPlot a graph showing variation of current versus voltage for the material GaAs
View SolutionA particle is placed at the origin and a force F=Kx is acting on it (where k is a positive constant). If U(0)=0, the graph of U(x) verses x will be (where U is the potential energy function.)
View SolutionIn the fig. The potential energy U of a particle plotted against its position x from origin. Which of the following statement is correct
View SolutionThe slope of potential energy versus position graph represents
View SolutionPlot a graph showing variation of current versus voltage for the material Ga.
View SolutionA particle is placed at the origin and a force F=Kx is acting on it (where k is a positive constant). If U(0)=0, the graph of U(x) verses x will be (where U is the potential energy function.)
View SolutionThe given plot shows the variation of U, the potential energy of interaction between two particles with the distance separating them r,
View Solution

