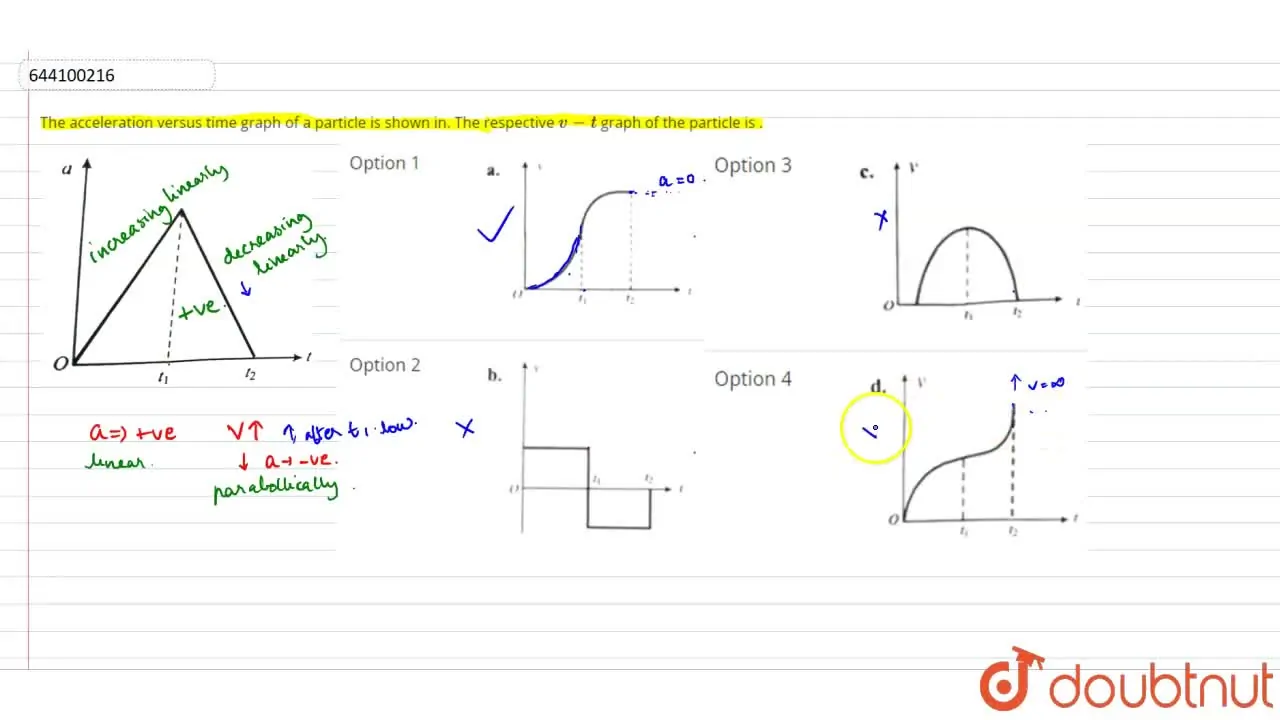
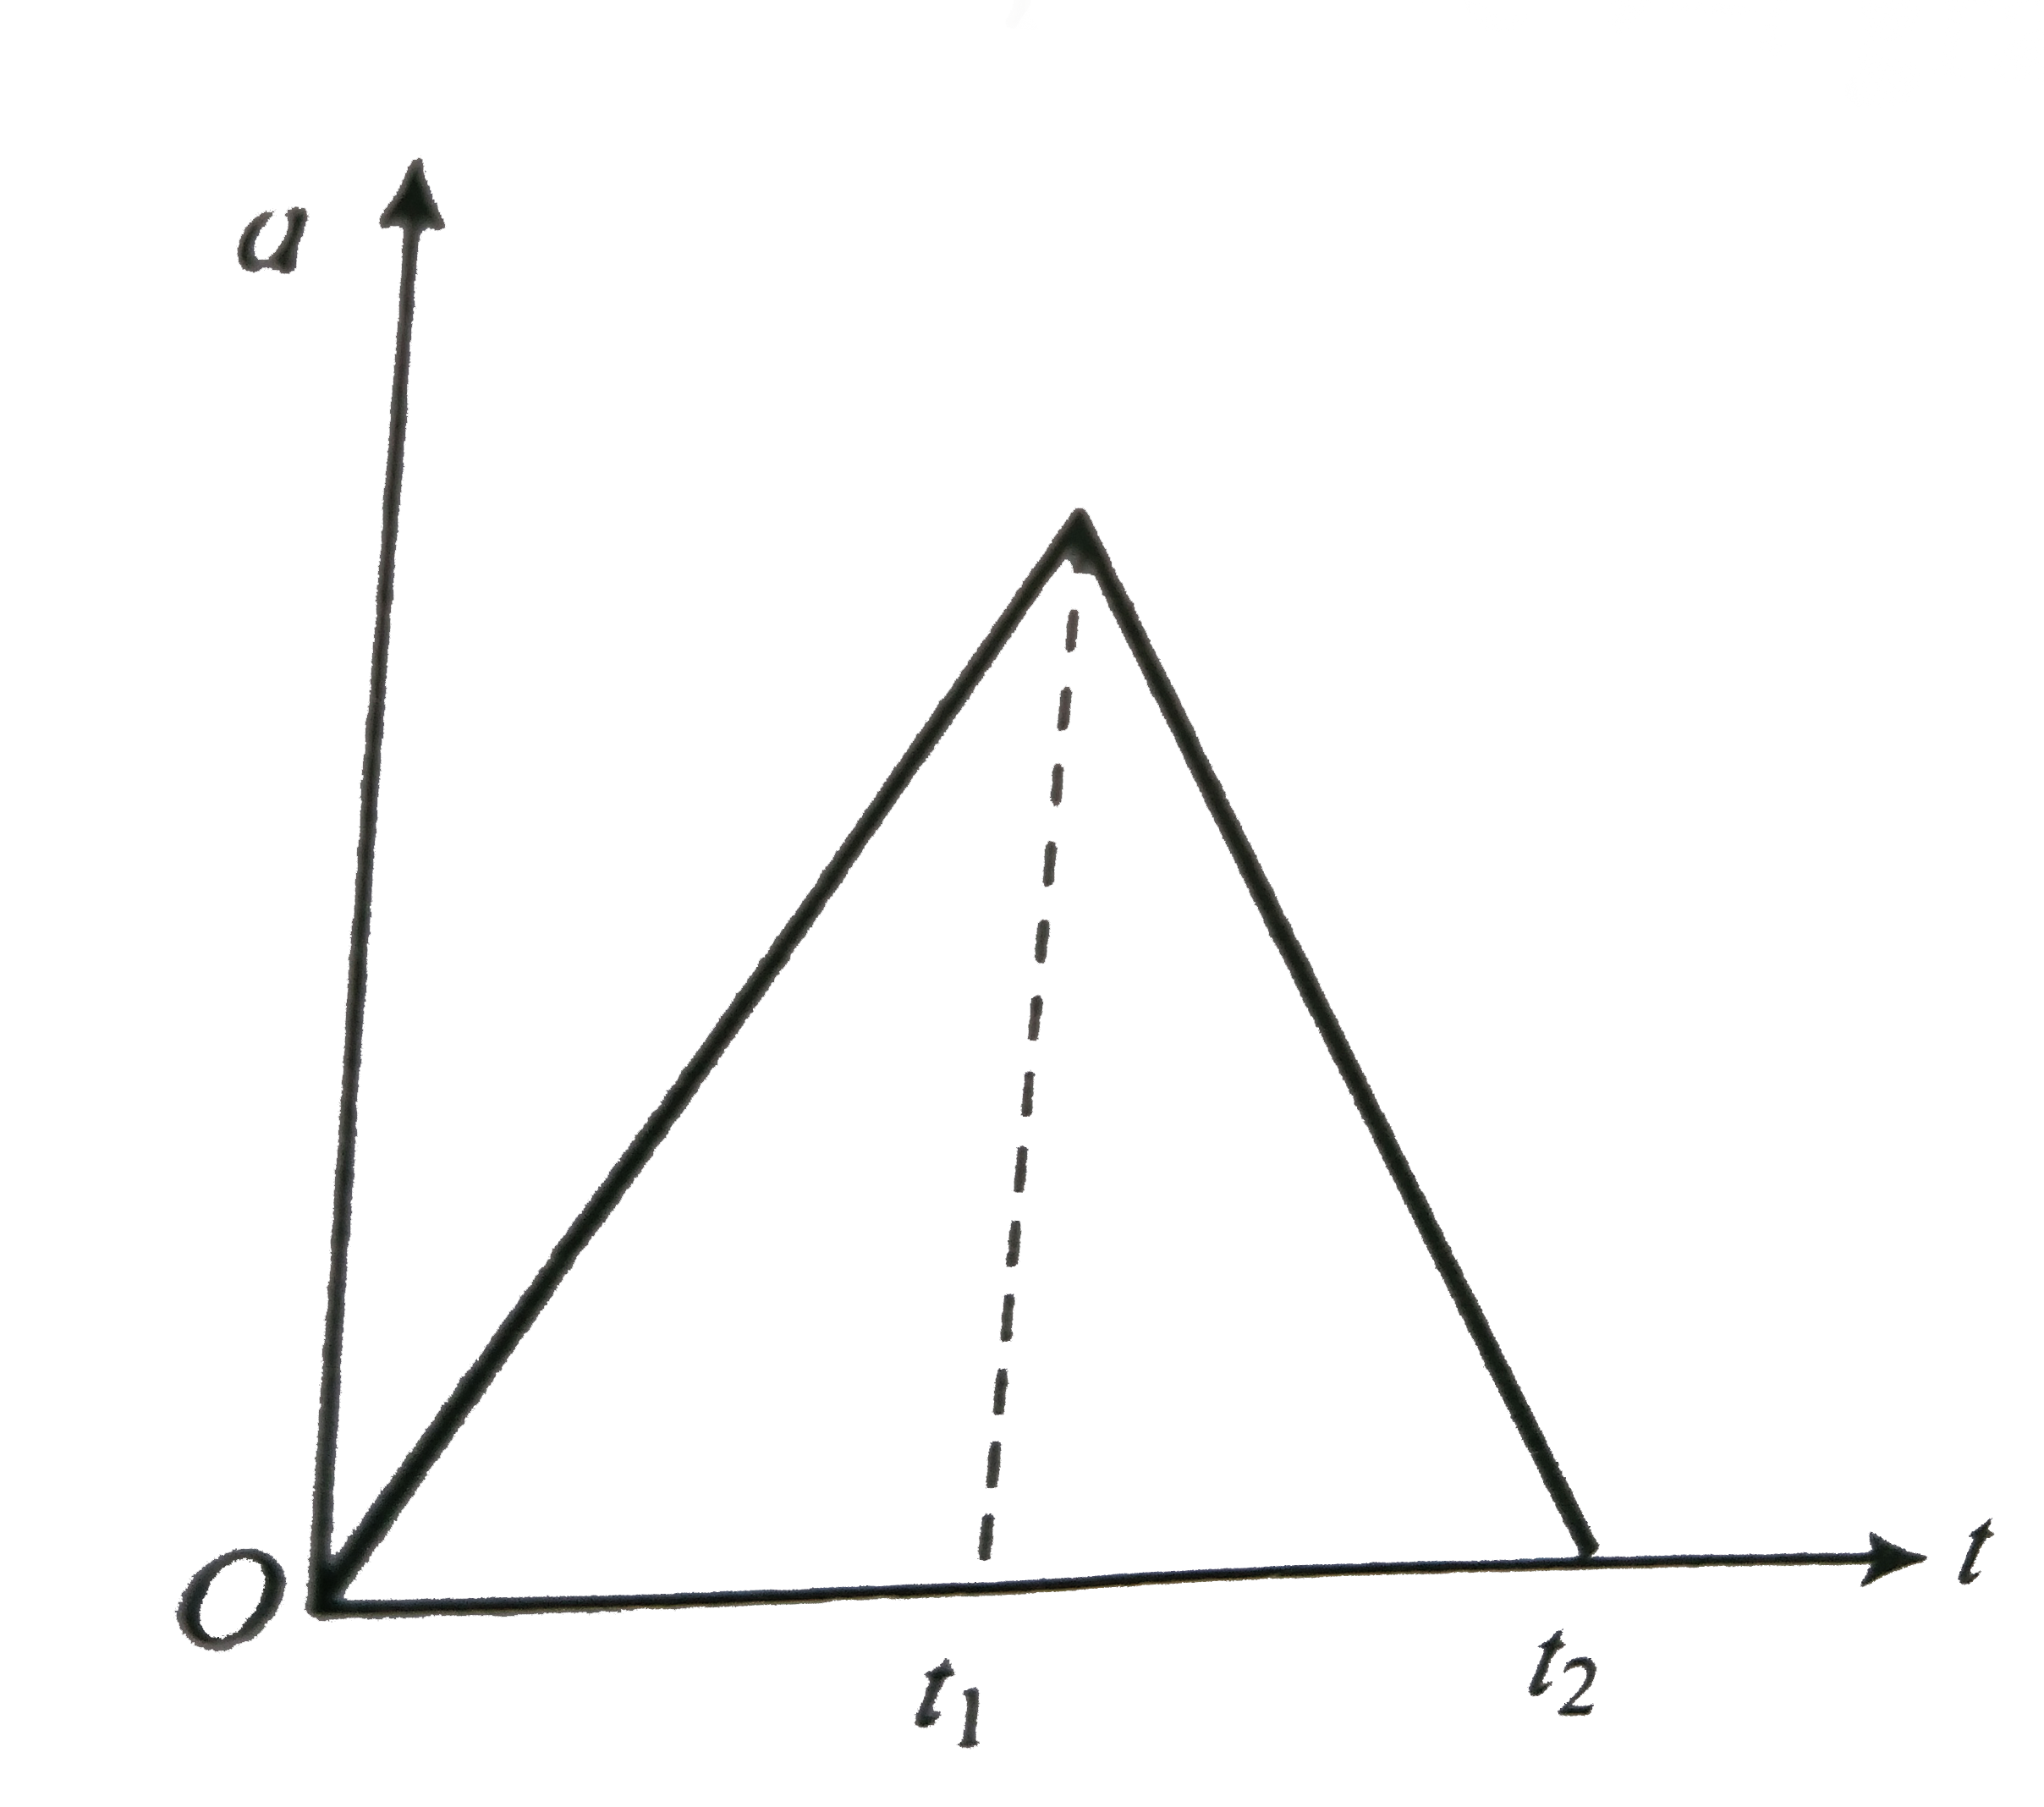
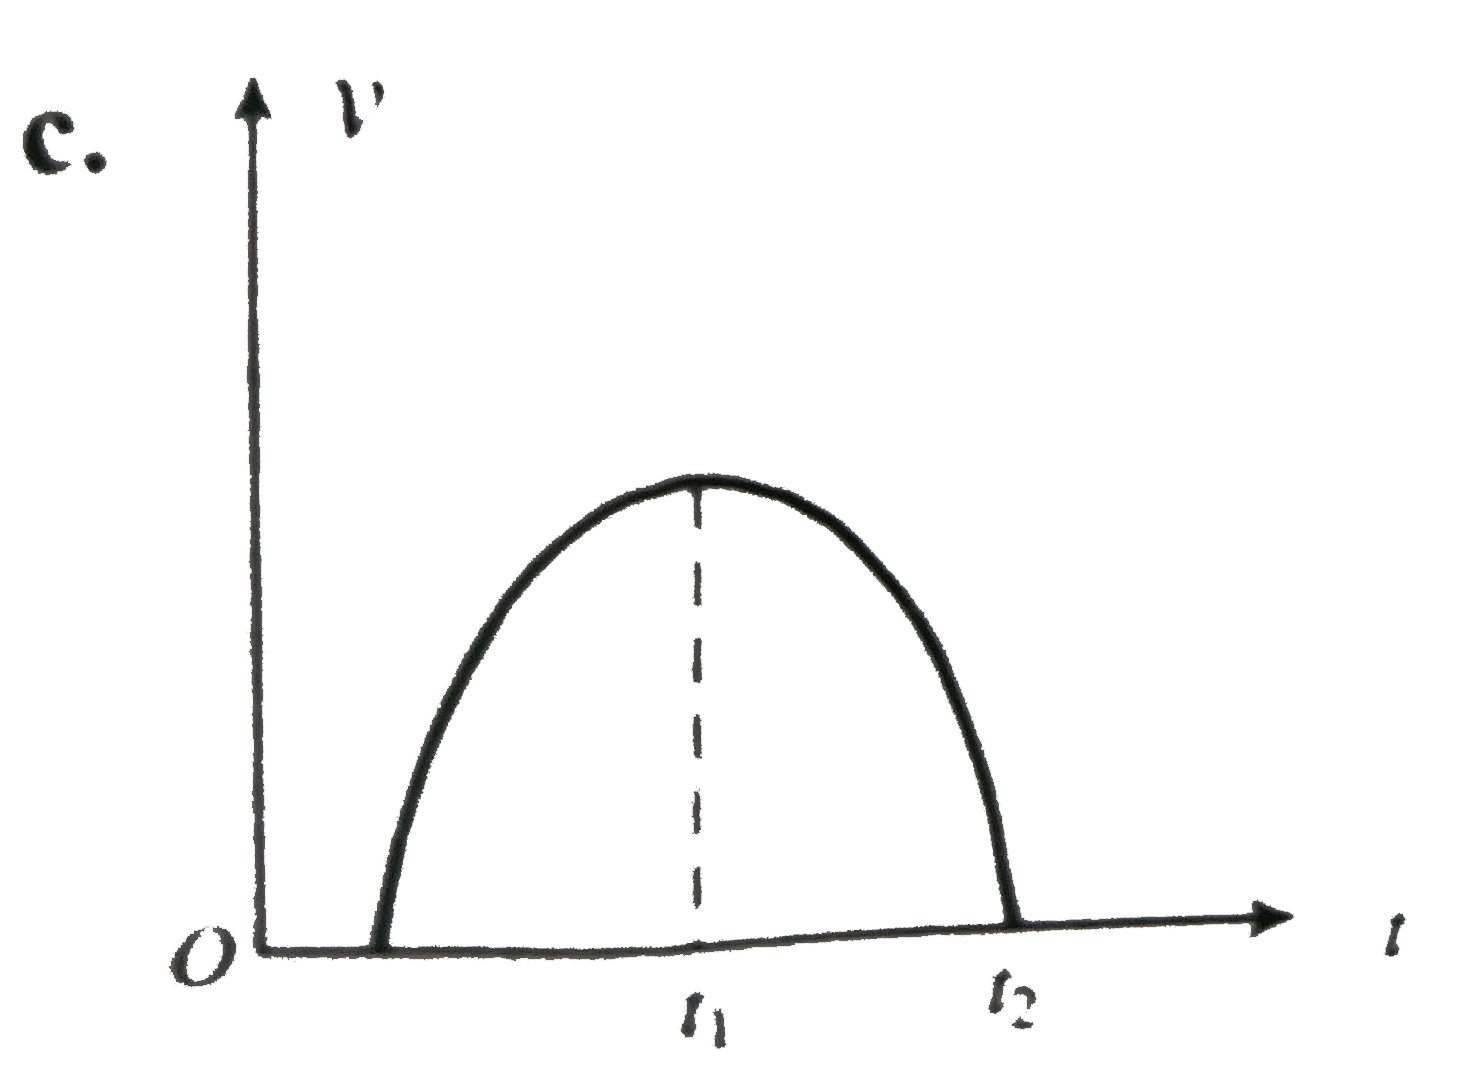
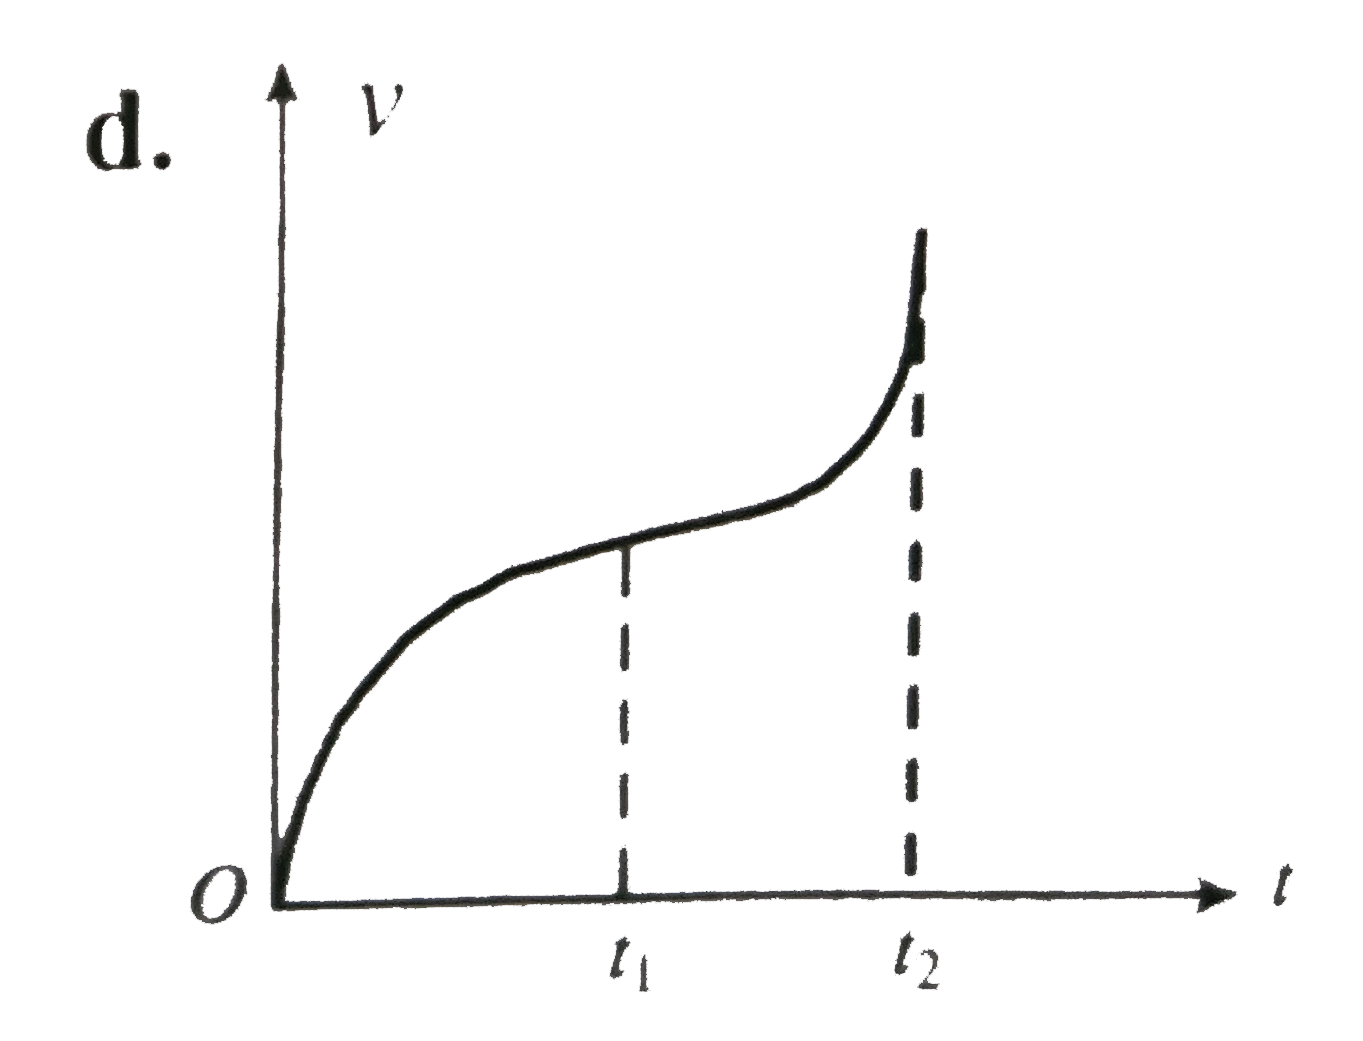
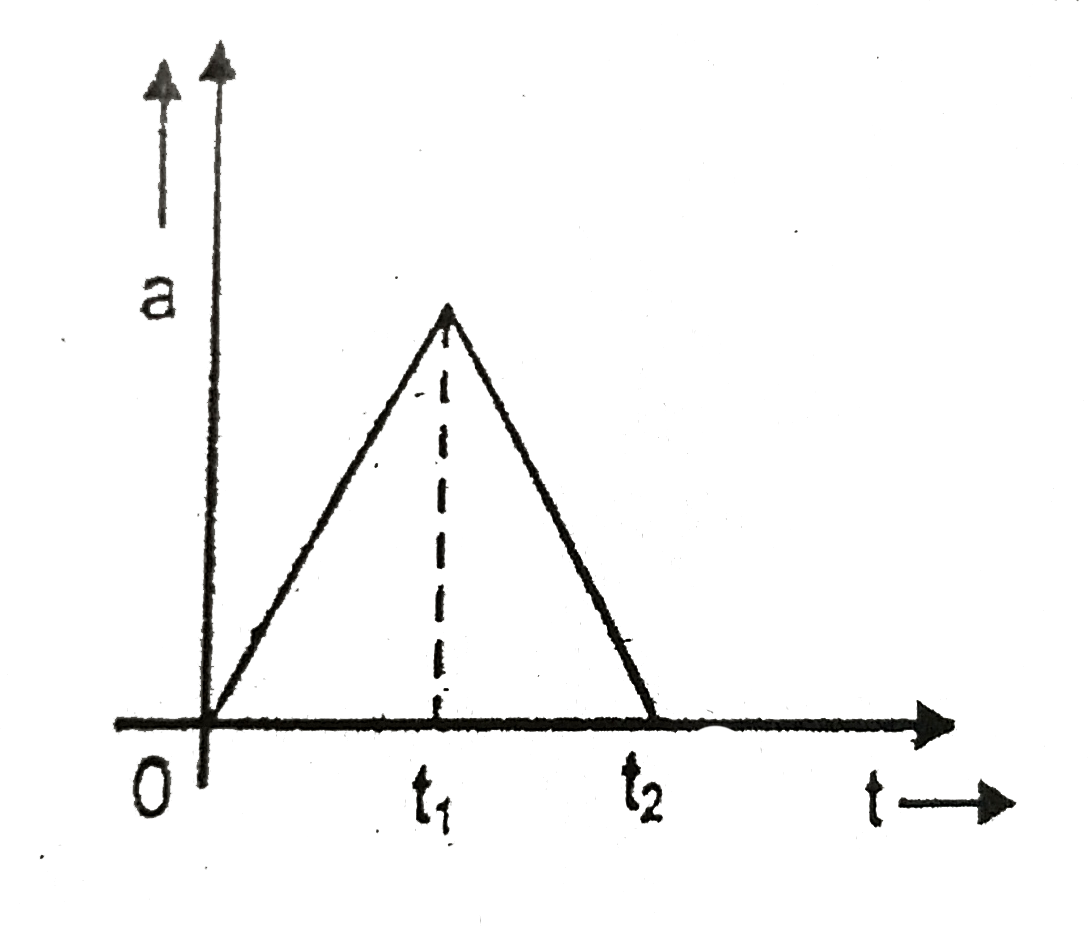
The acceleration versus time graph of a particle is shown in. The respective v−t graph of the particle is .
 .
.
 .
.
 .
.
 .
.
 .
.
The correct Answer is:A
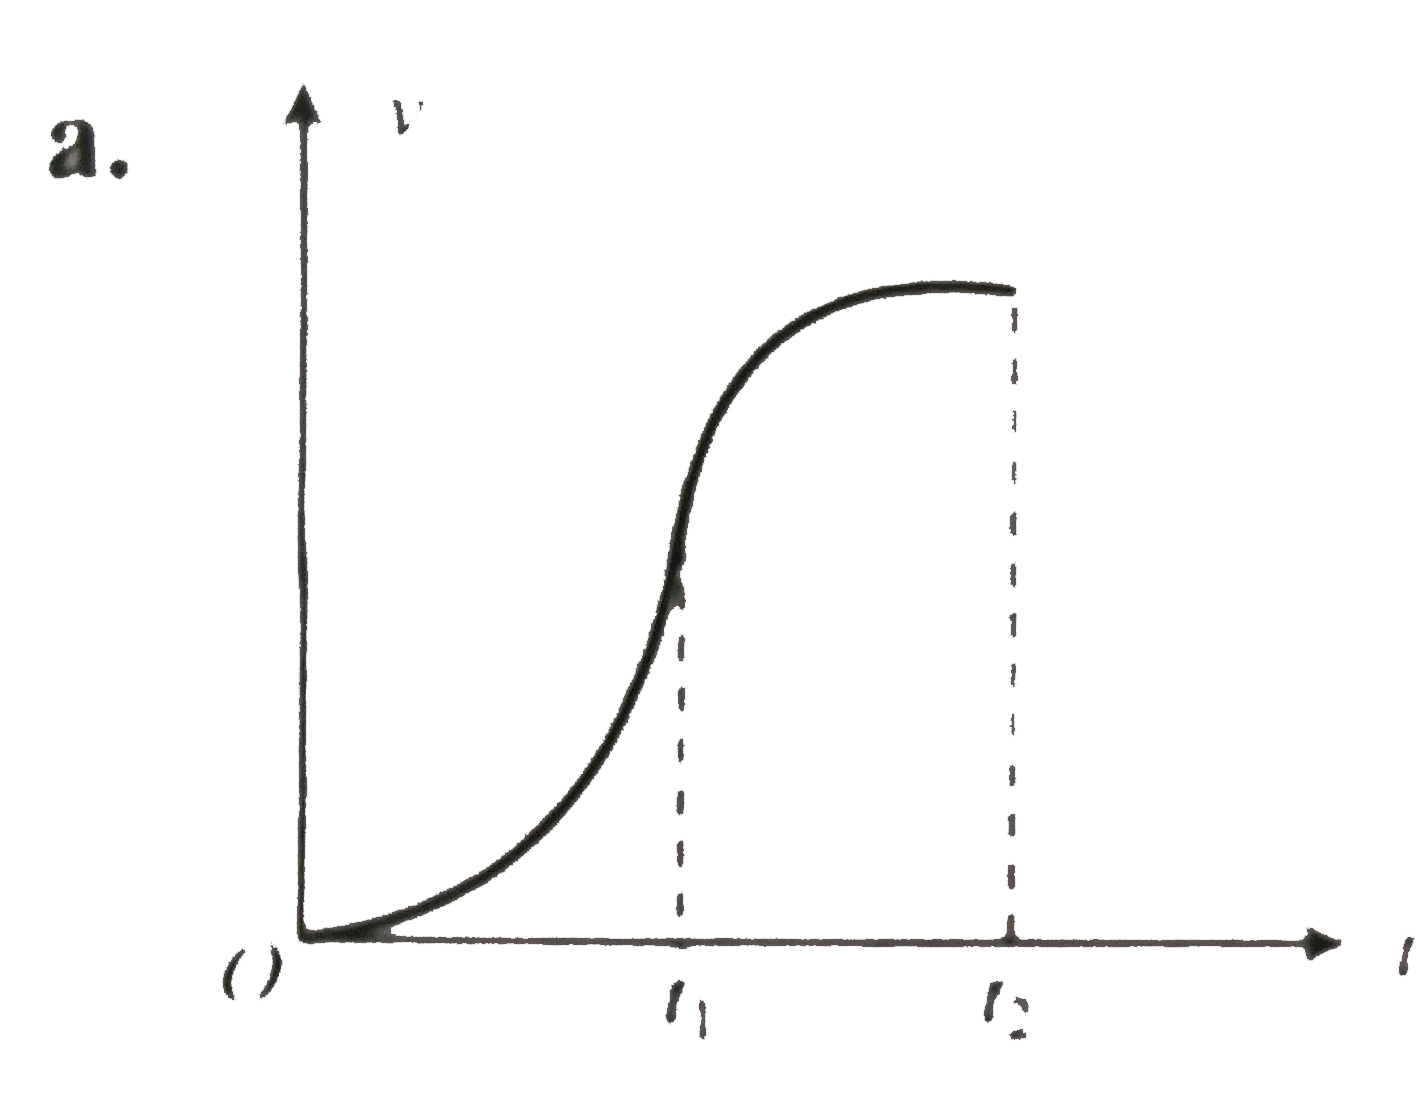
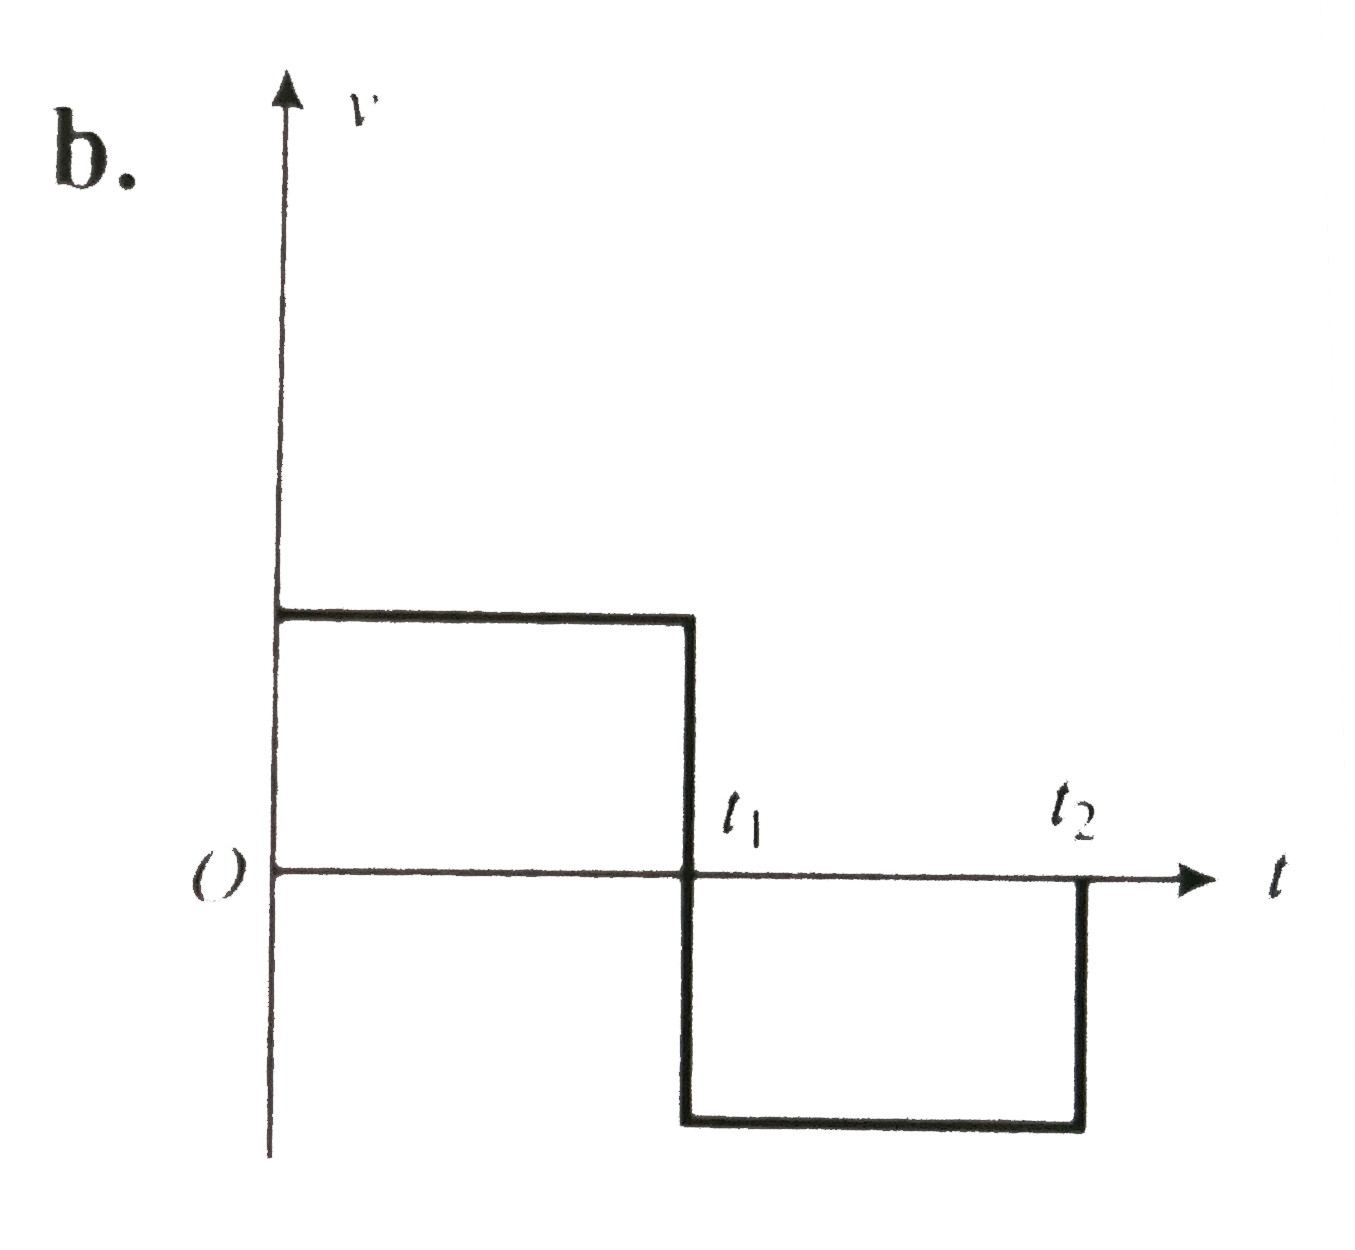
From 0 to t1. Acceleration is increasing linearly with time, hence, v−t graph should be parabolec upwards.
From t1) to t2 acceleration is dereasing linearly with time, hence, the v−t graph should be parabolic downwards.
Related Playlists
- BOOK - CENGAGE PHYSICS ENGLISHCHAPTER - KINEMATICS-1EXERCISE - Graphical cancept1videos
KINEMATICS-1
- BOOK - CENGAGE PHYSICS ENGLISHCHAPTER - KINEMATICS-1EXERCISE - Multiple Correct16videos
KINEMATICS-1
- BOOK - CENGAGE PHYSICS ENGLISHCHAPTER - KINEMATICS-1EXERCISE - Single Correct52videos
KINEMATICS-1
- BOOK - CENGAGE PHYSICS ENGLISHCHAPTER - GRAVITATIONEXERCISE - INTEGER_TYPE1videos
GRAVITATION
- BOOK - CENGAGE PHYSICS ENGLISHCHAPTER - KINEMATICS-2EXERCISE - Exercise Integer9videos
KINEMATICS-2
Similar Questions
A particle starts to move along a straight line. The acceleration versus time graph of particle is as shown in figure. The correct velocity versus time graph is :
 View Solution
The velocity − time graph of a particle is as shown in figure
 View Solution
i.The acceleration versus time graph of a partical SHM is shown in the figure . Plot the displacement versus time graph
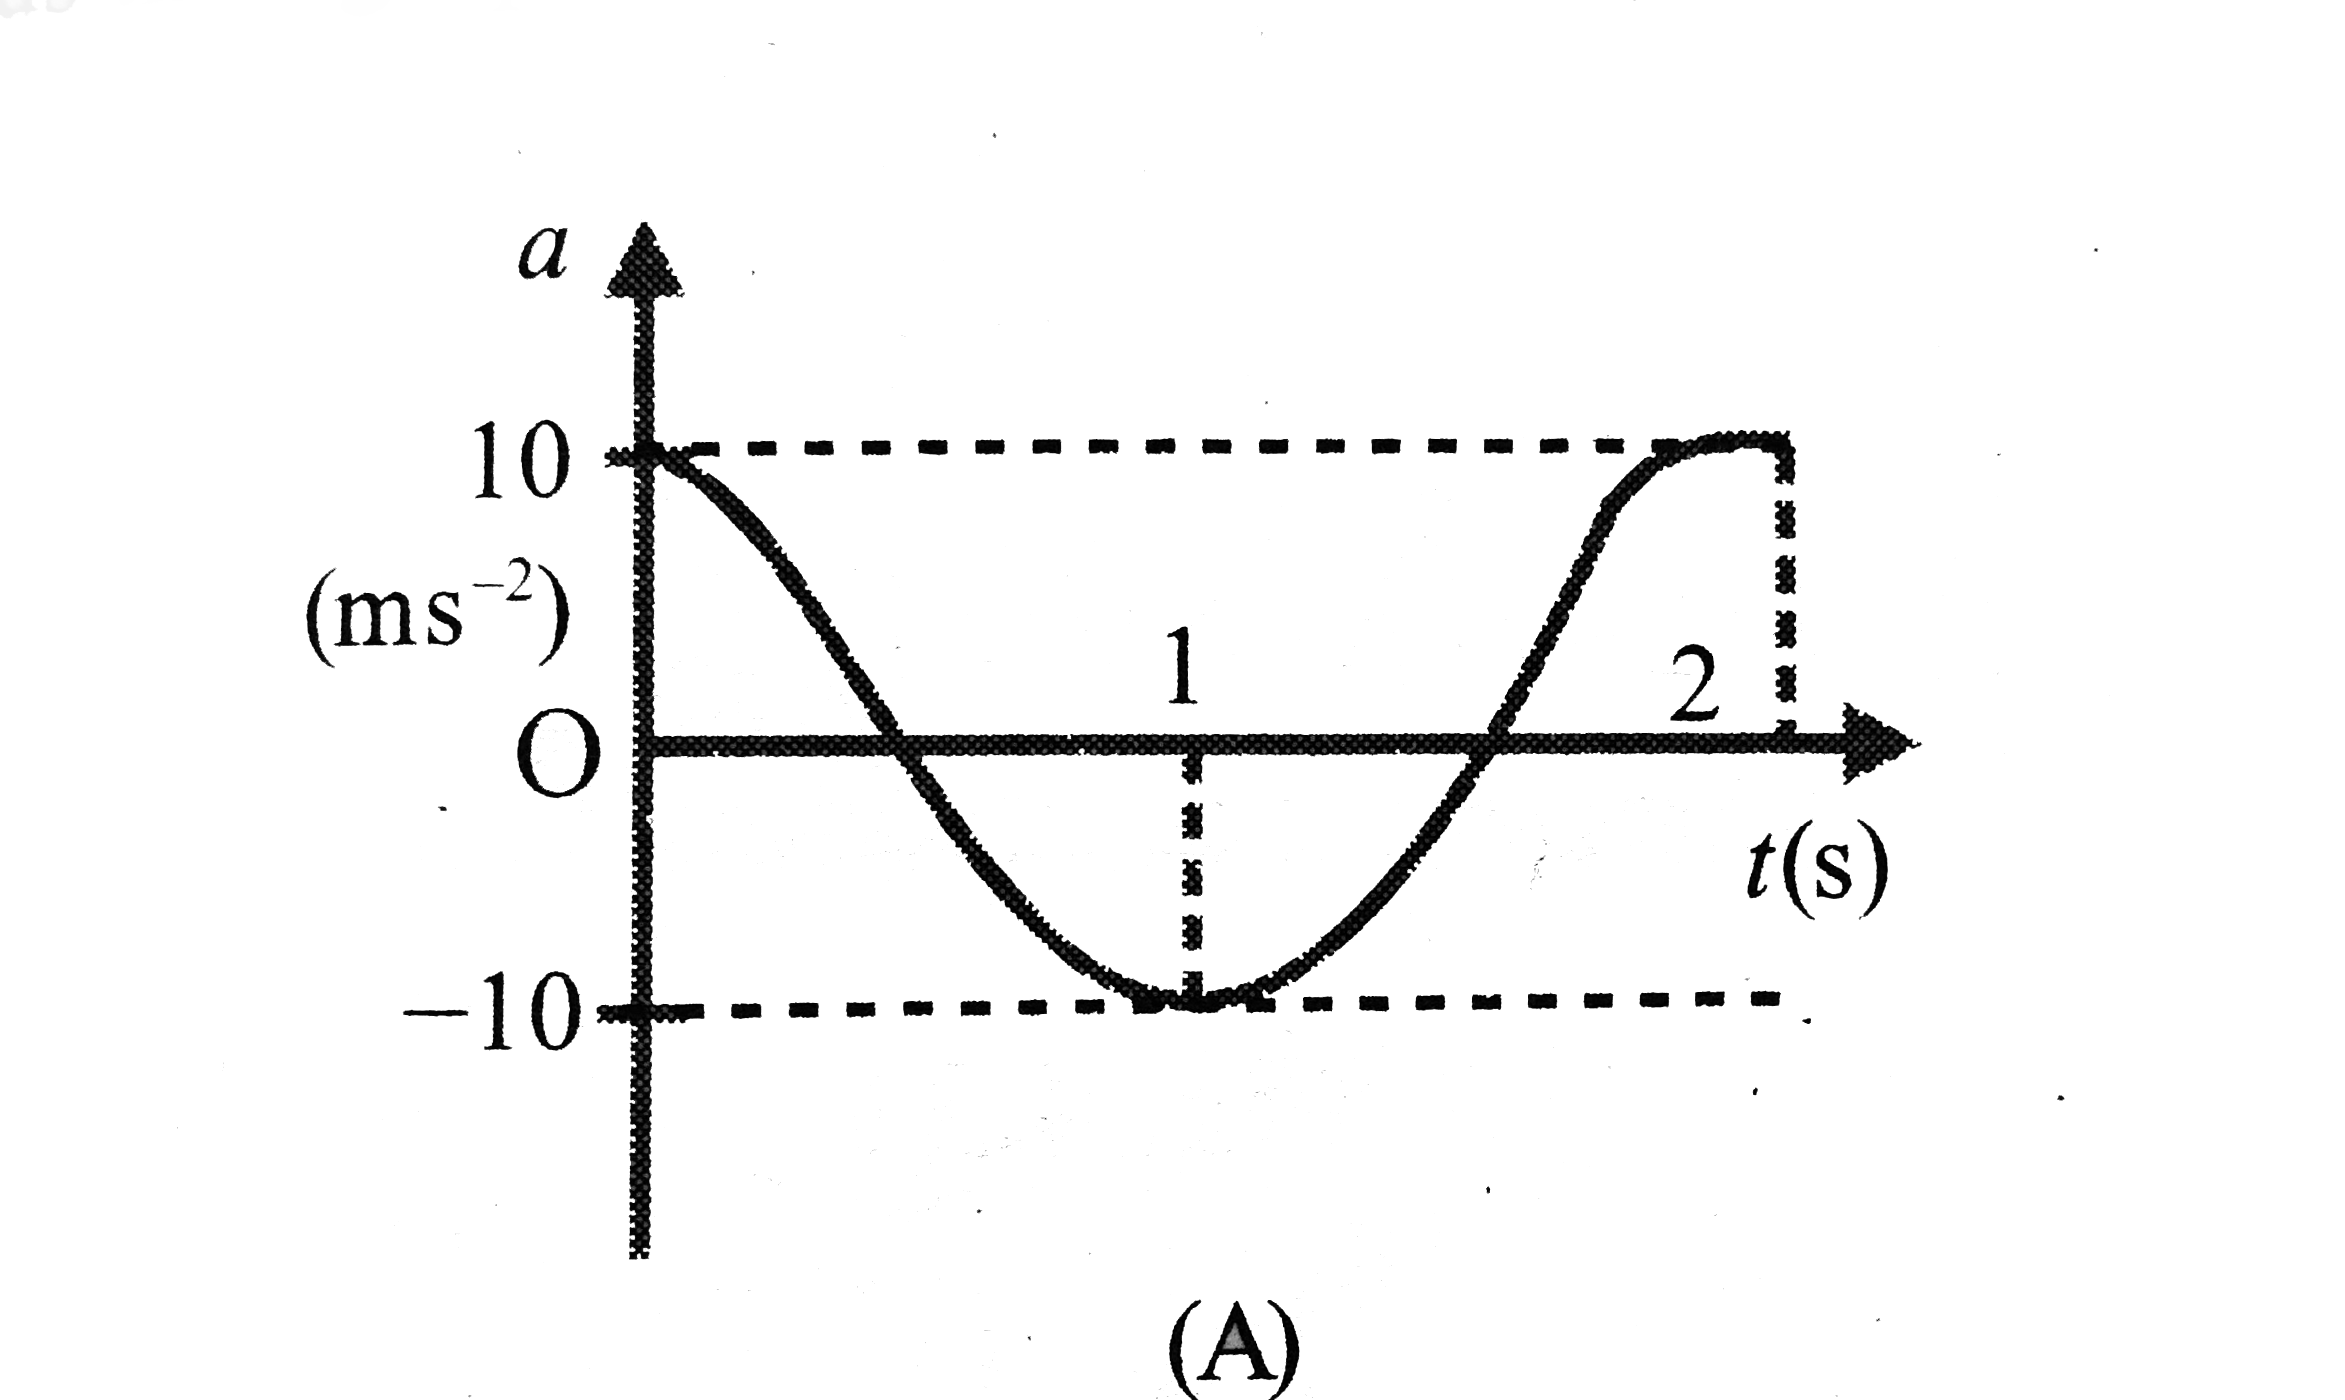
ii. The frequency of oscillation is……..
iii. The displacement amplitude is ………
iv. At t=0, the velocity of the partical is ......
v. The kinetic energy of the partical is maximum at t=....... and t = ......
vi. The potential energy is maximum at t = ....... : t = ..... ans t = .........View Solutionvelocity time graph of a particle is shown in figure. Find displacement of the particle.
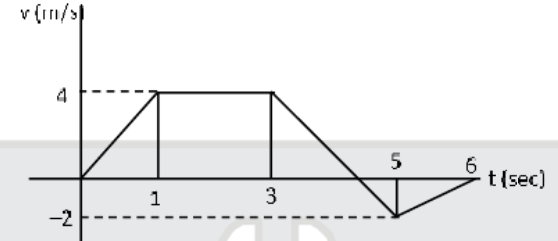 View Solution
The acceleration versus time graph of a particle moving in a straight line is show in. The velocity-time graph of the particle would be
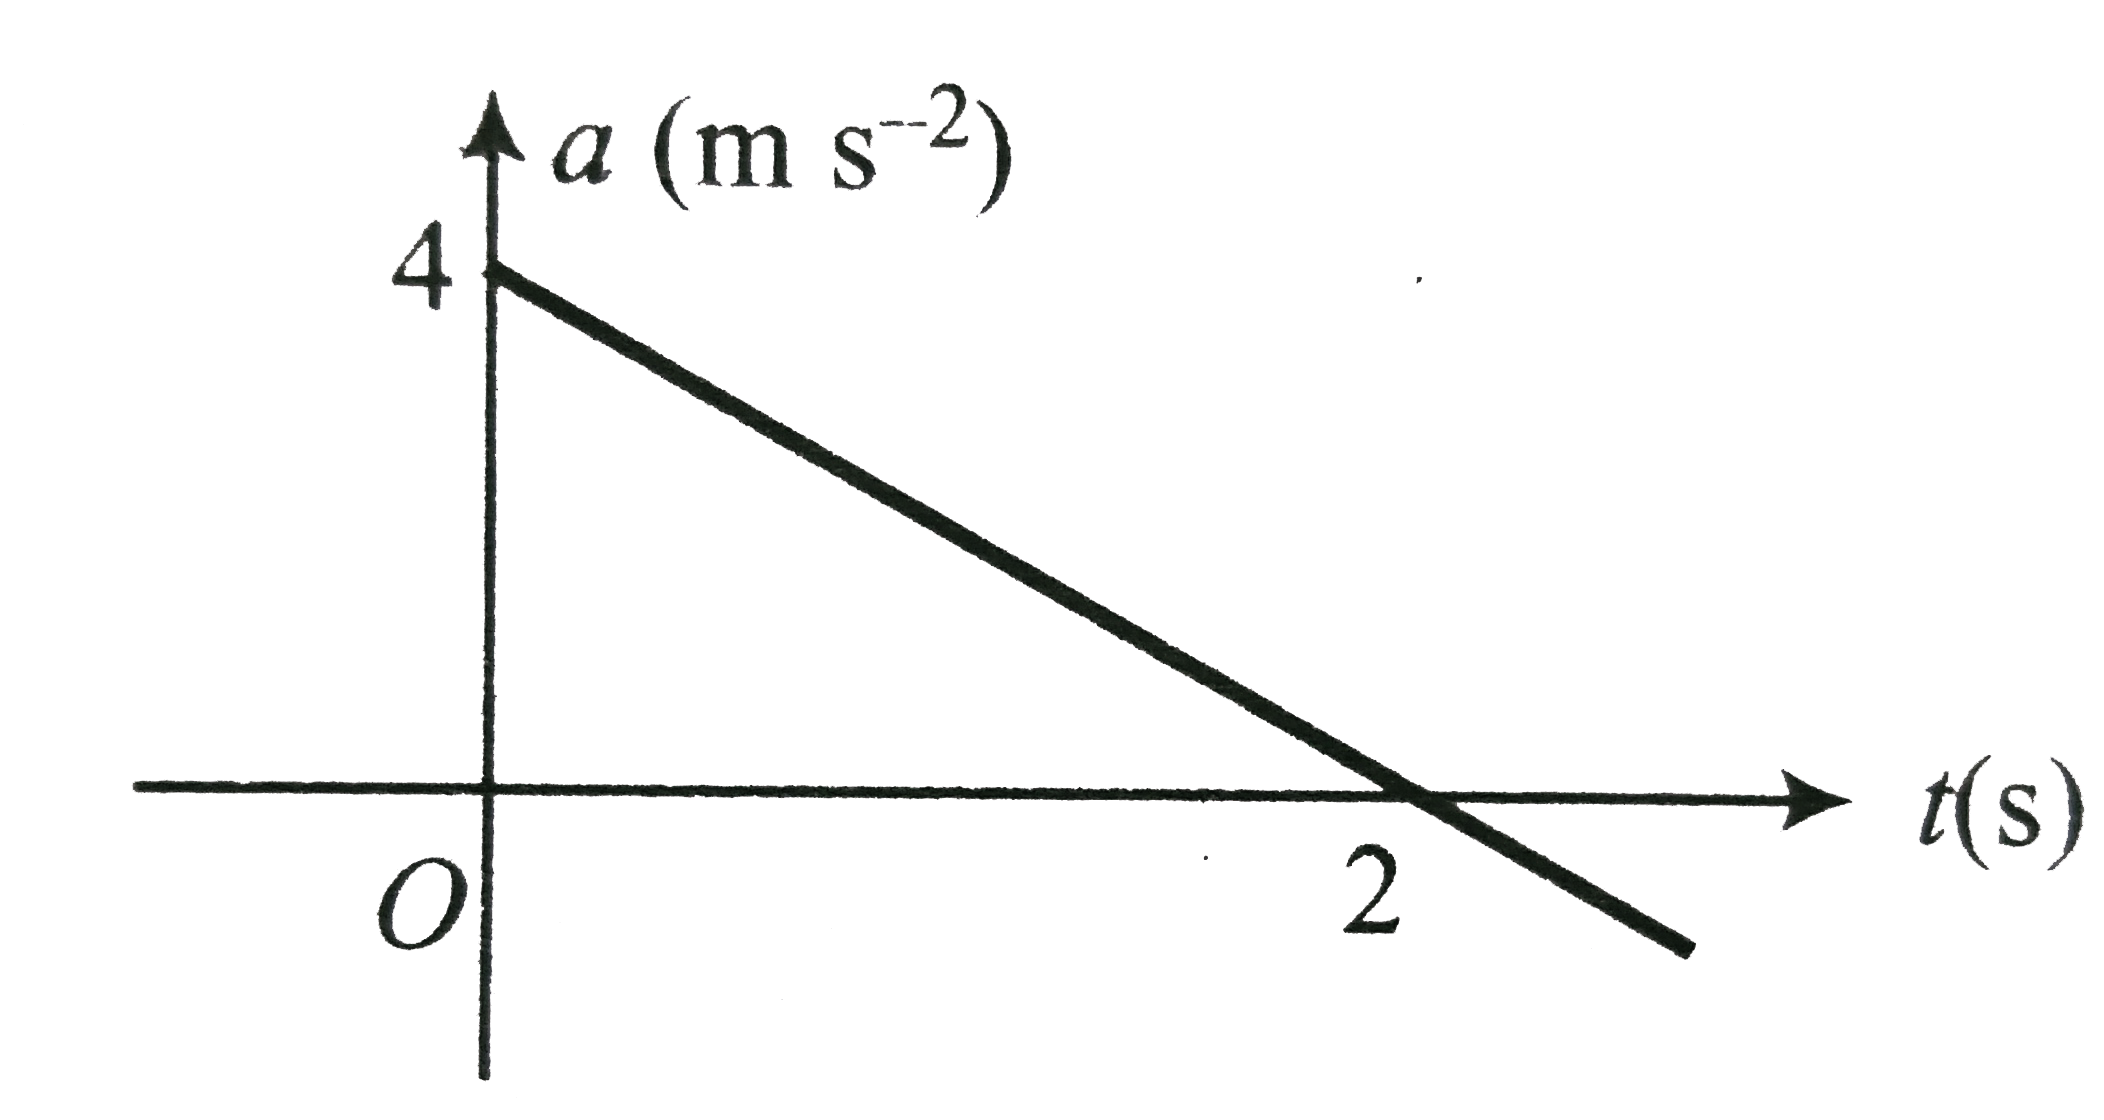 .View Solution
The acceleration-time graph of a particle moving along x-axis is shown in the figure. If the particle starts with velocity 3 m/s at t = 0, find the velocity of particle at t = 4 s.
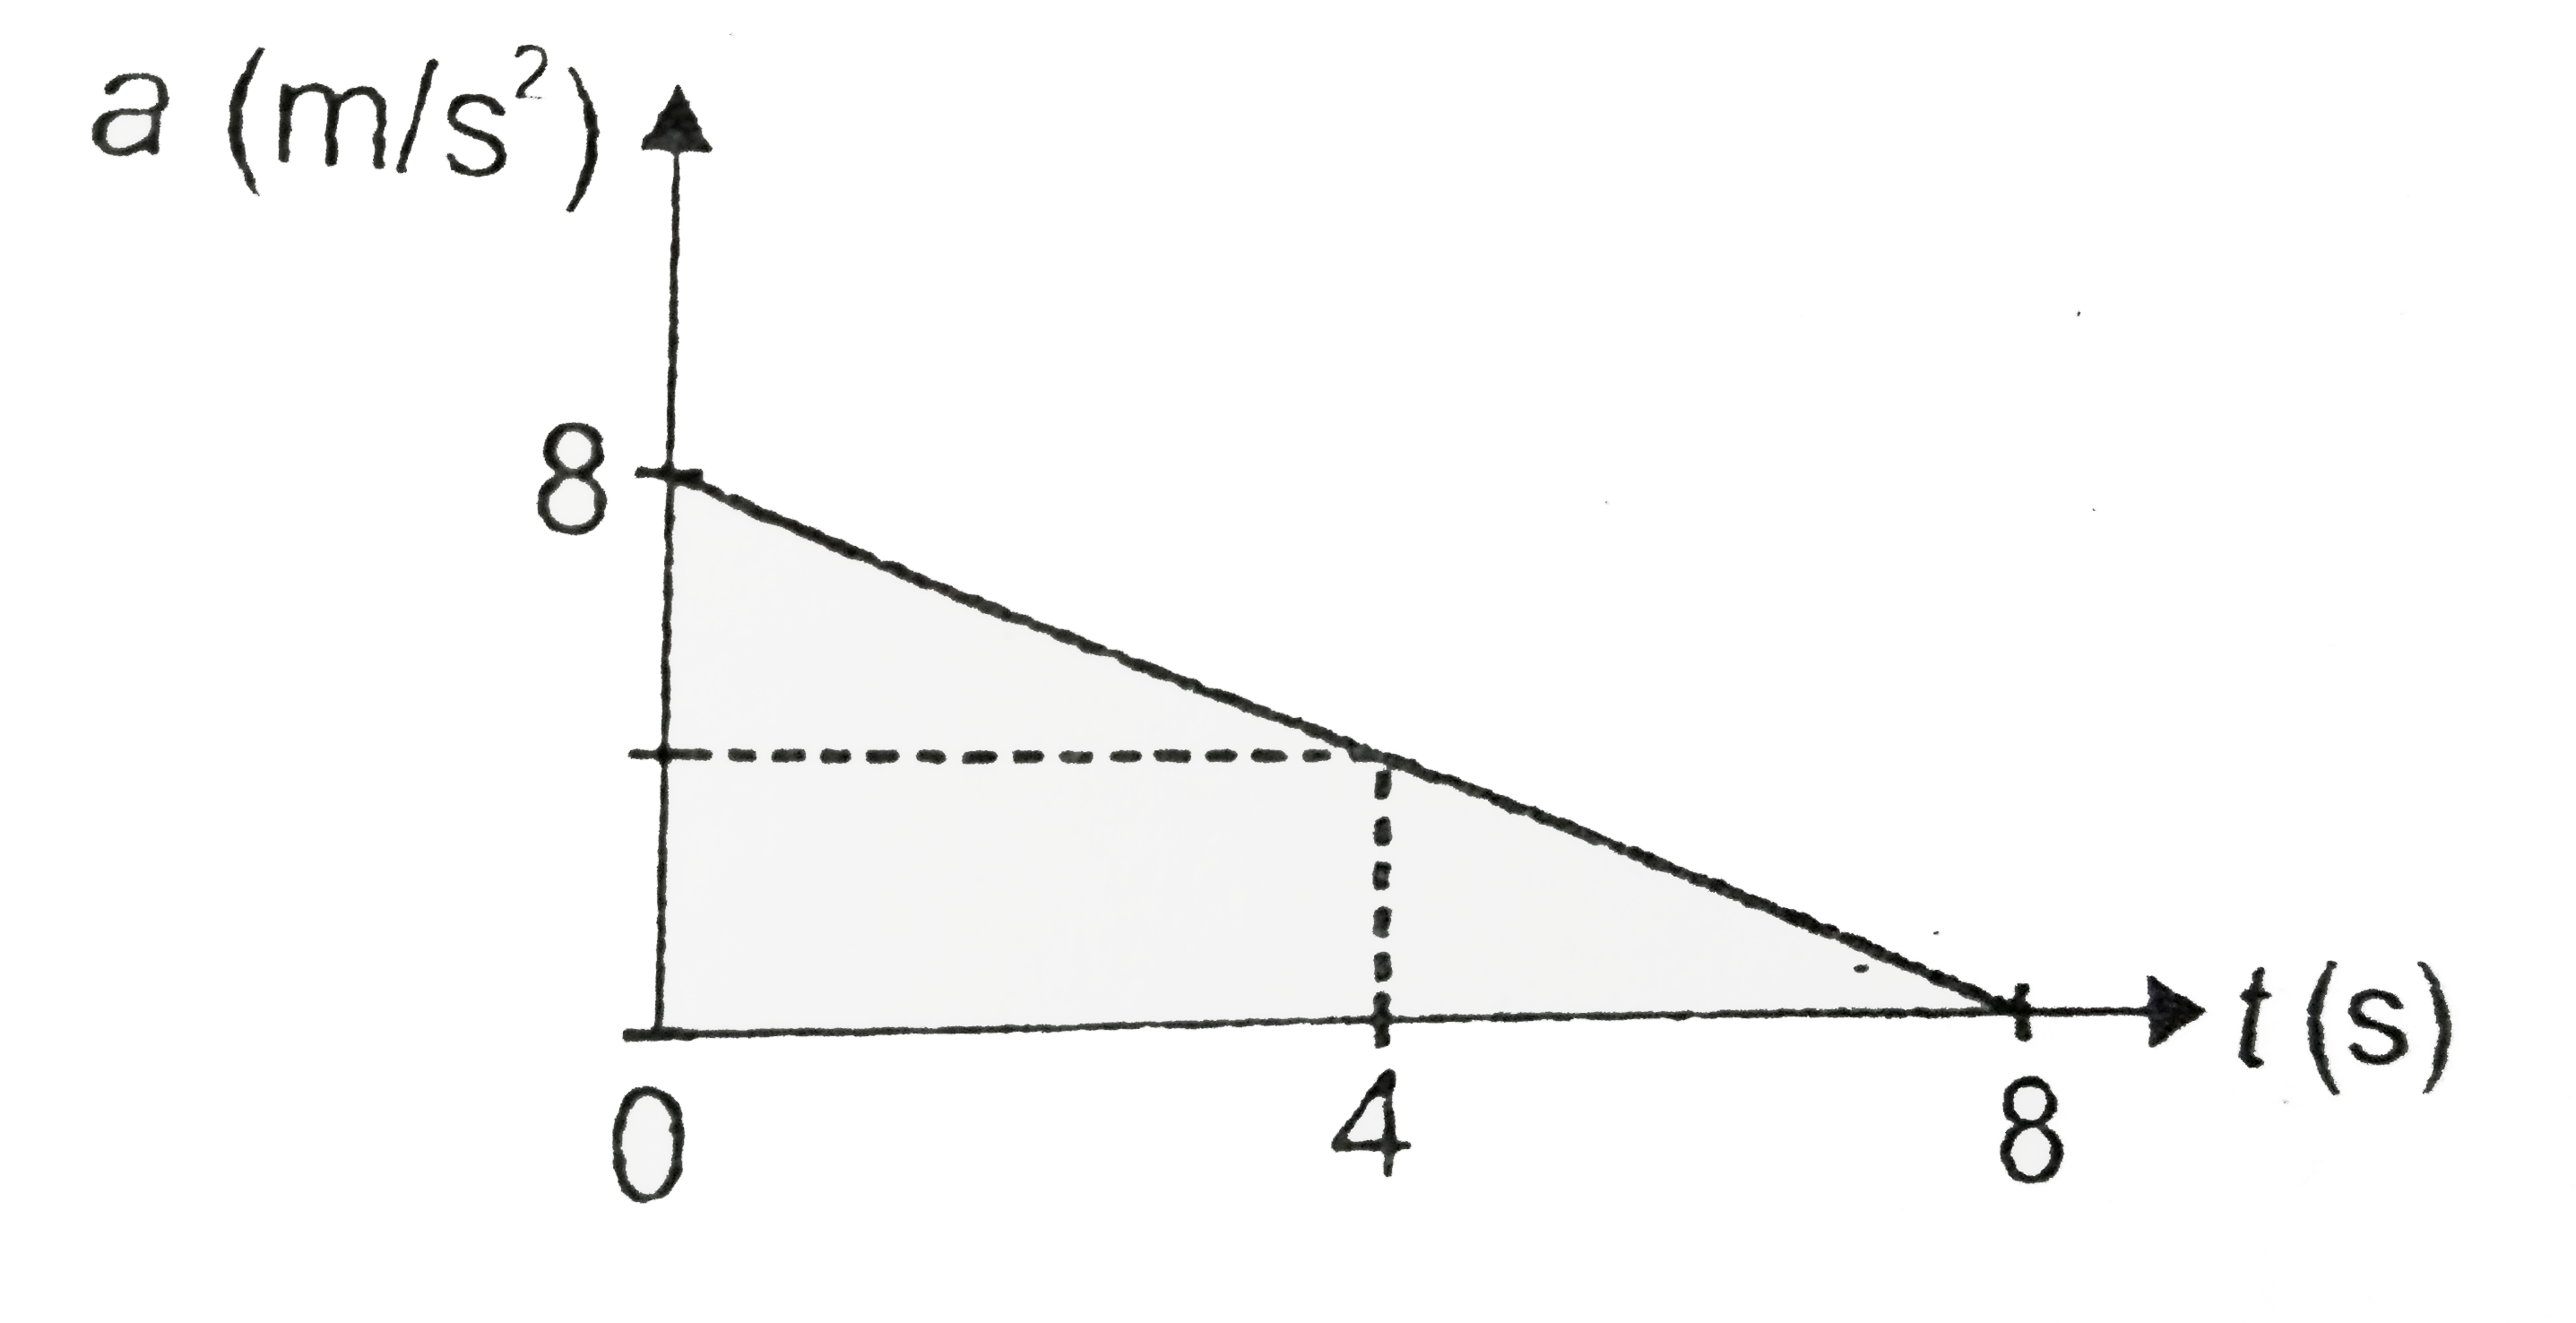 View Solution
The acceleration time graph of a particle is shown in the Fig. 2 (CF). 11. At time t=0s velocity of the particle is 8ms−1. Its velocity t=10s is.
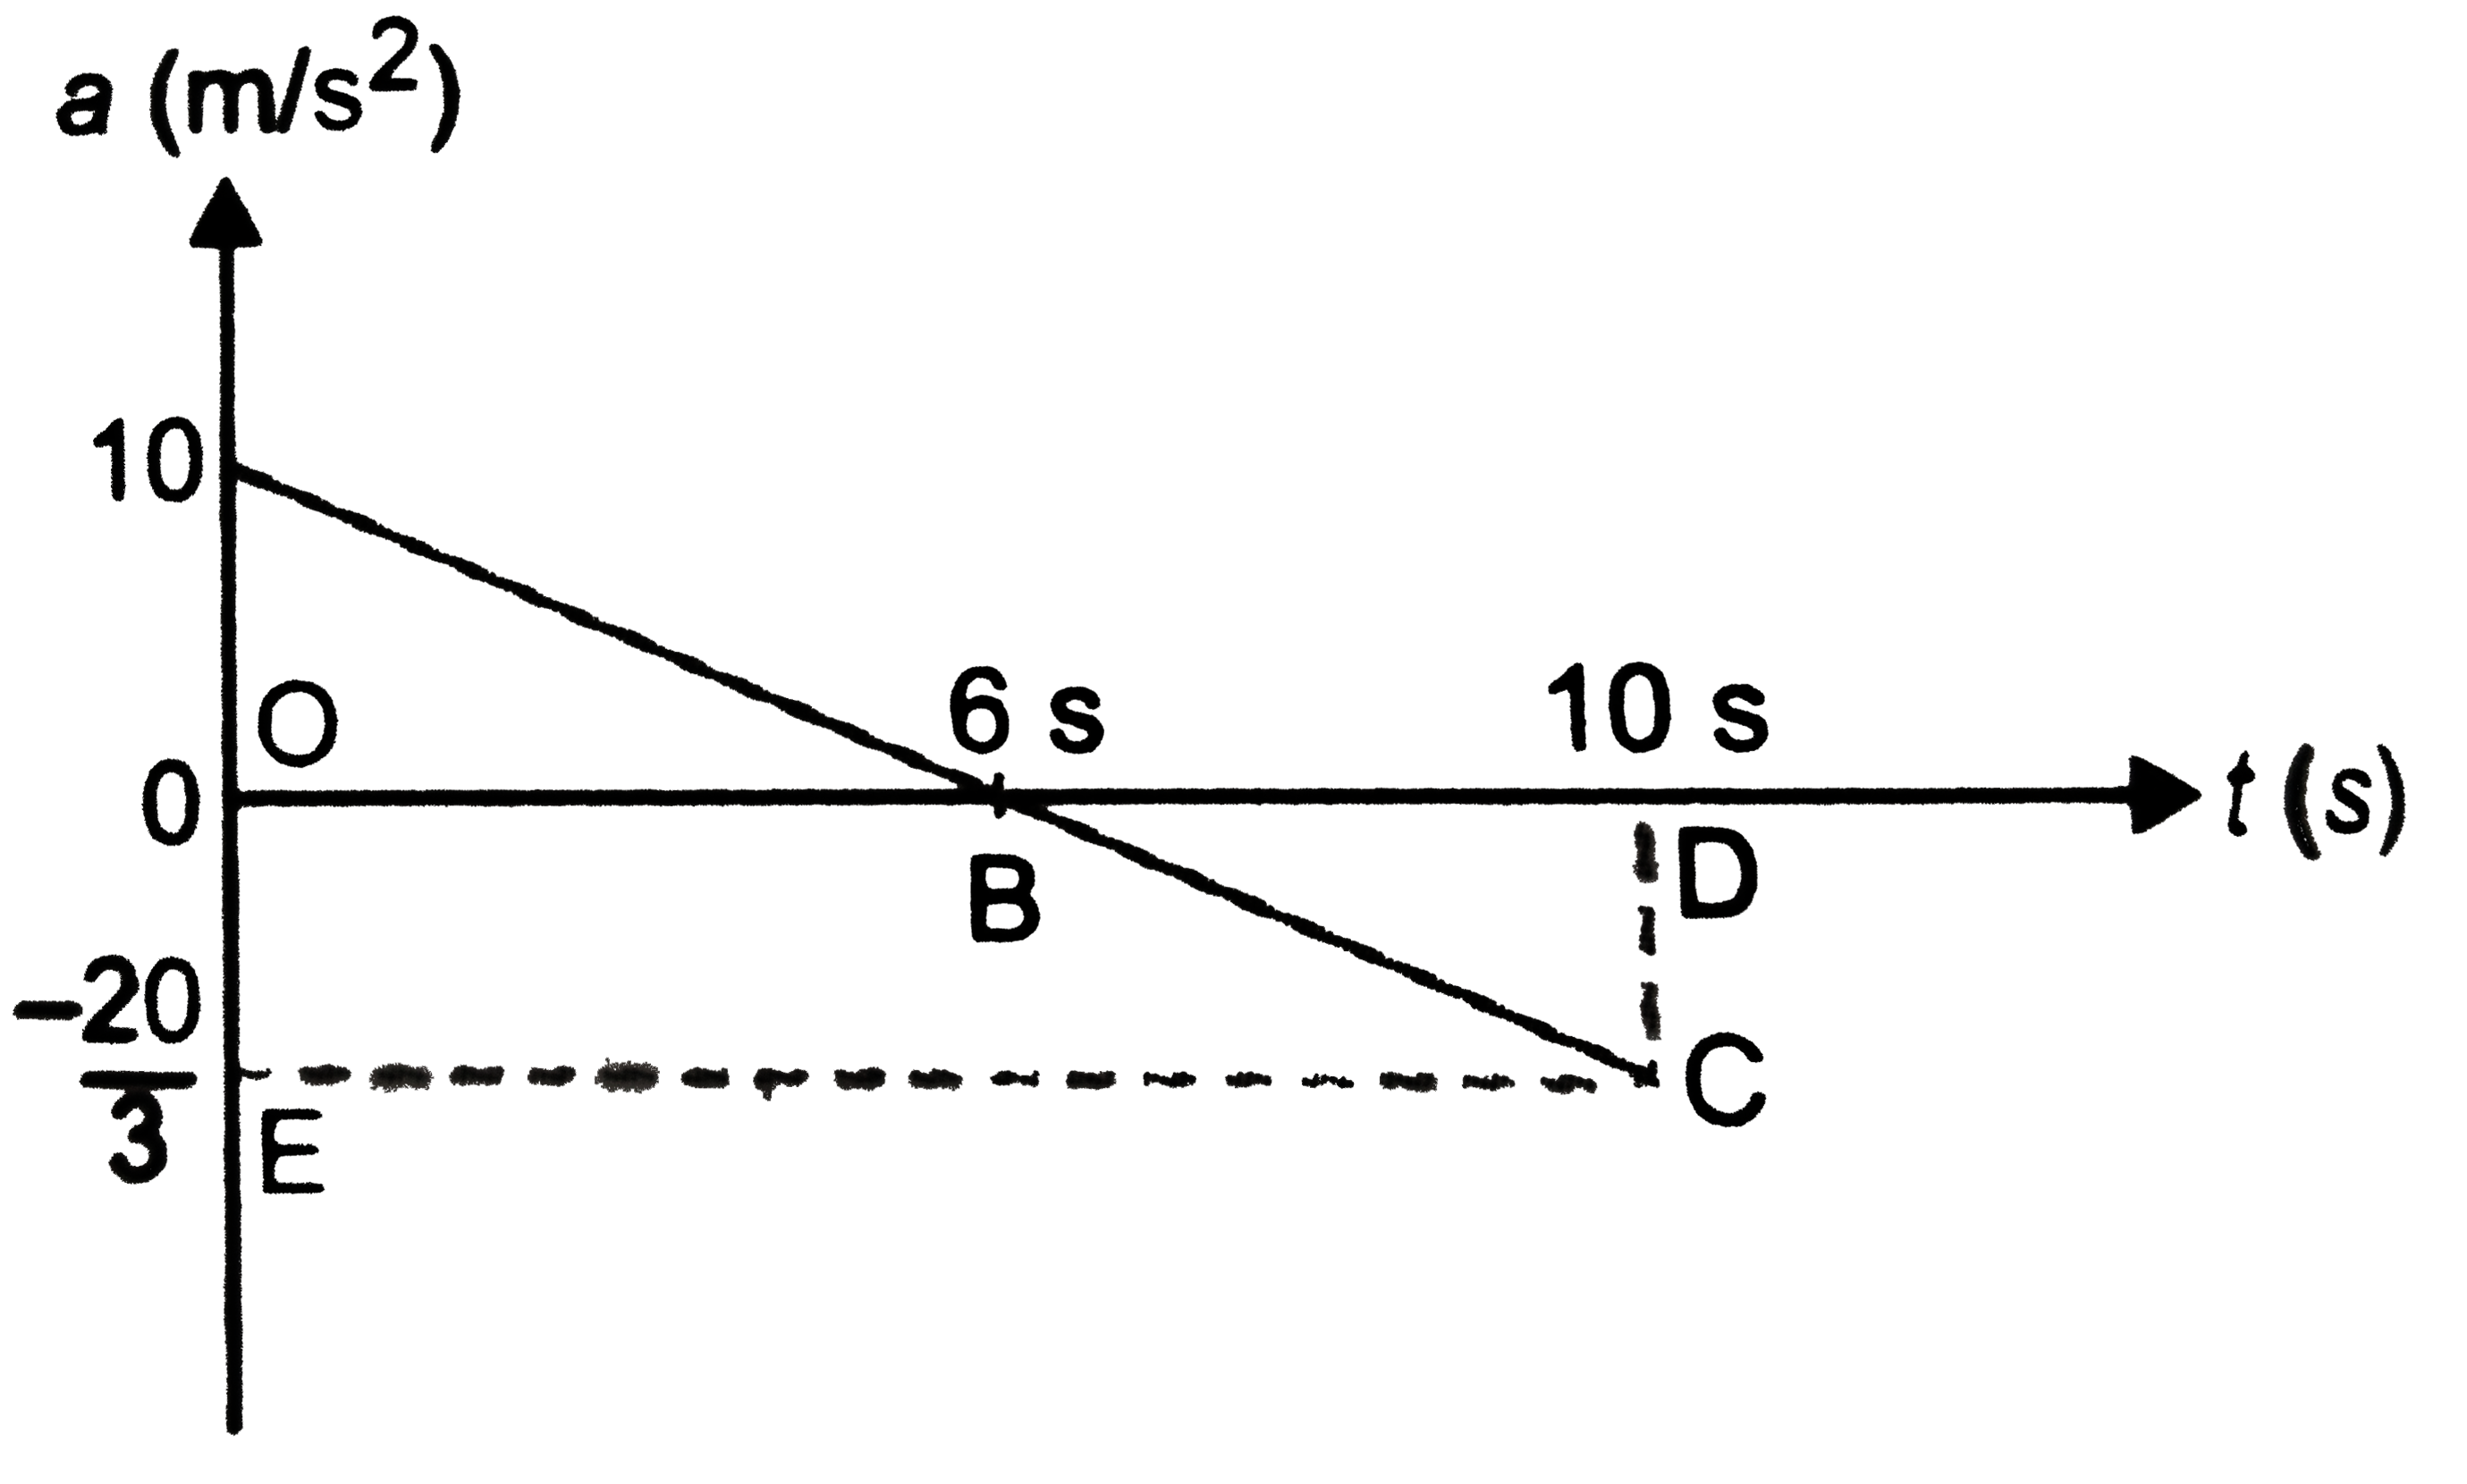 .View Solution
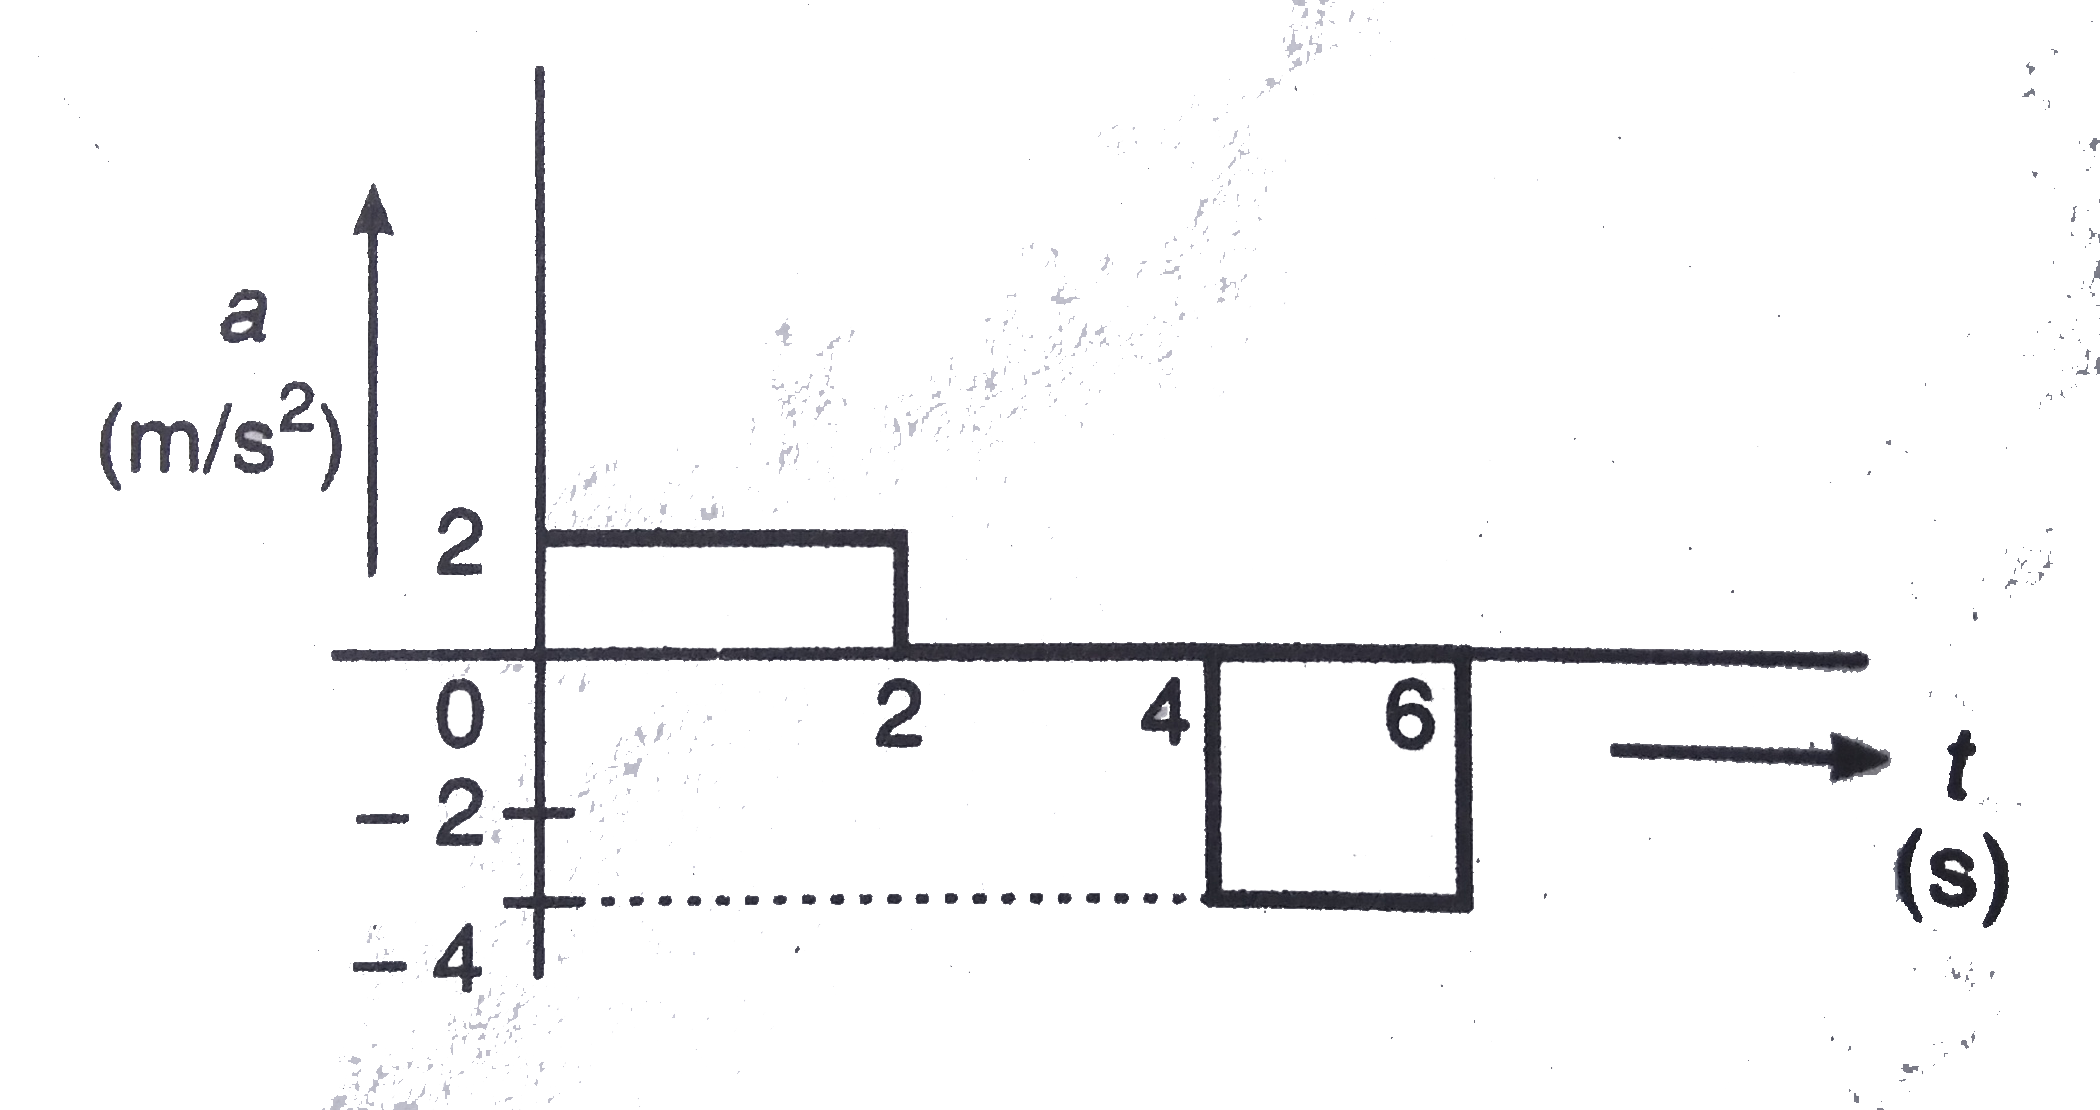
The acceleration versus time graph of a particle moving along a straight line is shown in the figure. Draw the respective velocity-time graph Given v=0 at t=0.
 View Solution
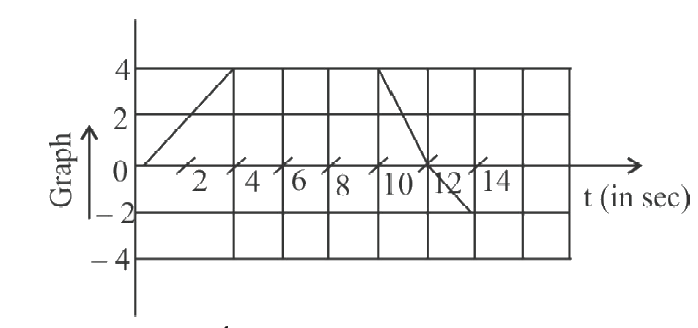
A graph of acceleration versus time of a particle starting from rest at t=0 is as shown in figure. The speed of the particle at t=14s is
 View Solution
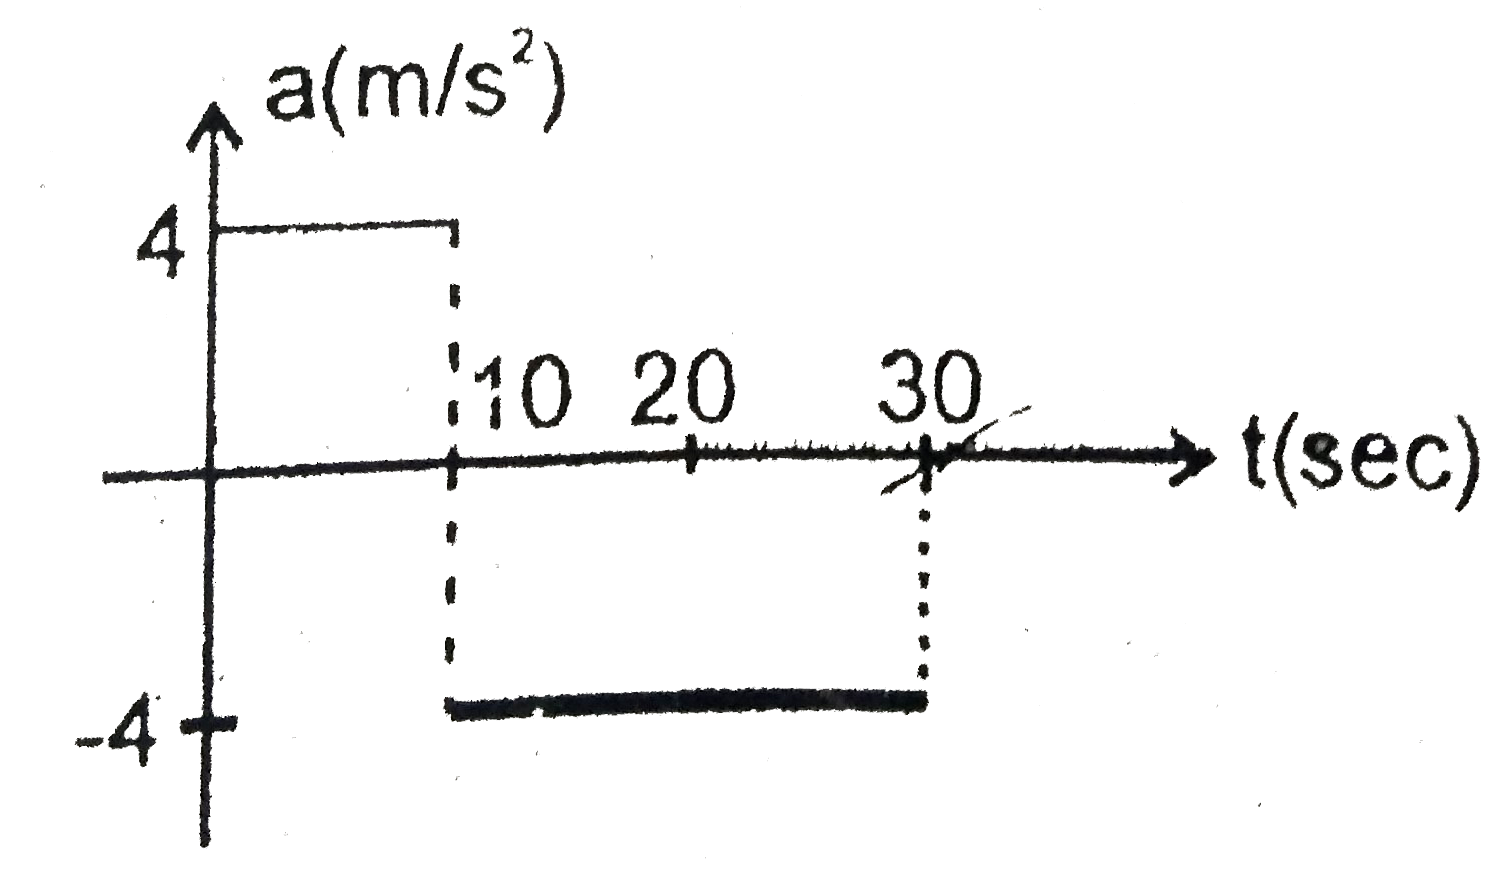
The acceleration versus time graph for a particle moving along a straight line is shown in the figure. If the particle starts from rest at t = 0, then its speed at t = 30 sec will be :
 View Solution

