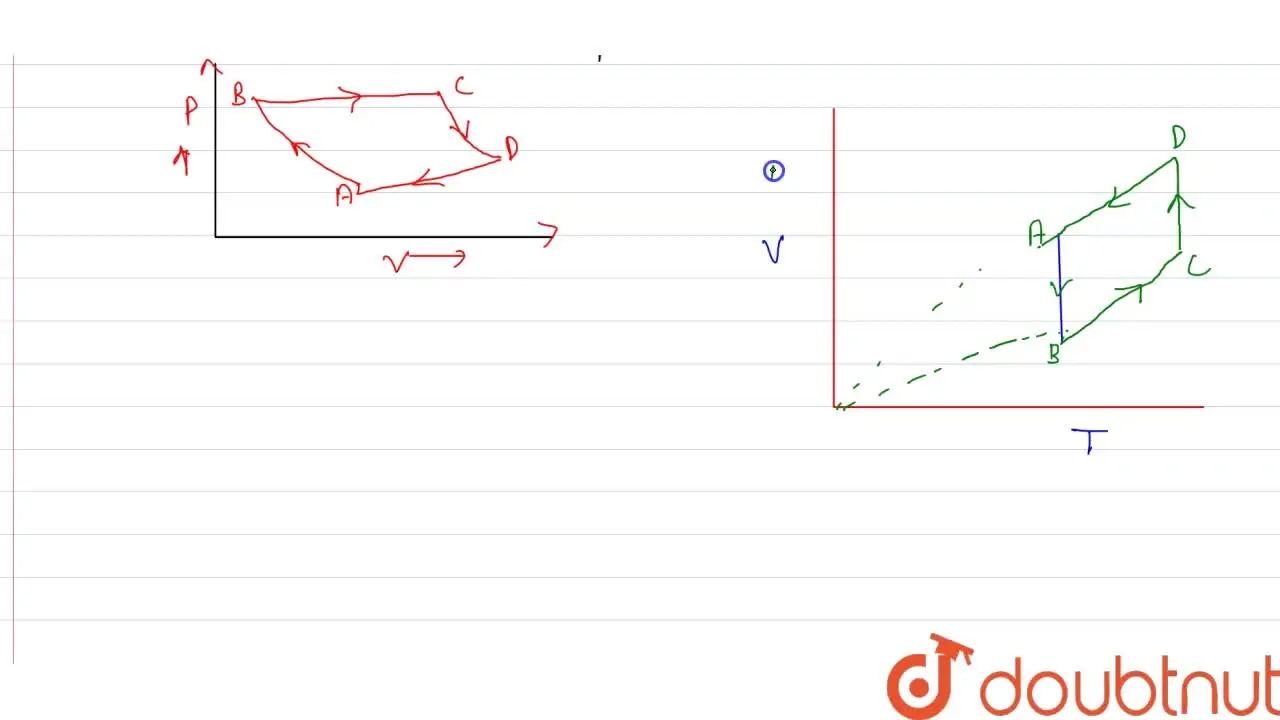
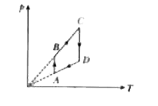
Plot P−V,V−T graph corresponding to the P−T graph for an ideal has shown in figure. Explain your answers.
_S01_065_Q01.png)
For process AB T = constant so P∝1V For process BC P = constant so V∝T
For process CD T = constant so V∝1P For process DA P= constant so V∝T
_S01_065_S01.png)
Related Playlists
- BOOK - ALLENCHAPTER - GEOMETRICAL OPTICSEXERCISE - SOME WORKED OUT EXAMPLES84videos
GEOMETRICAL OPTICS
- BOOK - ALLENCHAPTER - GEOMETRICAL OPTICSEXERCISE - EXERCISE -0165videos
GEOMETRICAL OPTICS
- BOOK - ALLENCHAPTER - CURRENT ELECTRICITYEXERCISE - All Questions427videos
CURRENT ELECTRICITY
- BOOK - ALLENCHAPTER - GRAVITATIONEXERCISE - EXERCISE 49videos
GRAVITATION
Similar Questions
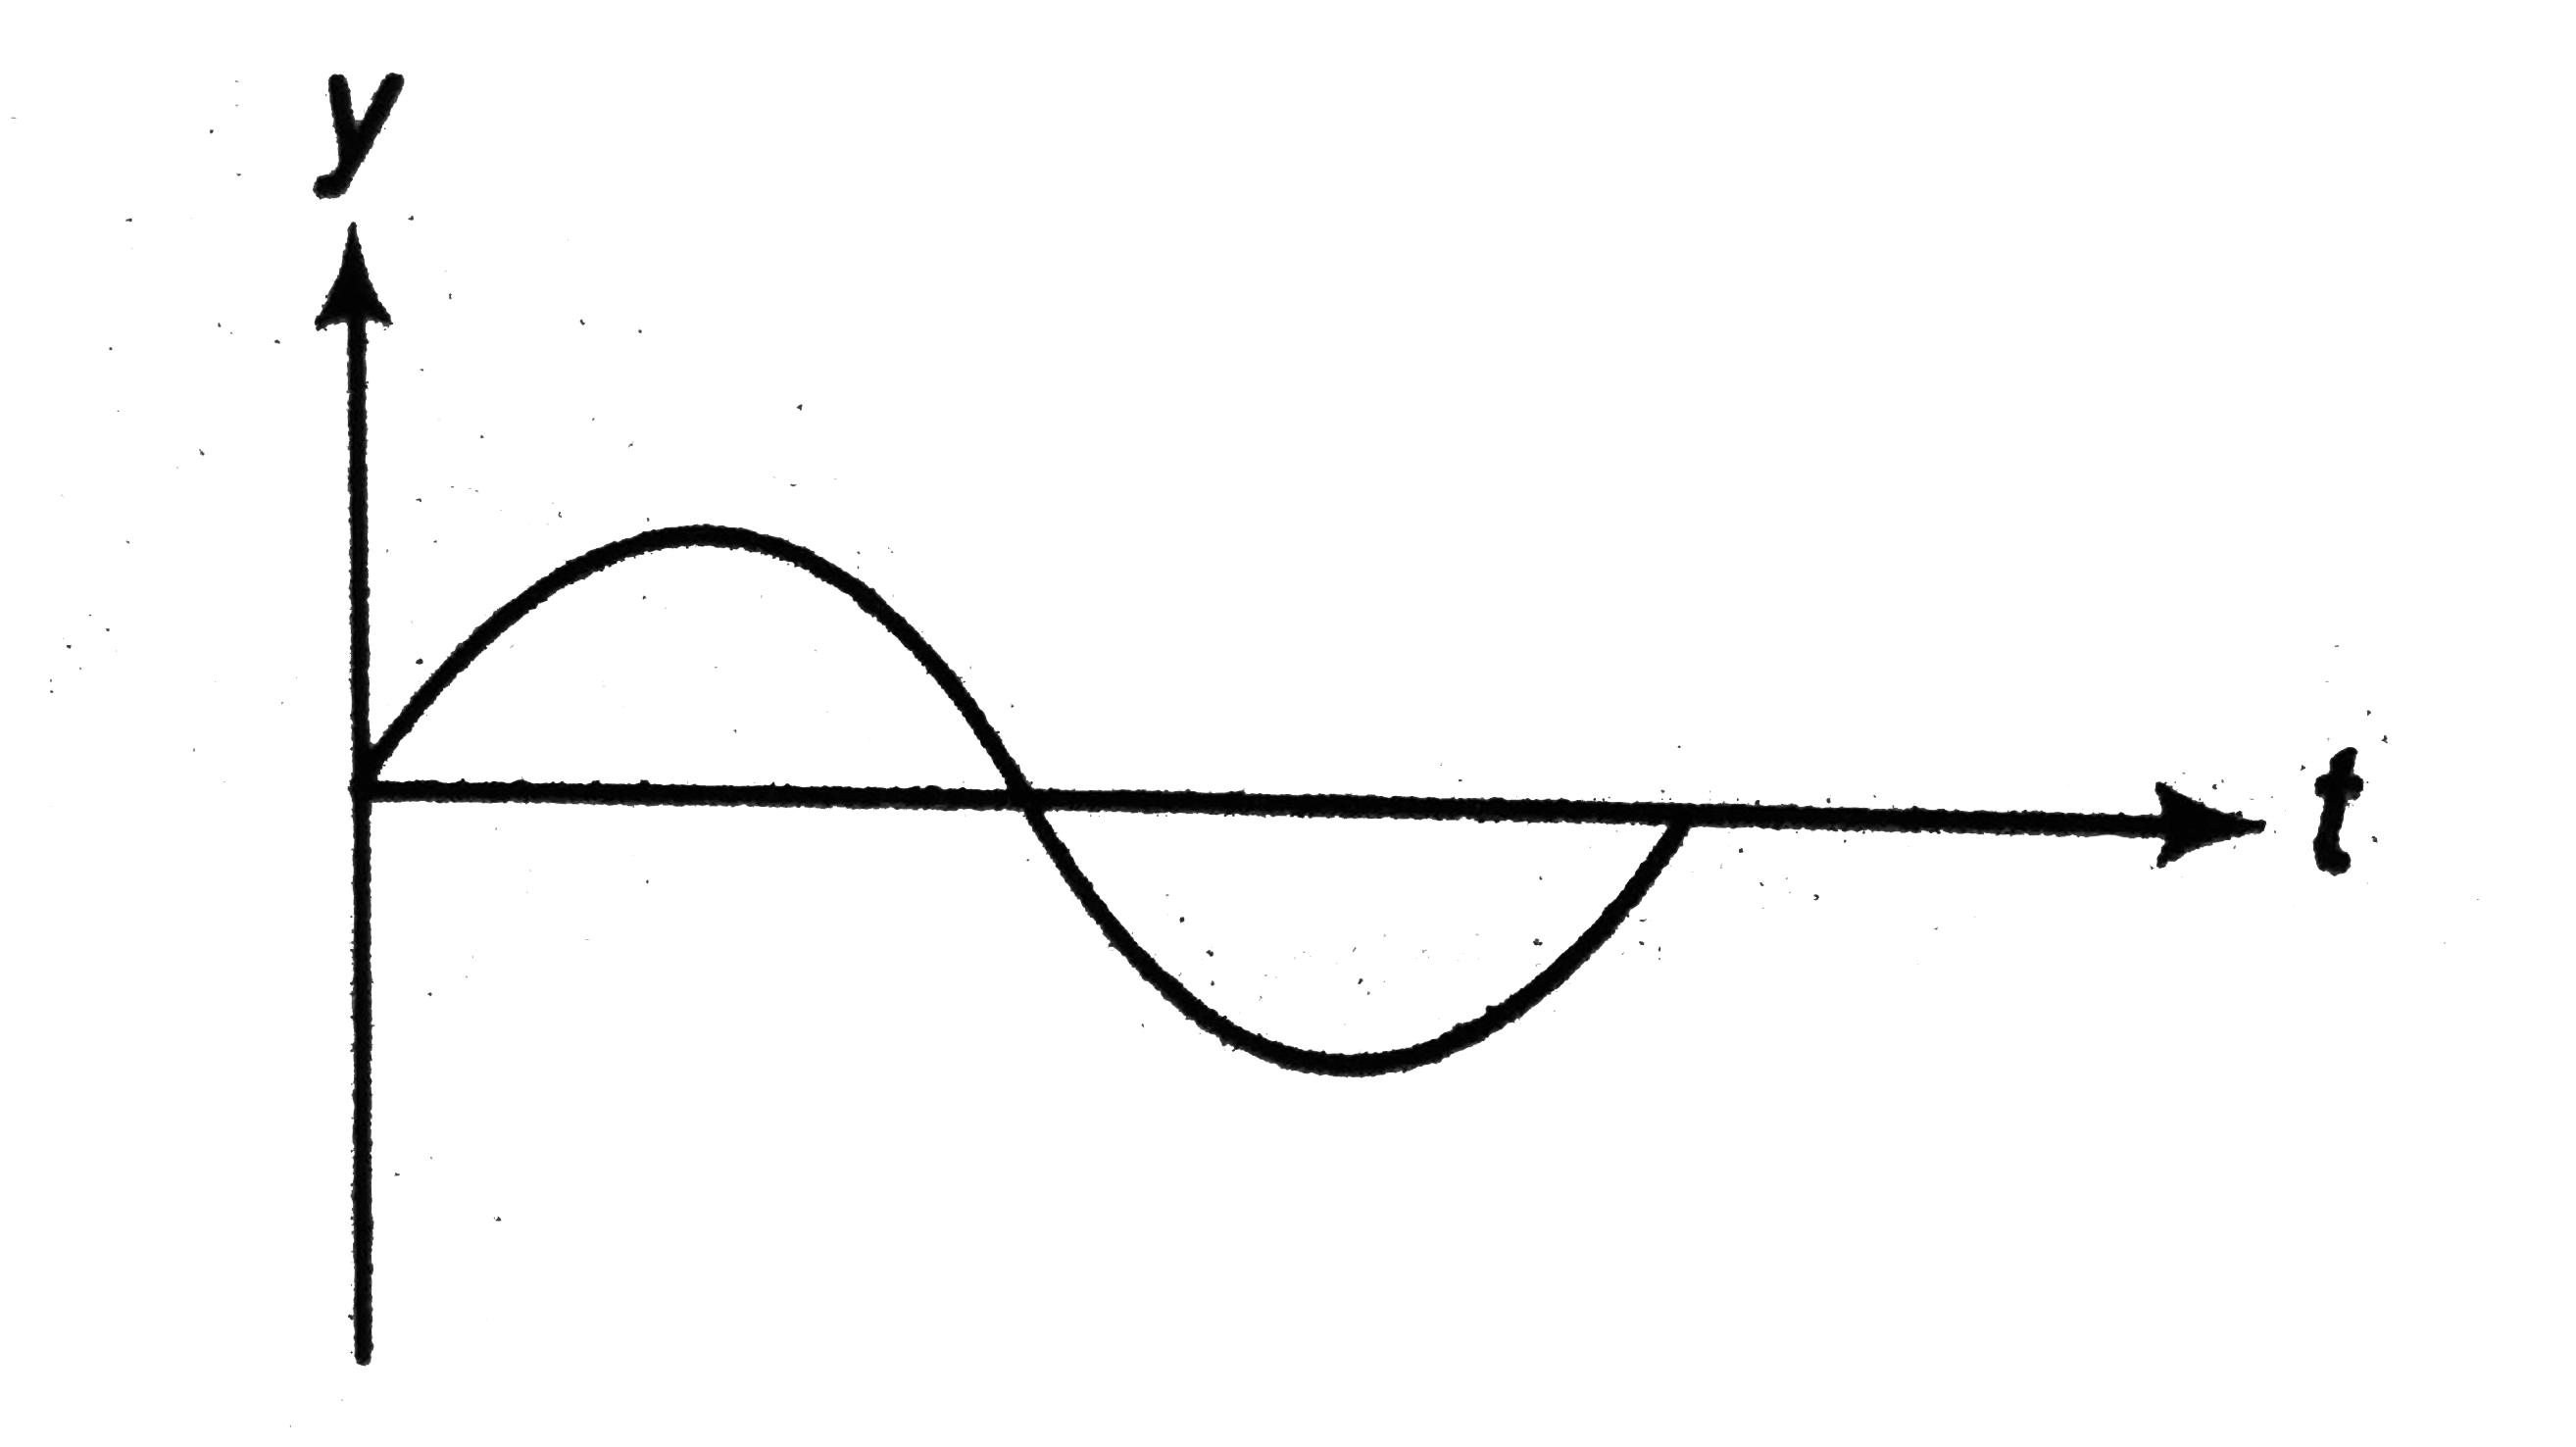
Corresponding to y−t graph of a transverse harmonic wave shown in figure,
 View Solution
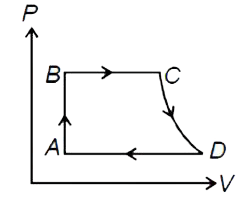
What is the corresponding P-T diagram, If the P-T diagram for an ideal gas is as shown in the figure ?
 View Solution
On the P−T graph of an ideal gas, choose the correct option(s):
View SolutionThe P−T graph for the given mass of an ideal gas is shown in figure. Then the volume
_E01_022_Q01.png) View Solution
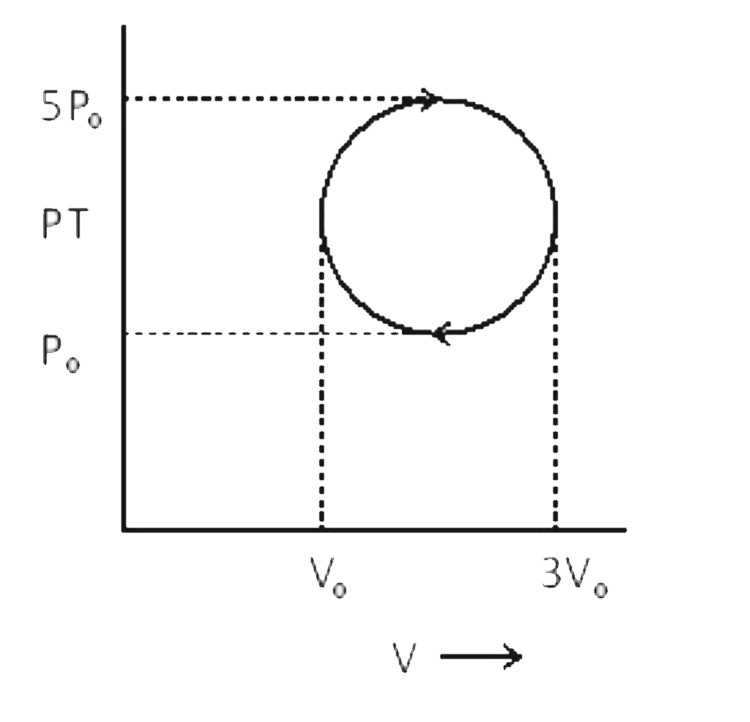
View SolutionP – V graph for a cyclic process is shown in figure . Work done is given by
 View Solution
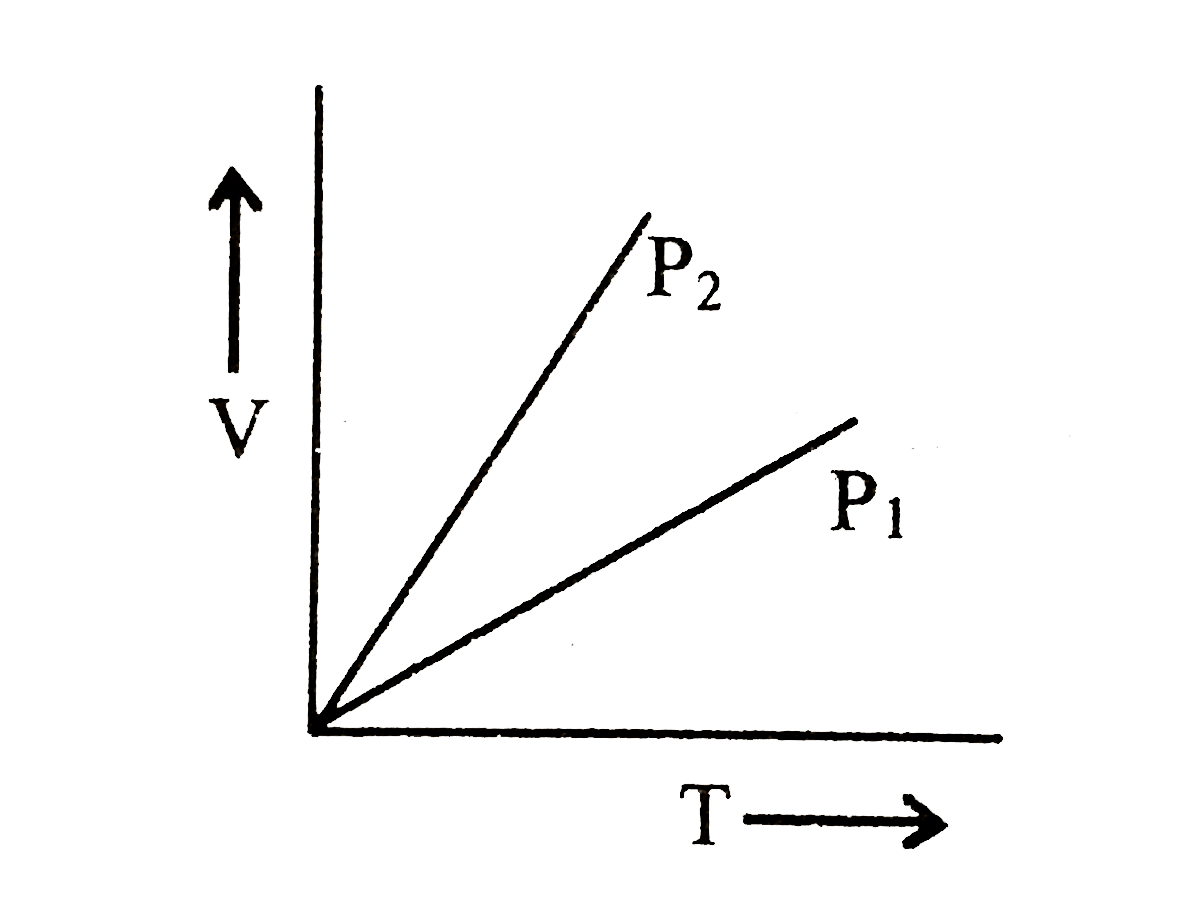
For V versus T curves at constant pressure P1andP2 for and ideal gas shown in figure-
 View Solution
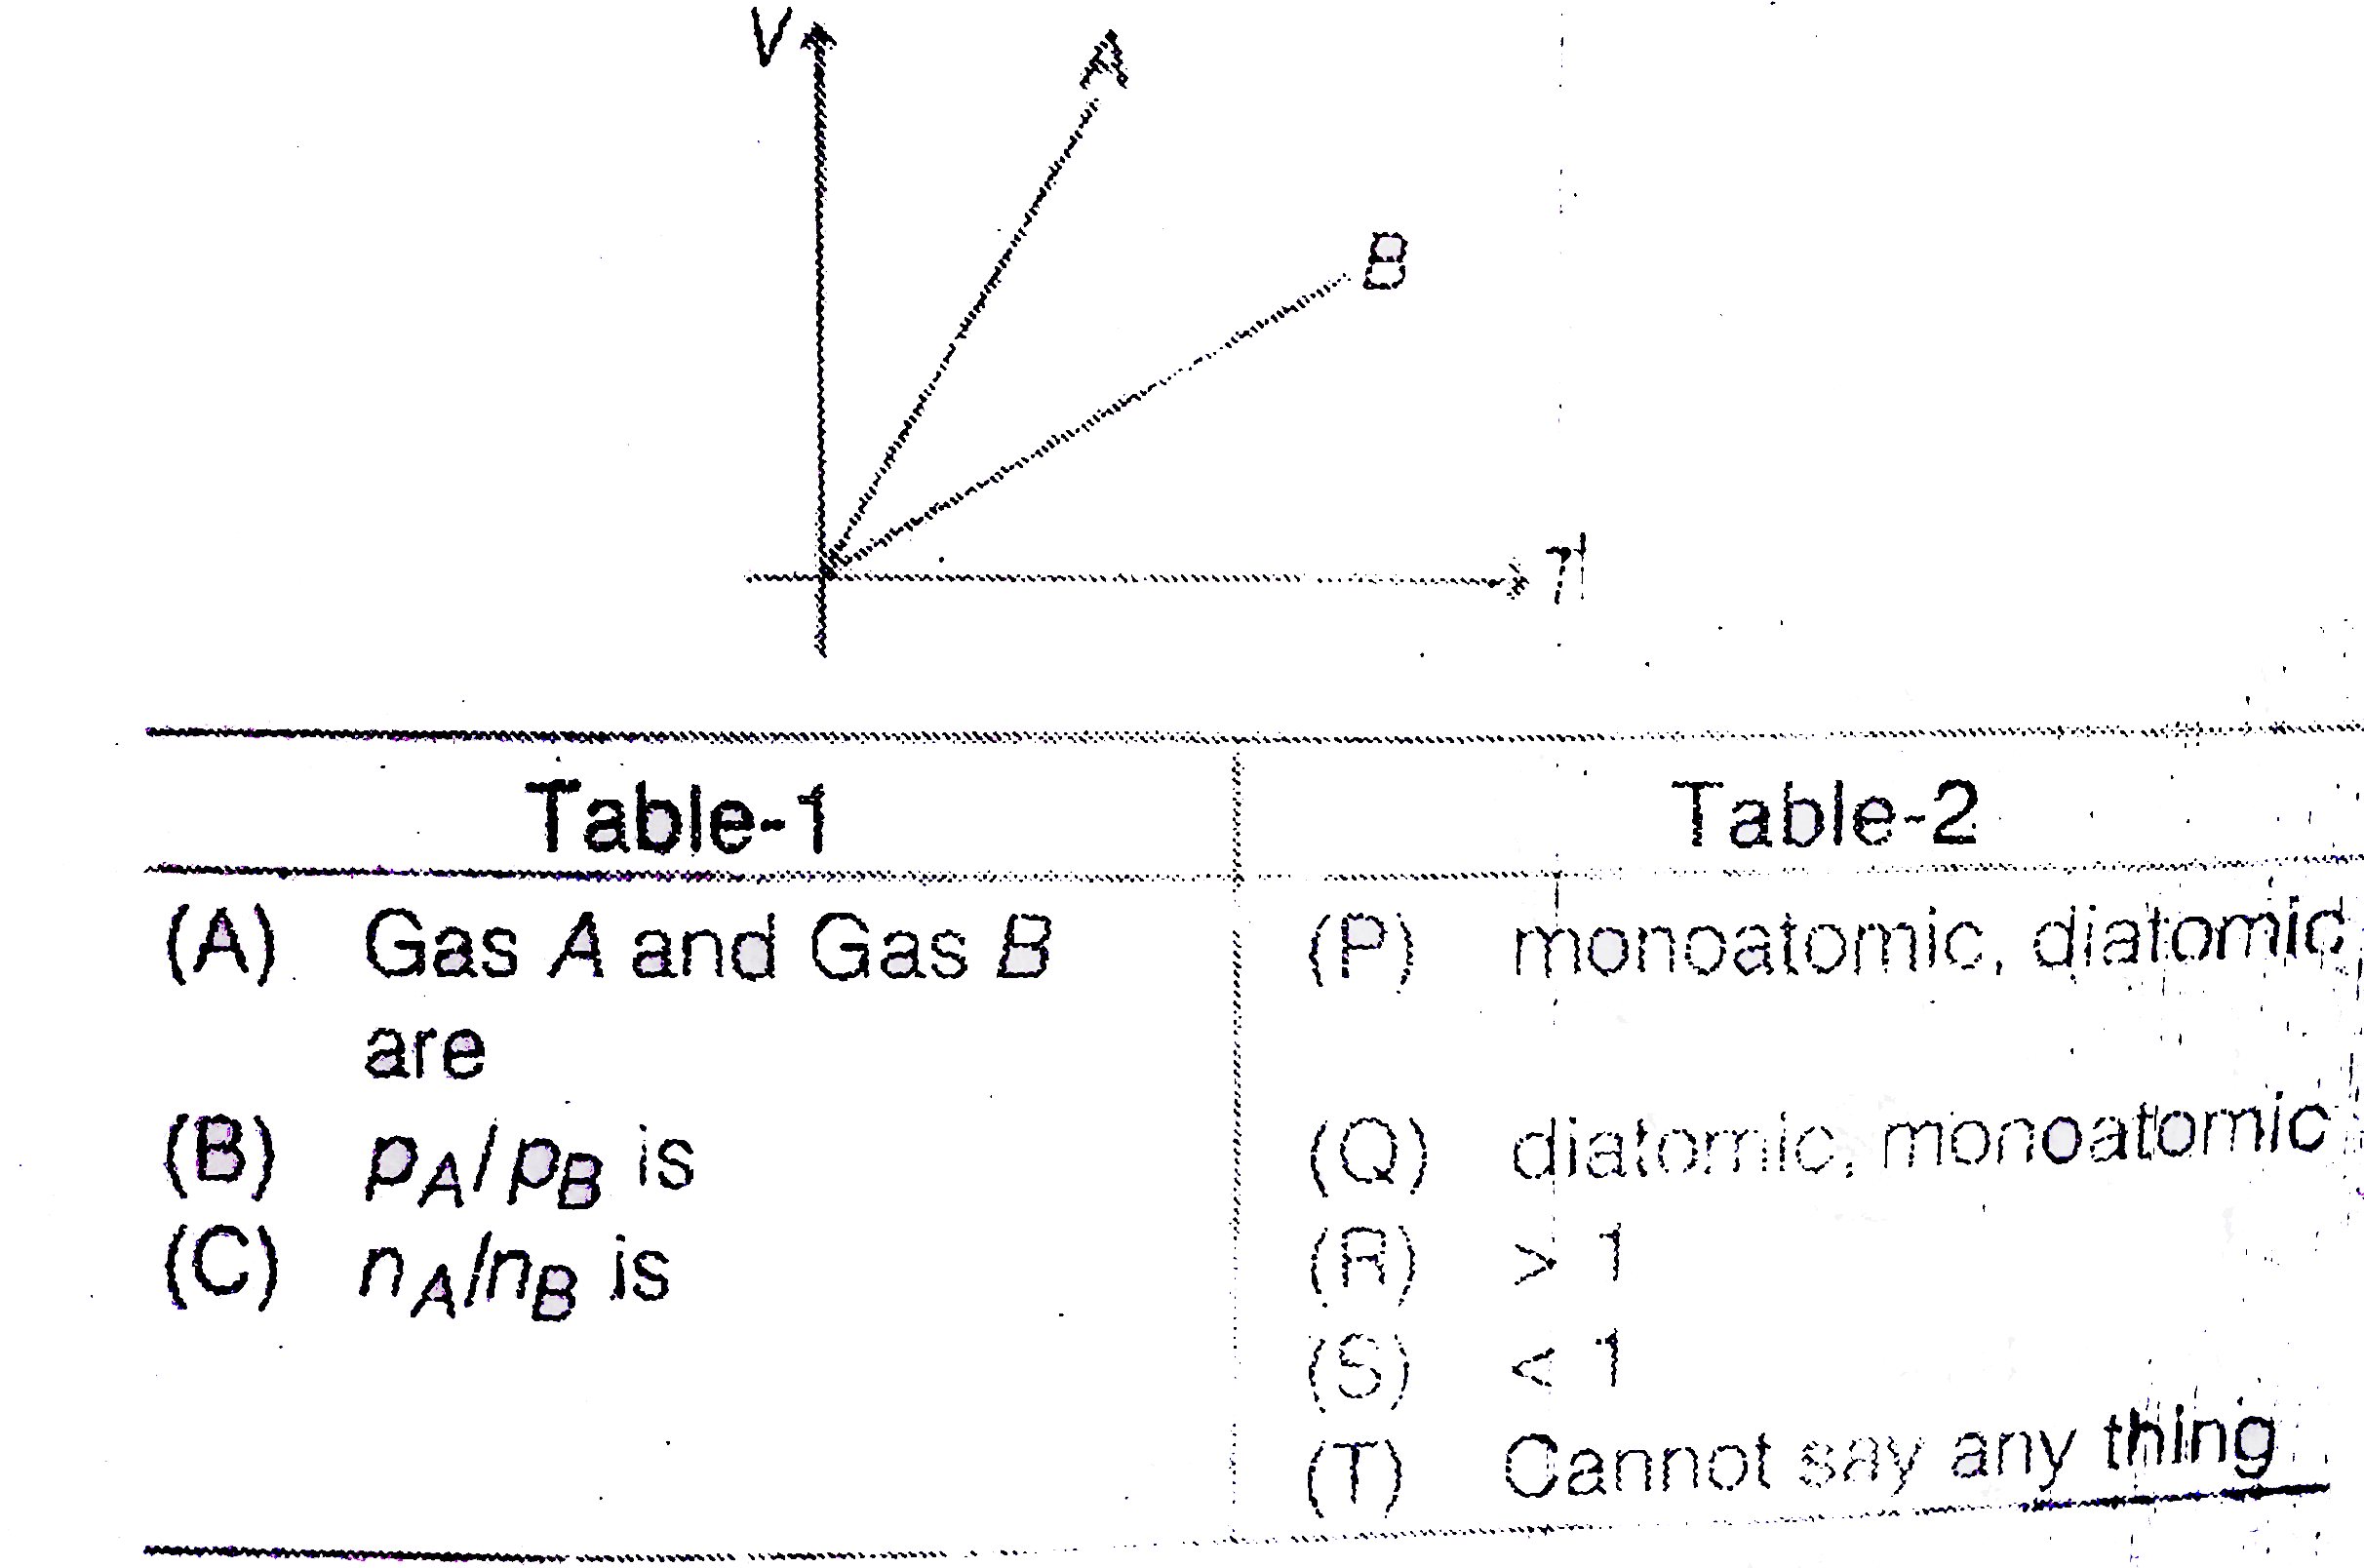
In the V-T graph shown in figure match the following.
 View Solution
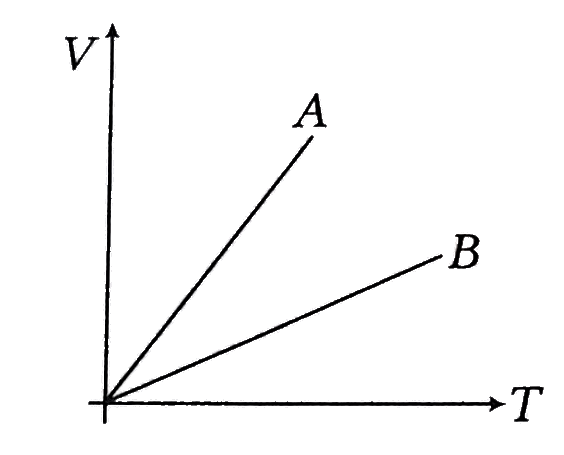
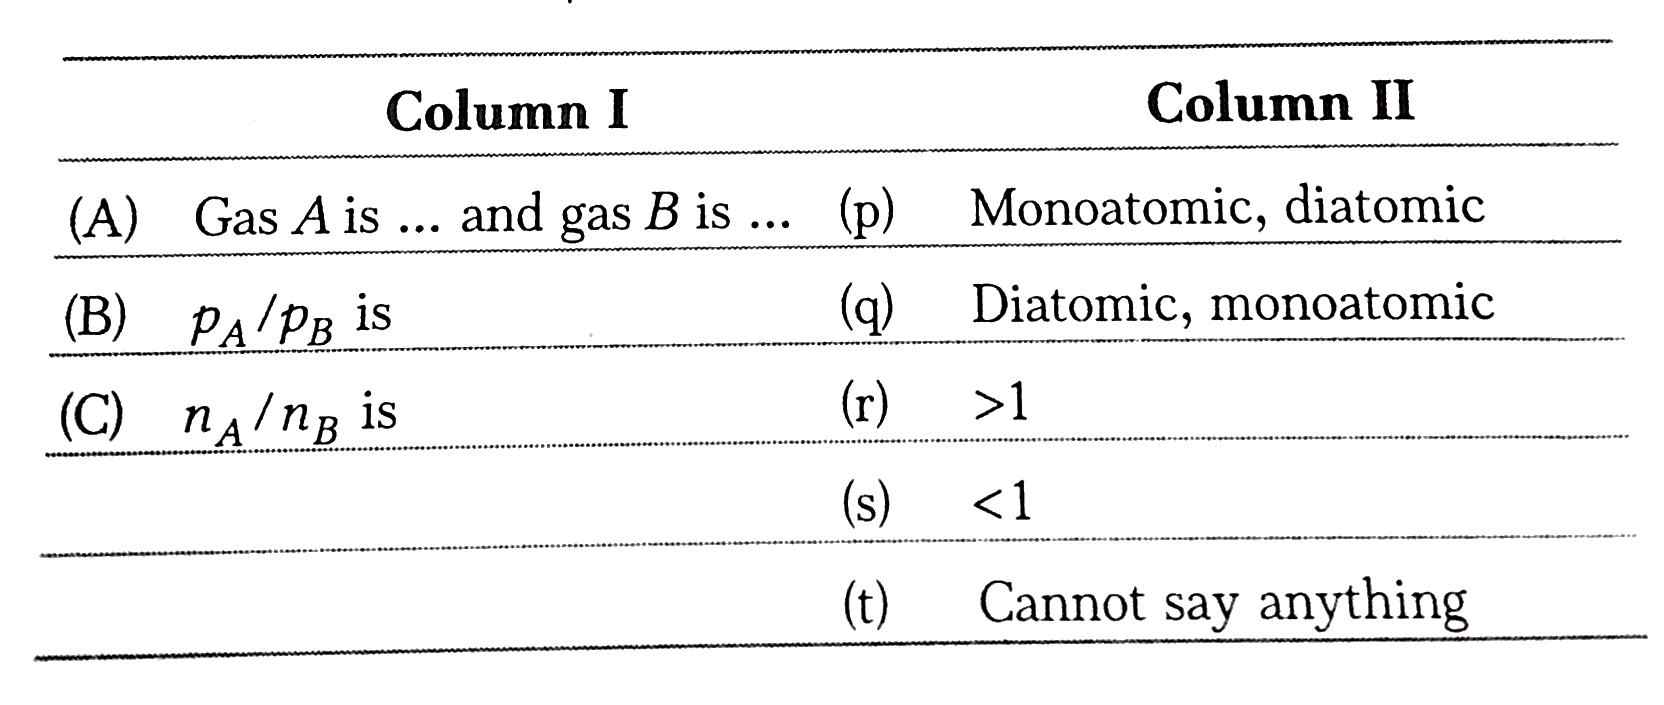
In the V-T graph shown in the figure match the following columns.
 View Solution
Pressure temperature (p-1) graph of n moles of an ideal gas is shown in the figure. Among the following four graphs, which are the corresponding pressure volume (p-V) and density pressure (p-p) graphs?
 View Solution
P-V graph of a cyclic process is as shown in the figure.Then its correct T-V curve would be
View Solution

