One mole of an ideal gas goes from an initial state A to final state B via two processs : It first undergoes isothermal expansion from volume to and then its volume is reduced from to at constant pressure. The correct diagram representing the two process in (figure)
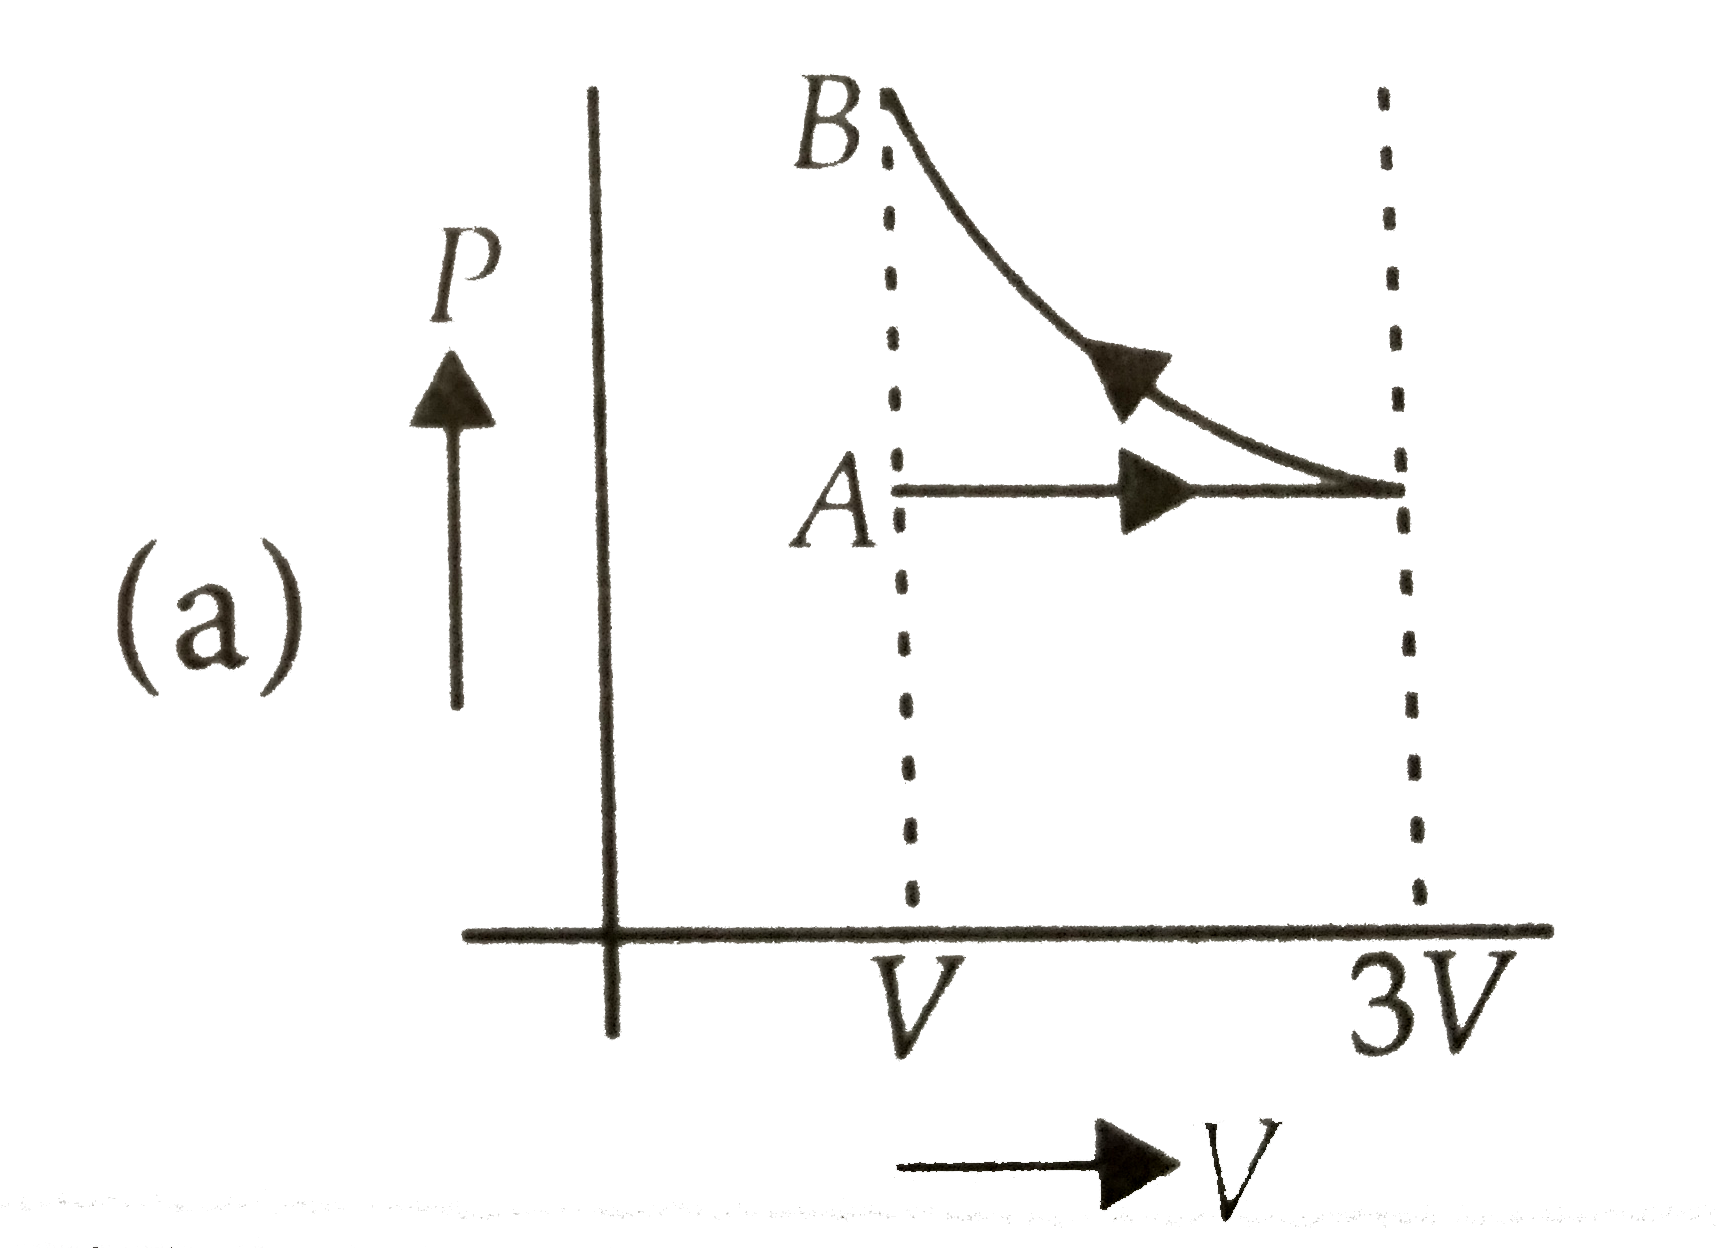
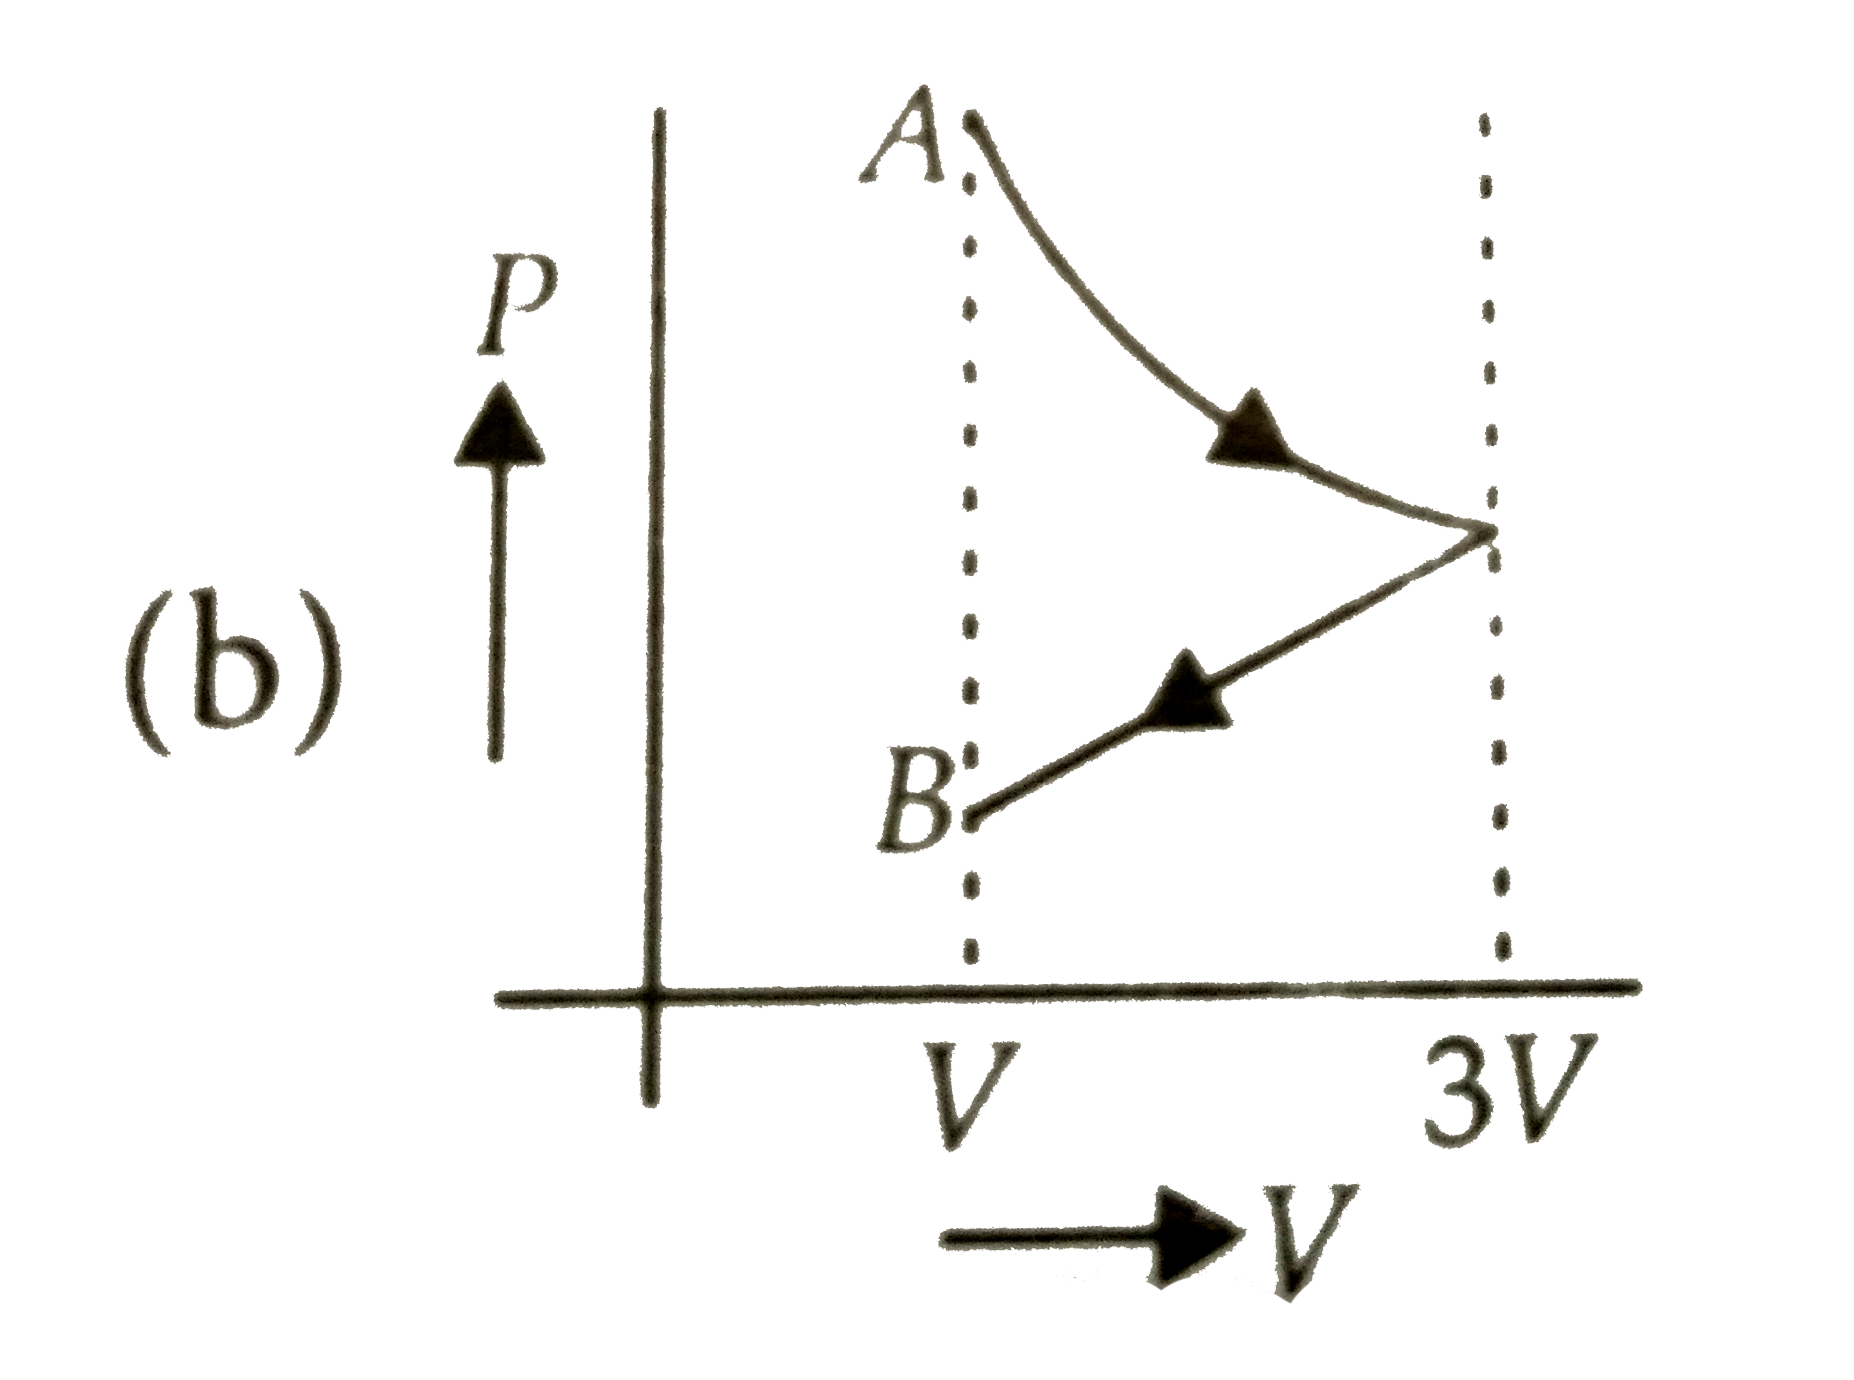
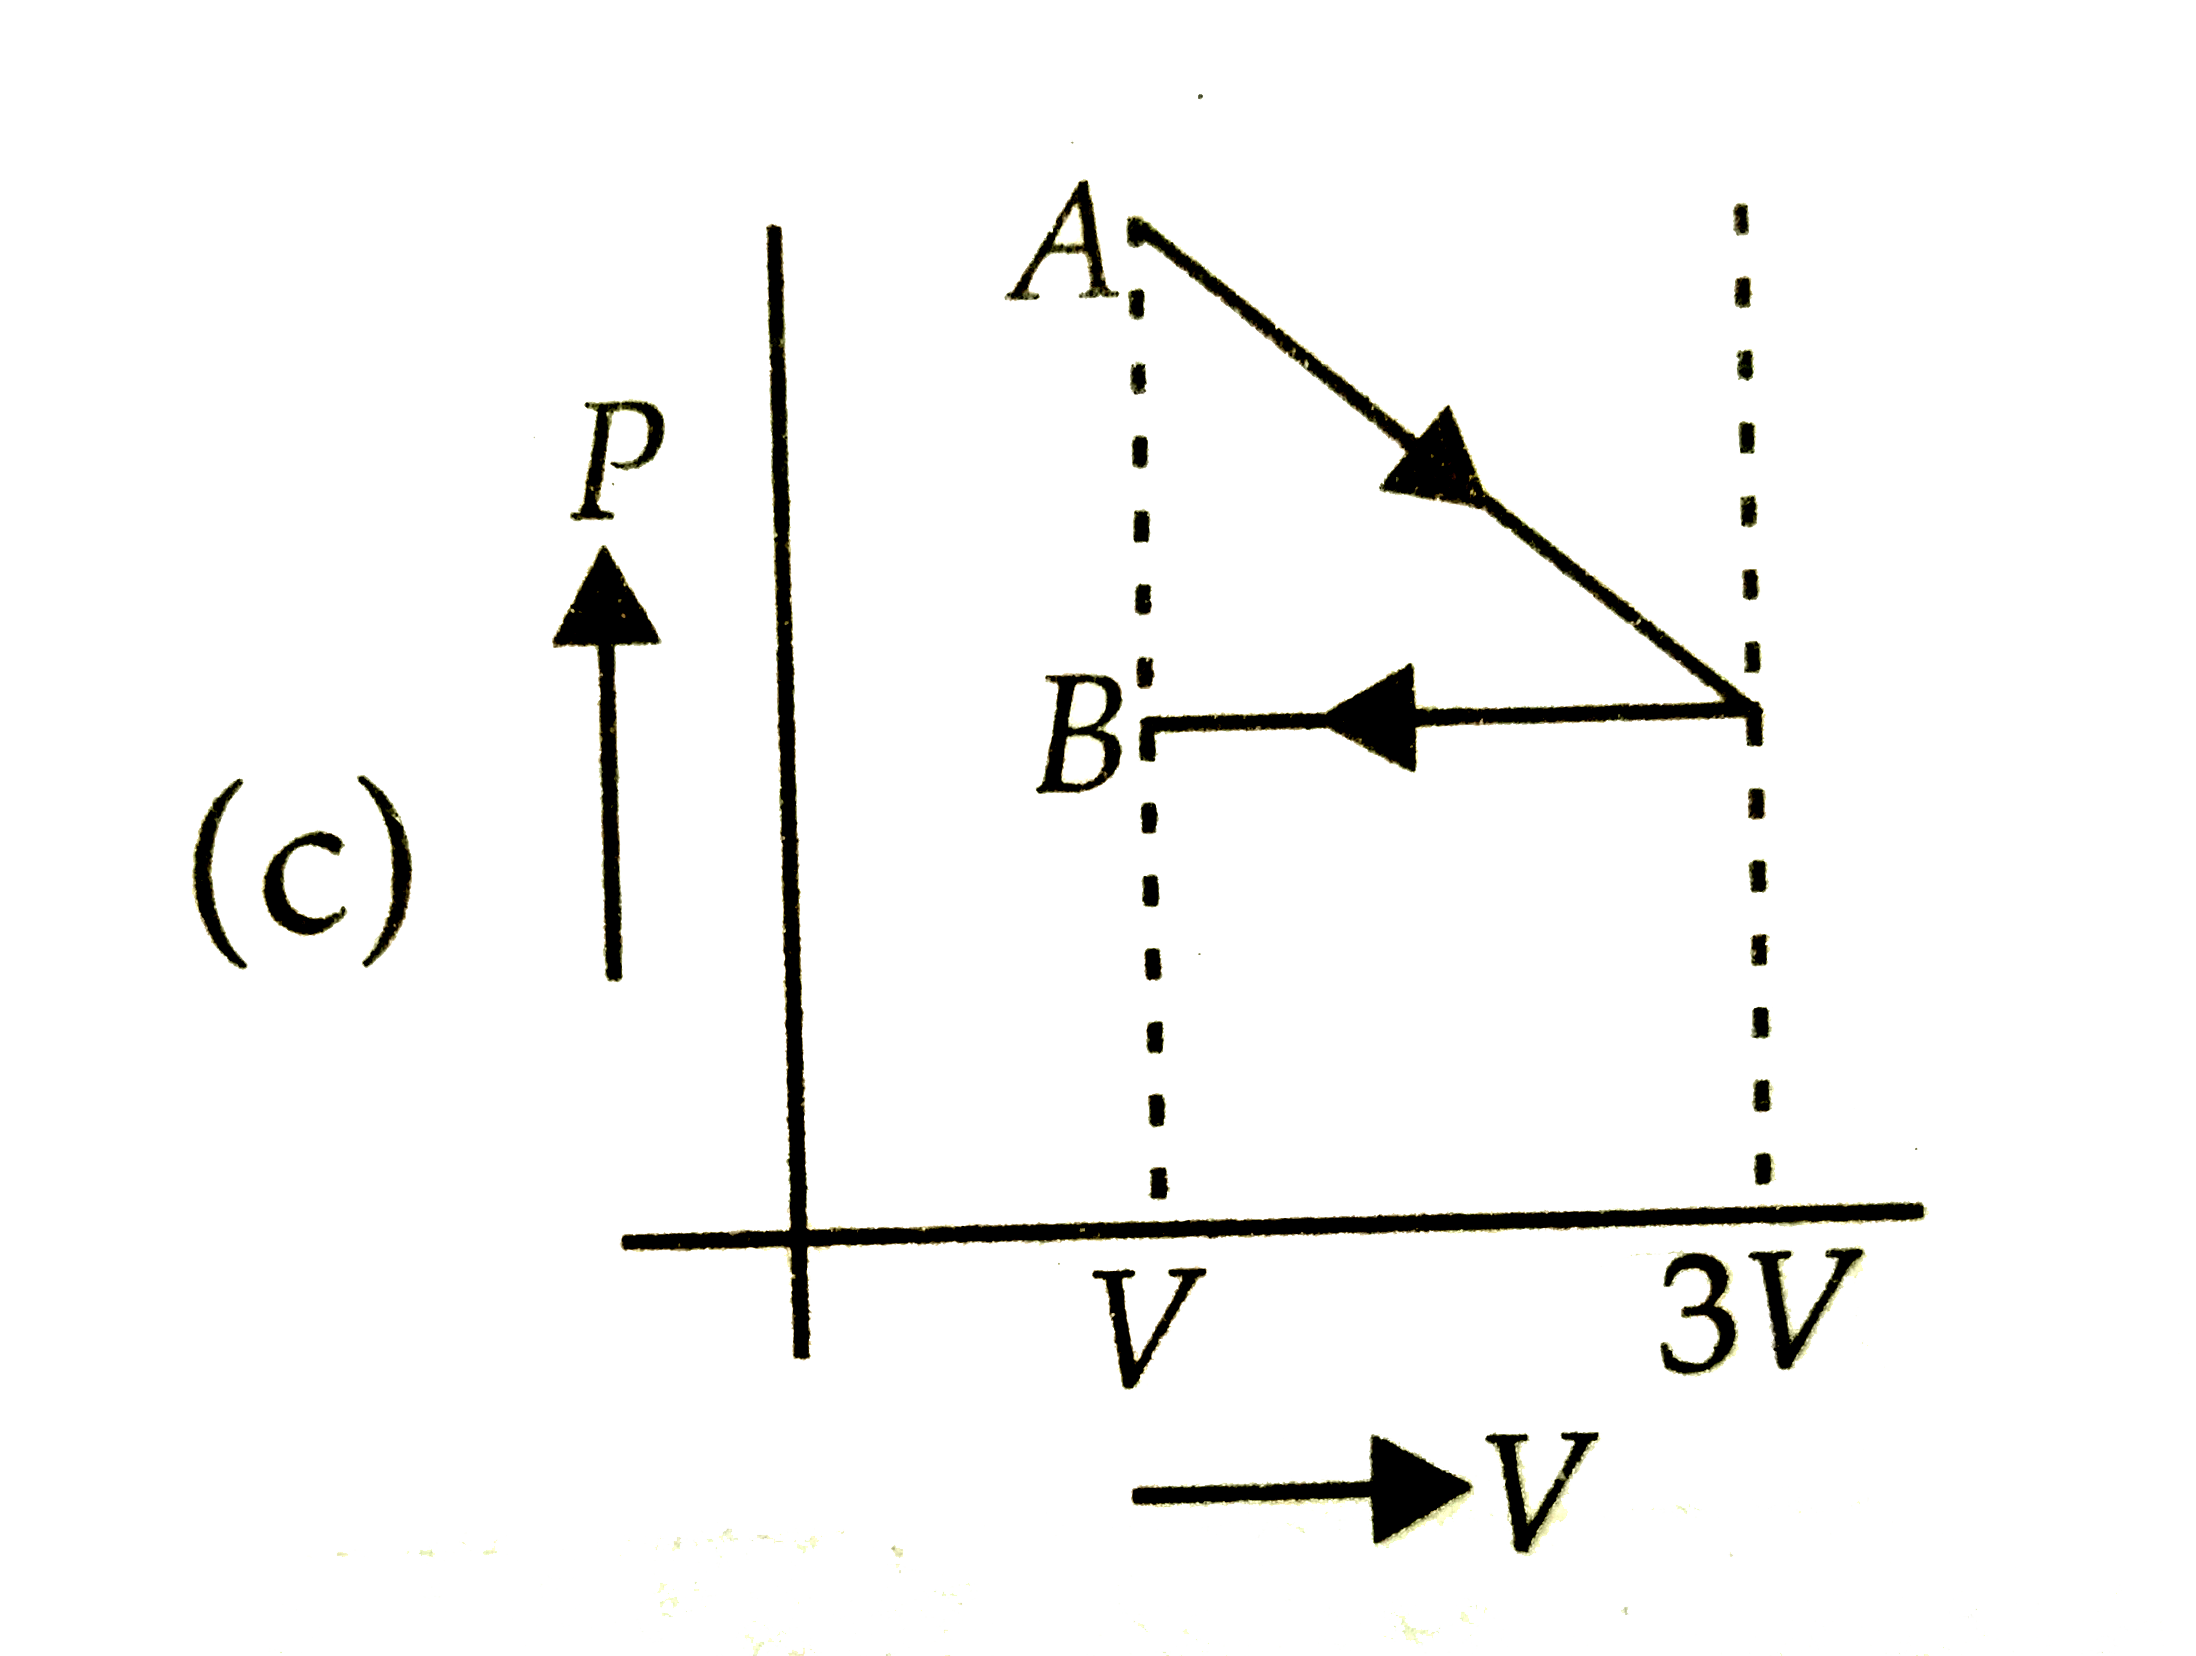
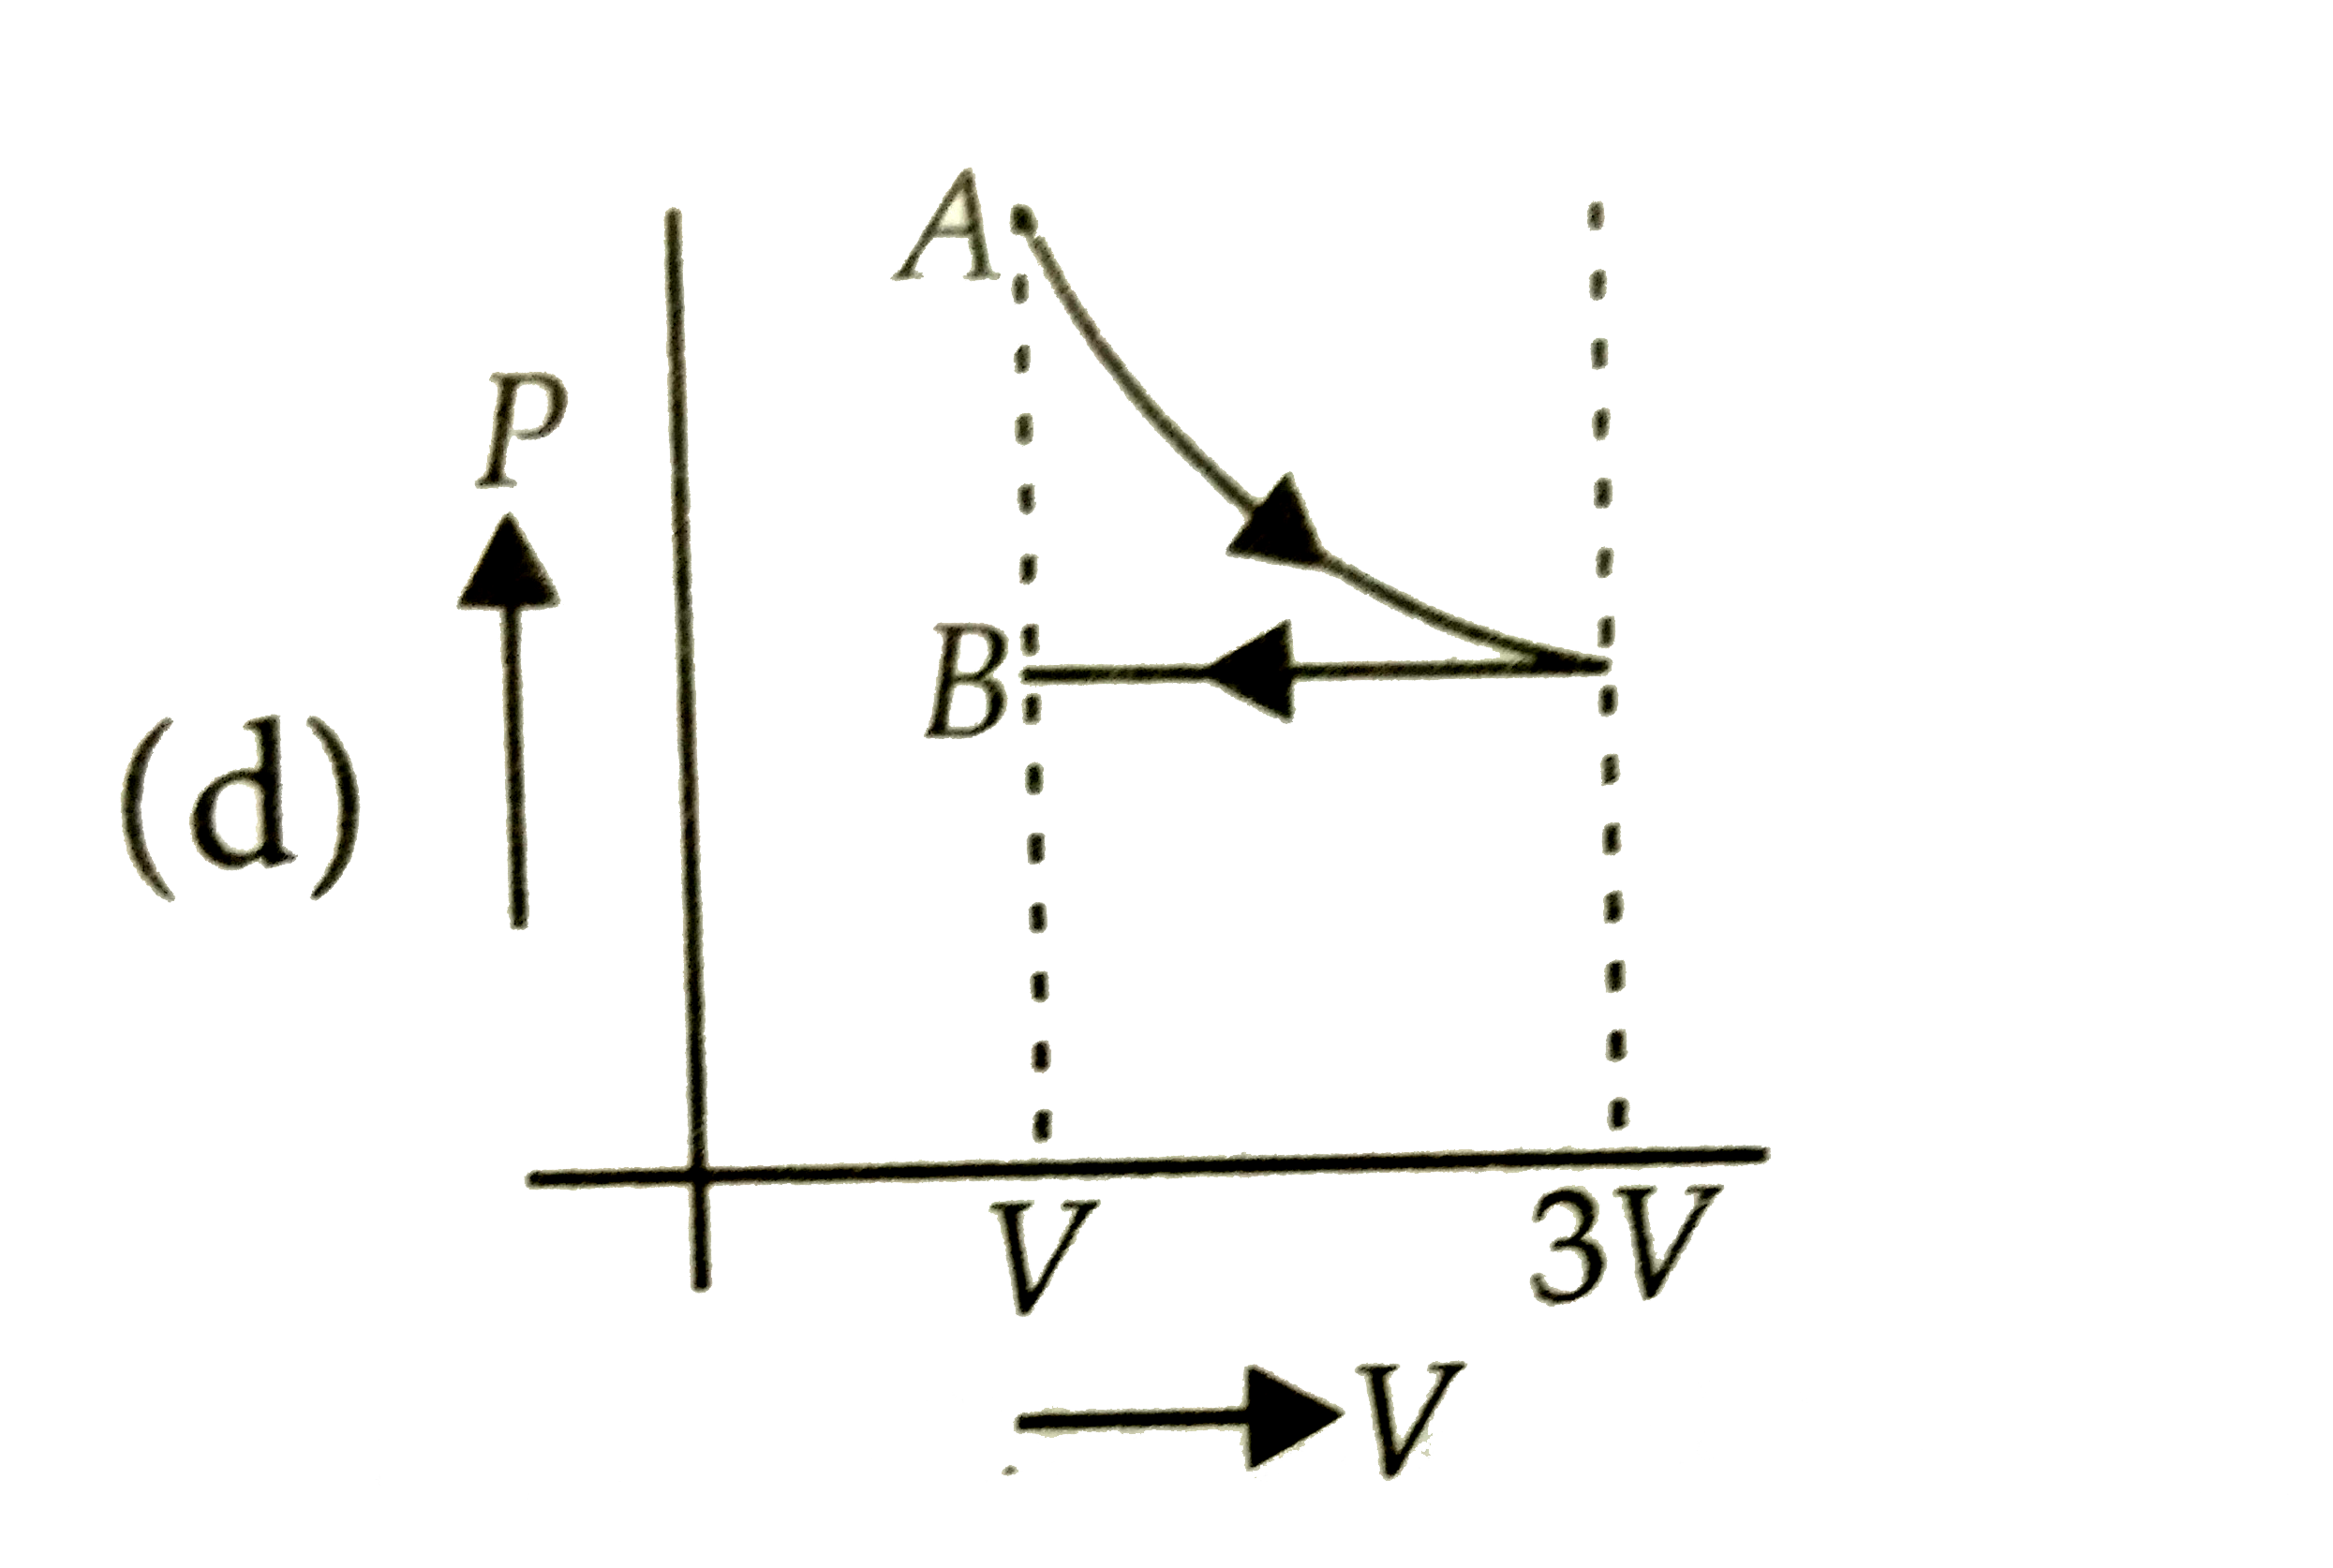
The correct Answer is:D
To solve the problem step by step, we will analyze the two processes that the ideal gas undergoes and then sketch the corresponding P-V diagram.
Step 1: Identify the Initial and Final States
- The initial state (A) has a volume of V.
- The final state (B) has a volume of V after going through two processes.
Step 2: Process 1 - Isothermal Expansion
- The gas undergoes an isothermal expansion from volume V to 3V.
- In an isothermal process, the temperature remains constant. According to the ideal gas law, PV=nRT, where n is the number of moles and R is the gas constant.
- Since n and R are constants, the product PV remains constant during this process.
- As the volume increases from V to 3V, the pressure must decrease. This relationship is inversely proportional, which means the graph will be a hyperbola that slopes downwards.
Step 3: Process 2 - Isobaric Compression
- The second process is a constant pressure (isobaric) process where the volume decreases from 3V to V.
- Since the pressure remains constant during this process, the P-V diagram will show a horizontal line at the pressure level corresponding to the pressure at volume 3V.
- The line will extend from 3V to V, indicating that the volume is decreasing while the pressure remains constant.
Step 4: Sketch the P-V Diagram
- On the P-V diagram:
- Start at point A (volume V, pressure PA).
- Draw a curve from point A to point C (volume 3V, pressure PC), indicating the isothermal expansion.
- From point C, draw a horizontal line to point B (volume V, pressure PC), indicating the isobaric compression.
Step 5: Identify the Correct P-V Diagram
- Based on the description of the processes, we can now identify the correct P-V diagram from the options provided. The correct diagram should show:
- A downward-sloping curve from V to 3V for the isothermal process.
- A horizontal line from 3V to V for the isobaric process.
Conclusion
The correct P-V diagram representing the two processes is option D, as it accurately reflects the isothermal expansion followed by the isobaric compression.
- The initial state (A) has a volume of V.
- The final state (B) has a volume of V after going through two processes.
- The gas undergoes an isothermal expansion from volume V to 3V.
- In an isothermal process, the temperature remains constant. According to the ideal gas law, PV=nRT, where n is the number of moles and R is the gas constant.
- Since n and R are constants, the product PV remains constant during this process.
- As the volume increases from V to 3V, the pressure must decrease. This relationship is inversely proportional, which means the graph will be a hyperbola that slopes downwards.
- The second process is a constant pressure (isobaric) process where the volume decreases from 3V to V.
- Since the pressure remains constant during this process, the P-V diagram will show a horizontal line at the pressure level corresponding to the pressure at volume 3V.
- The line will extend from 3V to V, indicating that the volume is decreasing while the pressure remains constant.
- On the P-V diagram:
- Start at point A (volume V, pressure PA).
- Draw a curve from point A to point C (volume 3V, pressure PC), indicating the isothermal expansion.
- From point C, draw a horizontal line to point B (volume V, pressure PC), indicating the isobaric compression.
- Based on the description of the processes, we can now identify the correct P-V diagram from the options provided. The correct diagram should show:
- A downward-sloping curve from V to 3V for the isothermal process.
- A horizontal line from 3V to V for the isobaric process.
The correct P-V diagram representing the two processes is option D, as it accurately reflects the isothermal expansion followed by the isobaric compression.
Topper's Solved these Questions
- BOOK - NCERT FINGERTPS ENGLISHCHAPTER - THERMODYNAMICSEXERCISE - HOTs8videos
THERMODYNAMICS
- BOOK - NCERT FINGERTPS ENGLISHCHAPTER - THERMODYNAMICSEXERCISE - Assertion & Reason15videos
THERMODYNAMICS
- BOOK - NCERT FINGERTPS ENGLISHCHAPTER - THERMAL PROPERTIES OF MATTEREXERCISE - Assertion And Reason10videos
THERMAL PROPERTIES OF MATTER
- BOOK - NCERT FINGERTPS ENGLISHCHAPTER - UNITS AND MEASUREMENTSEXERCISE - Assertion And Reason15videos
UNITS AND MEASUREMENTS
Similar Questions
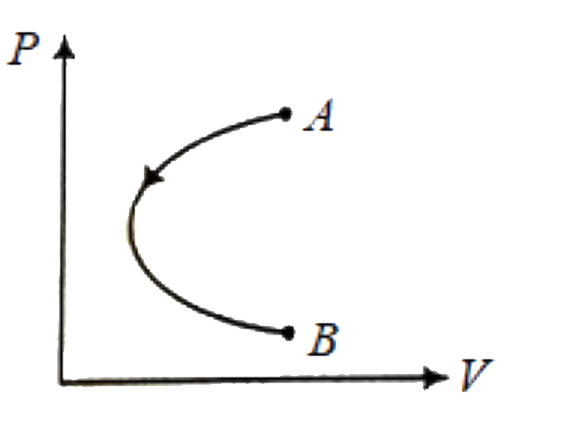
P - V diagram of an ideal gas is shown. The gas undergoes from initial state A to final state B such that initial and final volumes are same. Select the correct alternative for given process AB.
 View Solution
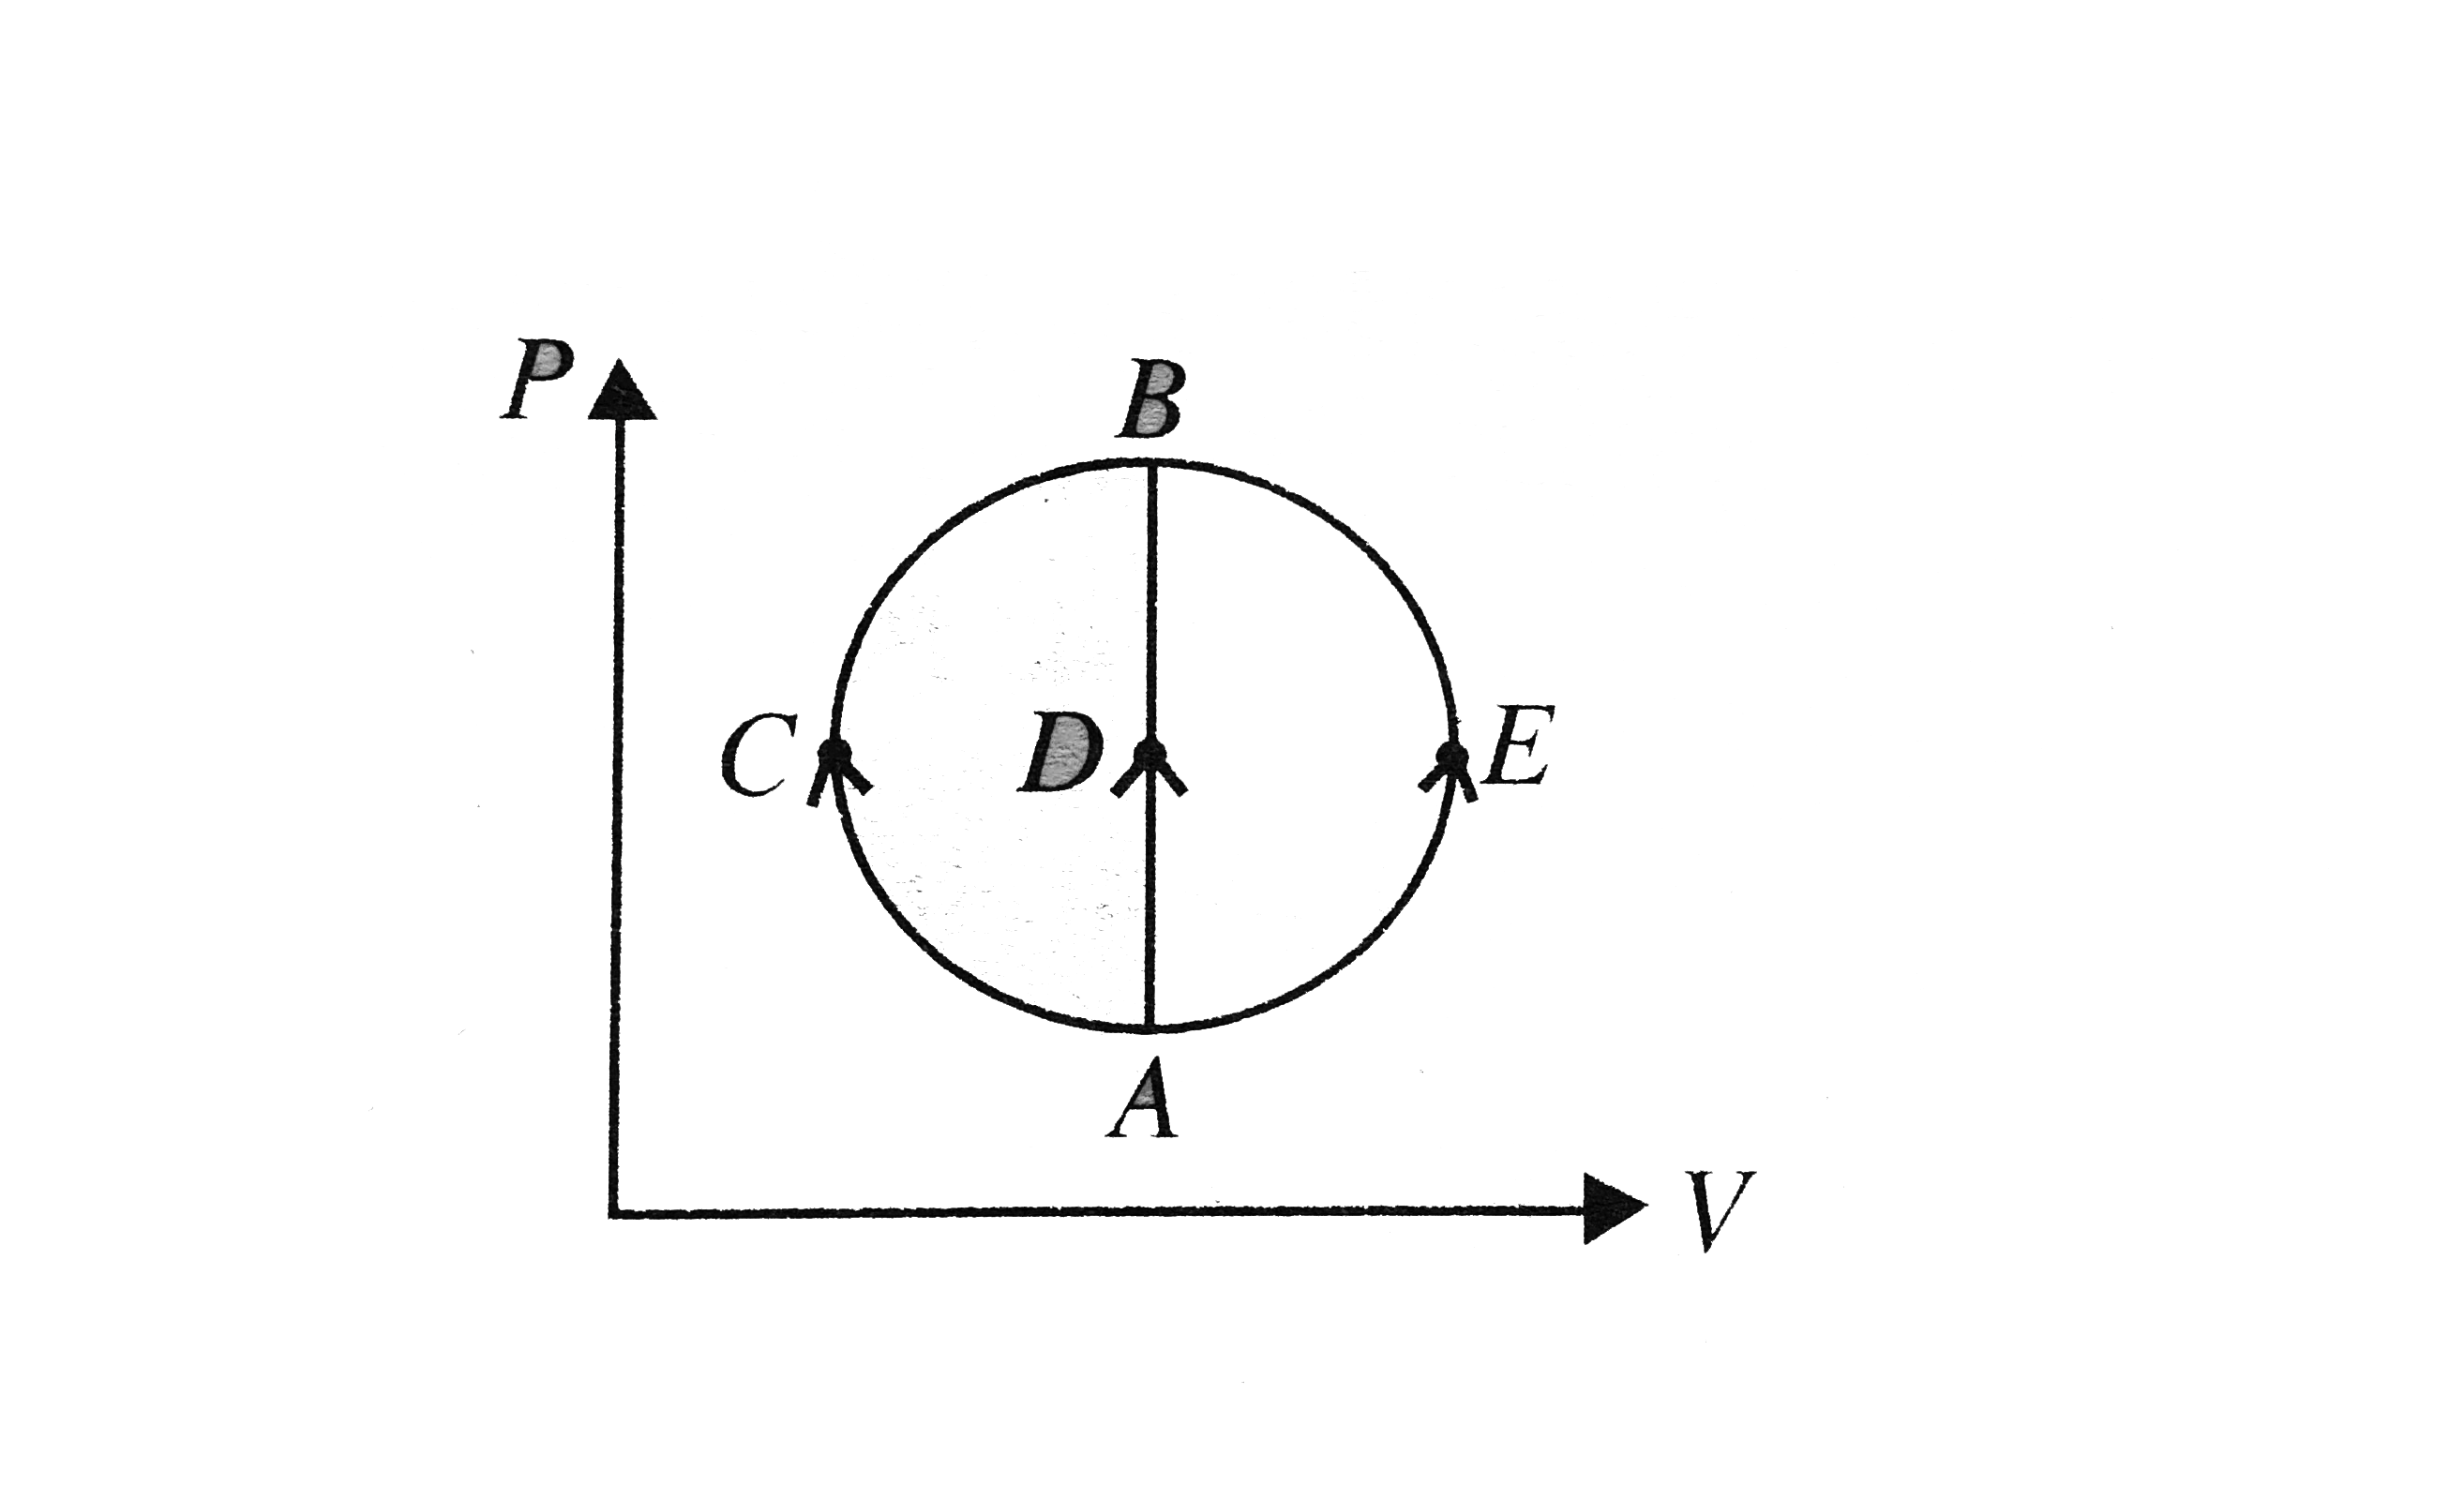
One mole of an ideal gas is taken from state A to state B by three different processes (a) ACB, (b) ADB and (c ) AEB as shown in the P−V diagram. The heat absorbed by the gas is
 View Solution
Knowledge Check
- Question 1 - Select One
An ideal gas undergoes isothermal process from some initial state i to final state f. Choose the correct alternatives.
A1.dU=dQB2. dU=-dWC3. dU=0D4. dU=dW - Question 2 - Select One
The initial state of certain gas (PiViTi).It undergoes expansion till its volume becomes Vf at constant temperature T. The correct plot of P-V diagram for it is
A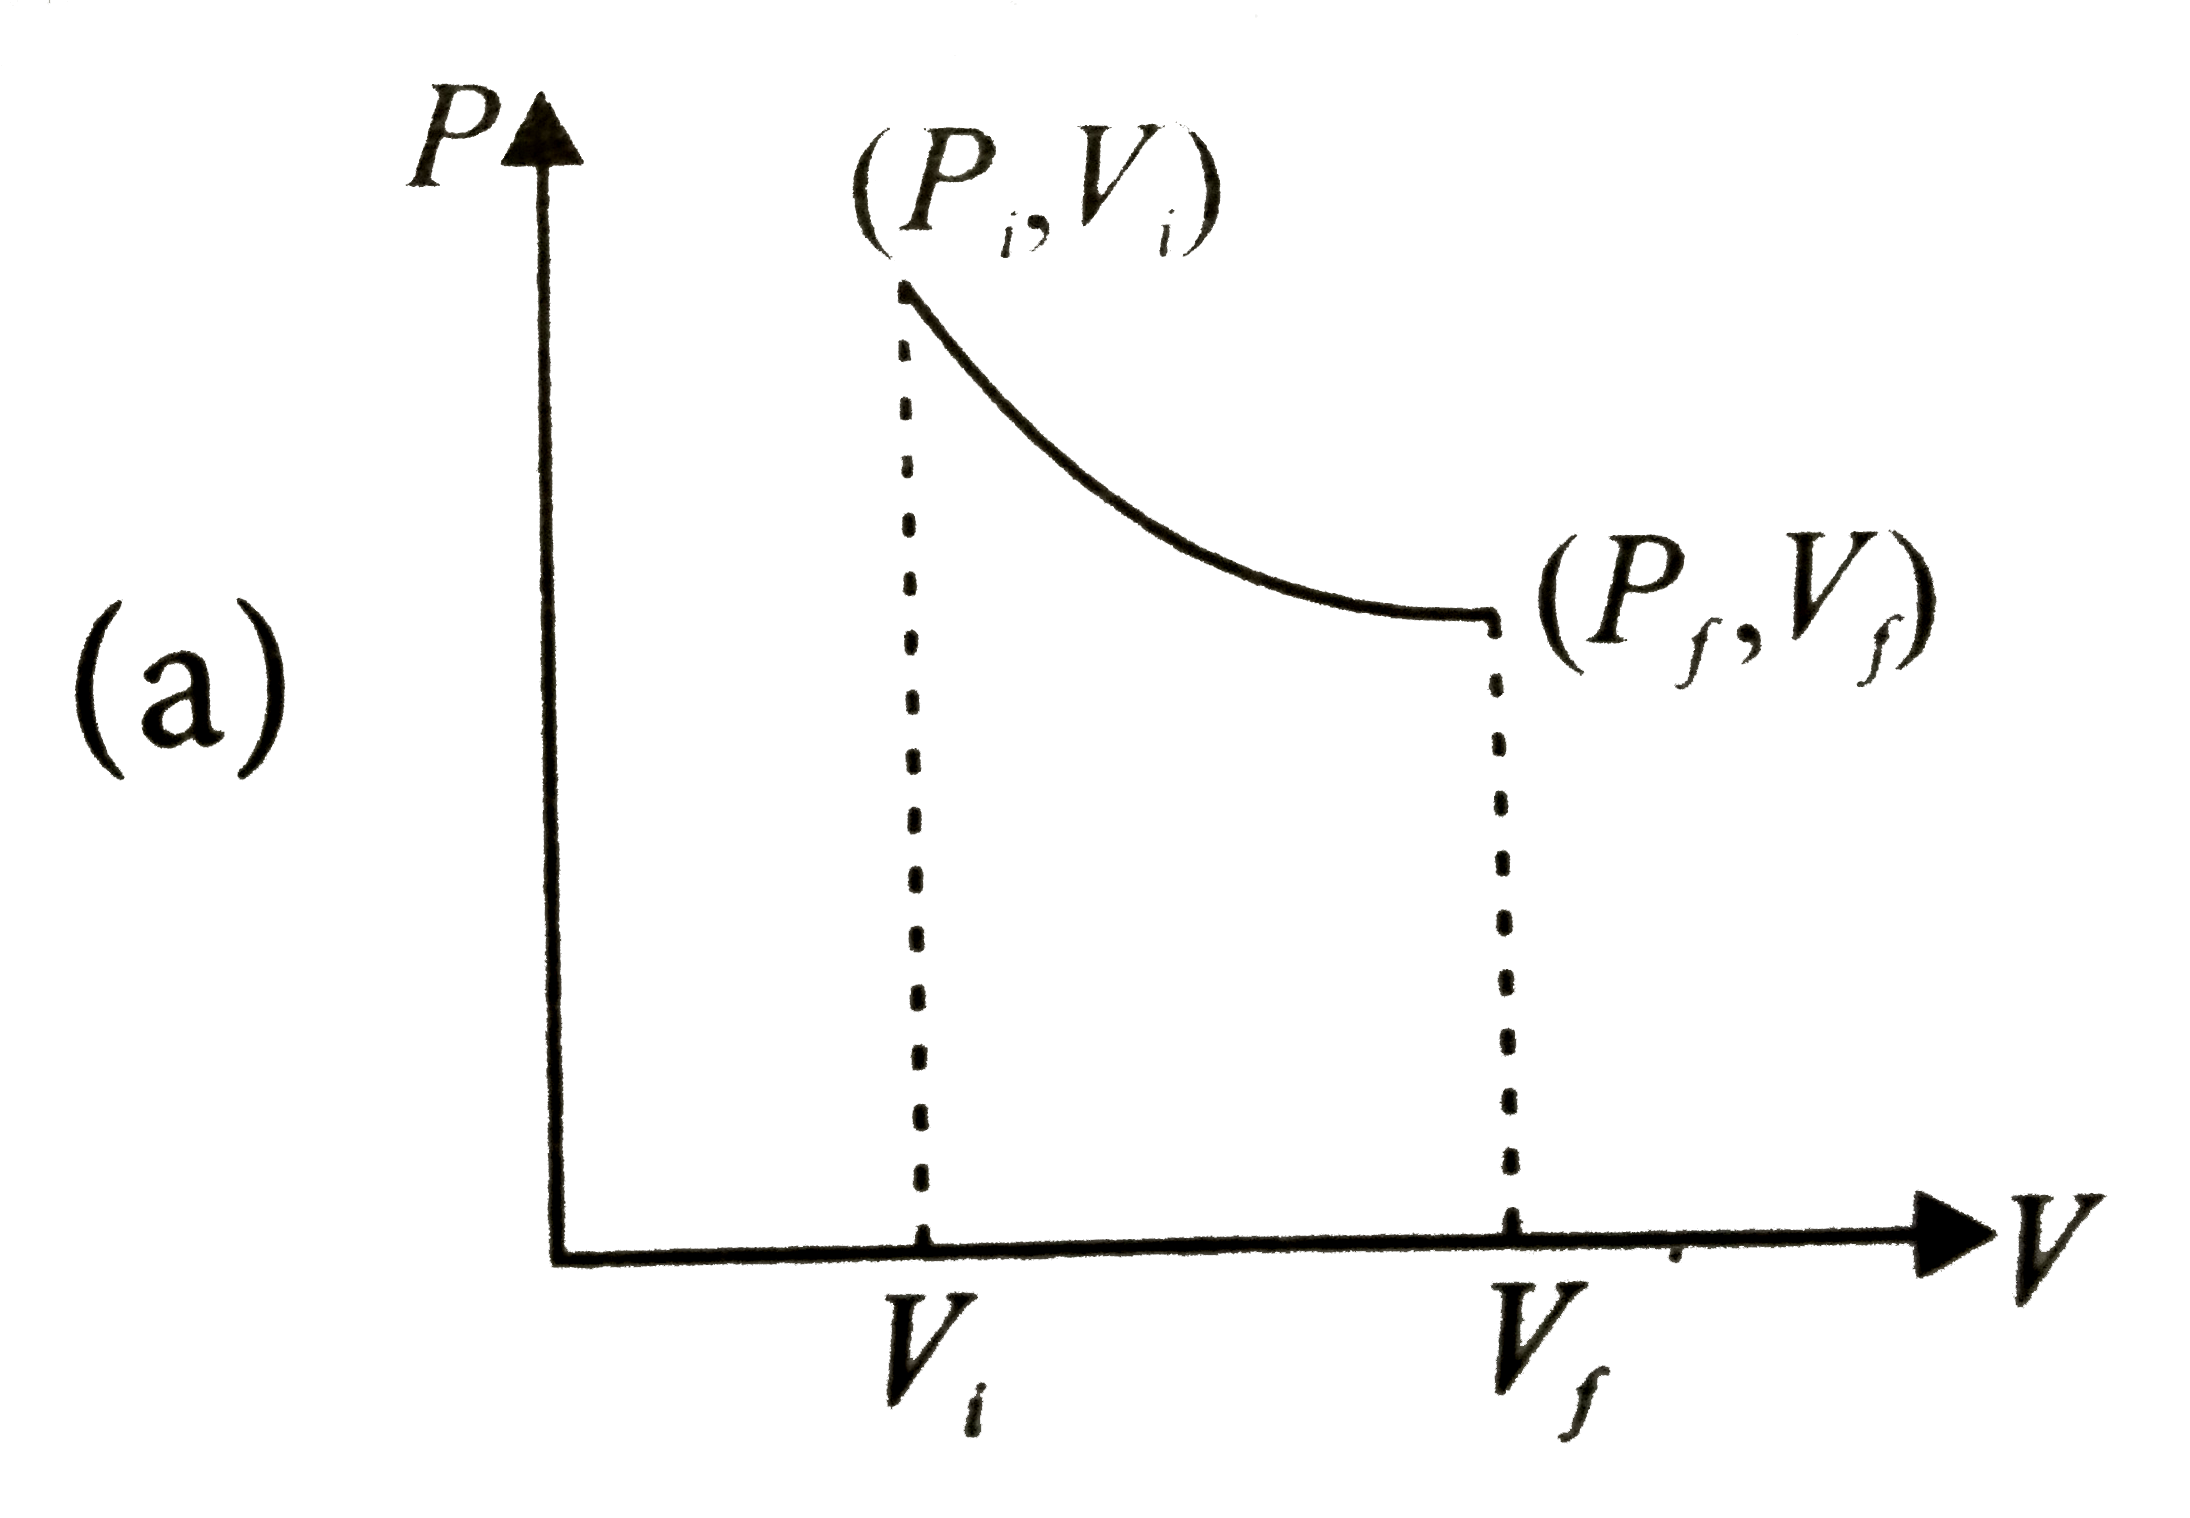 B
B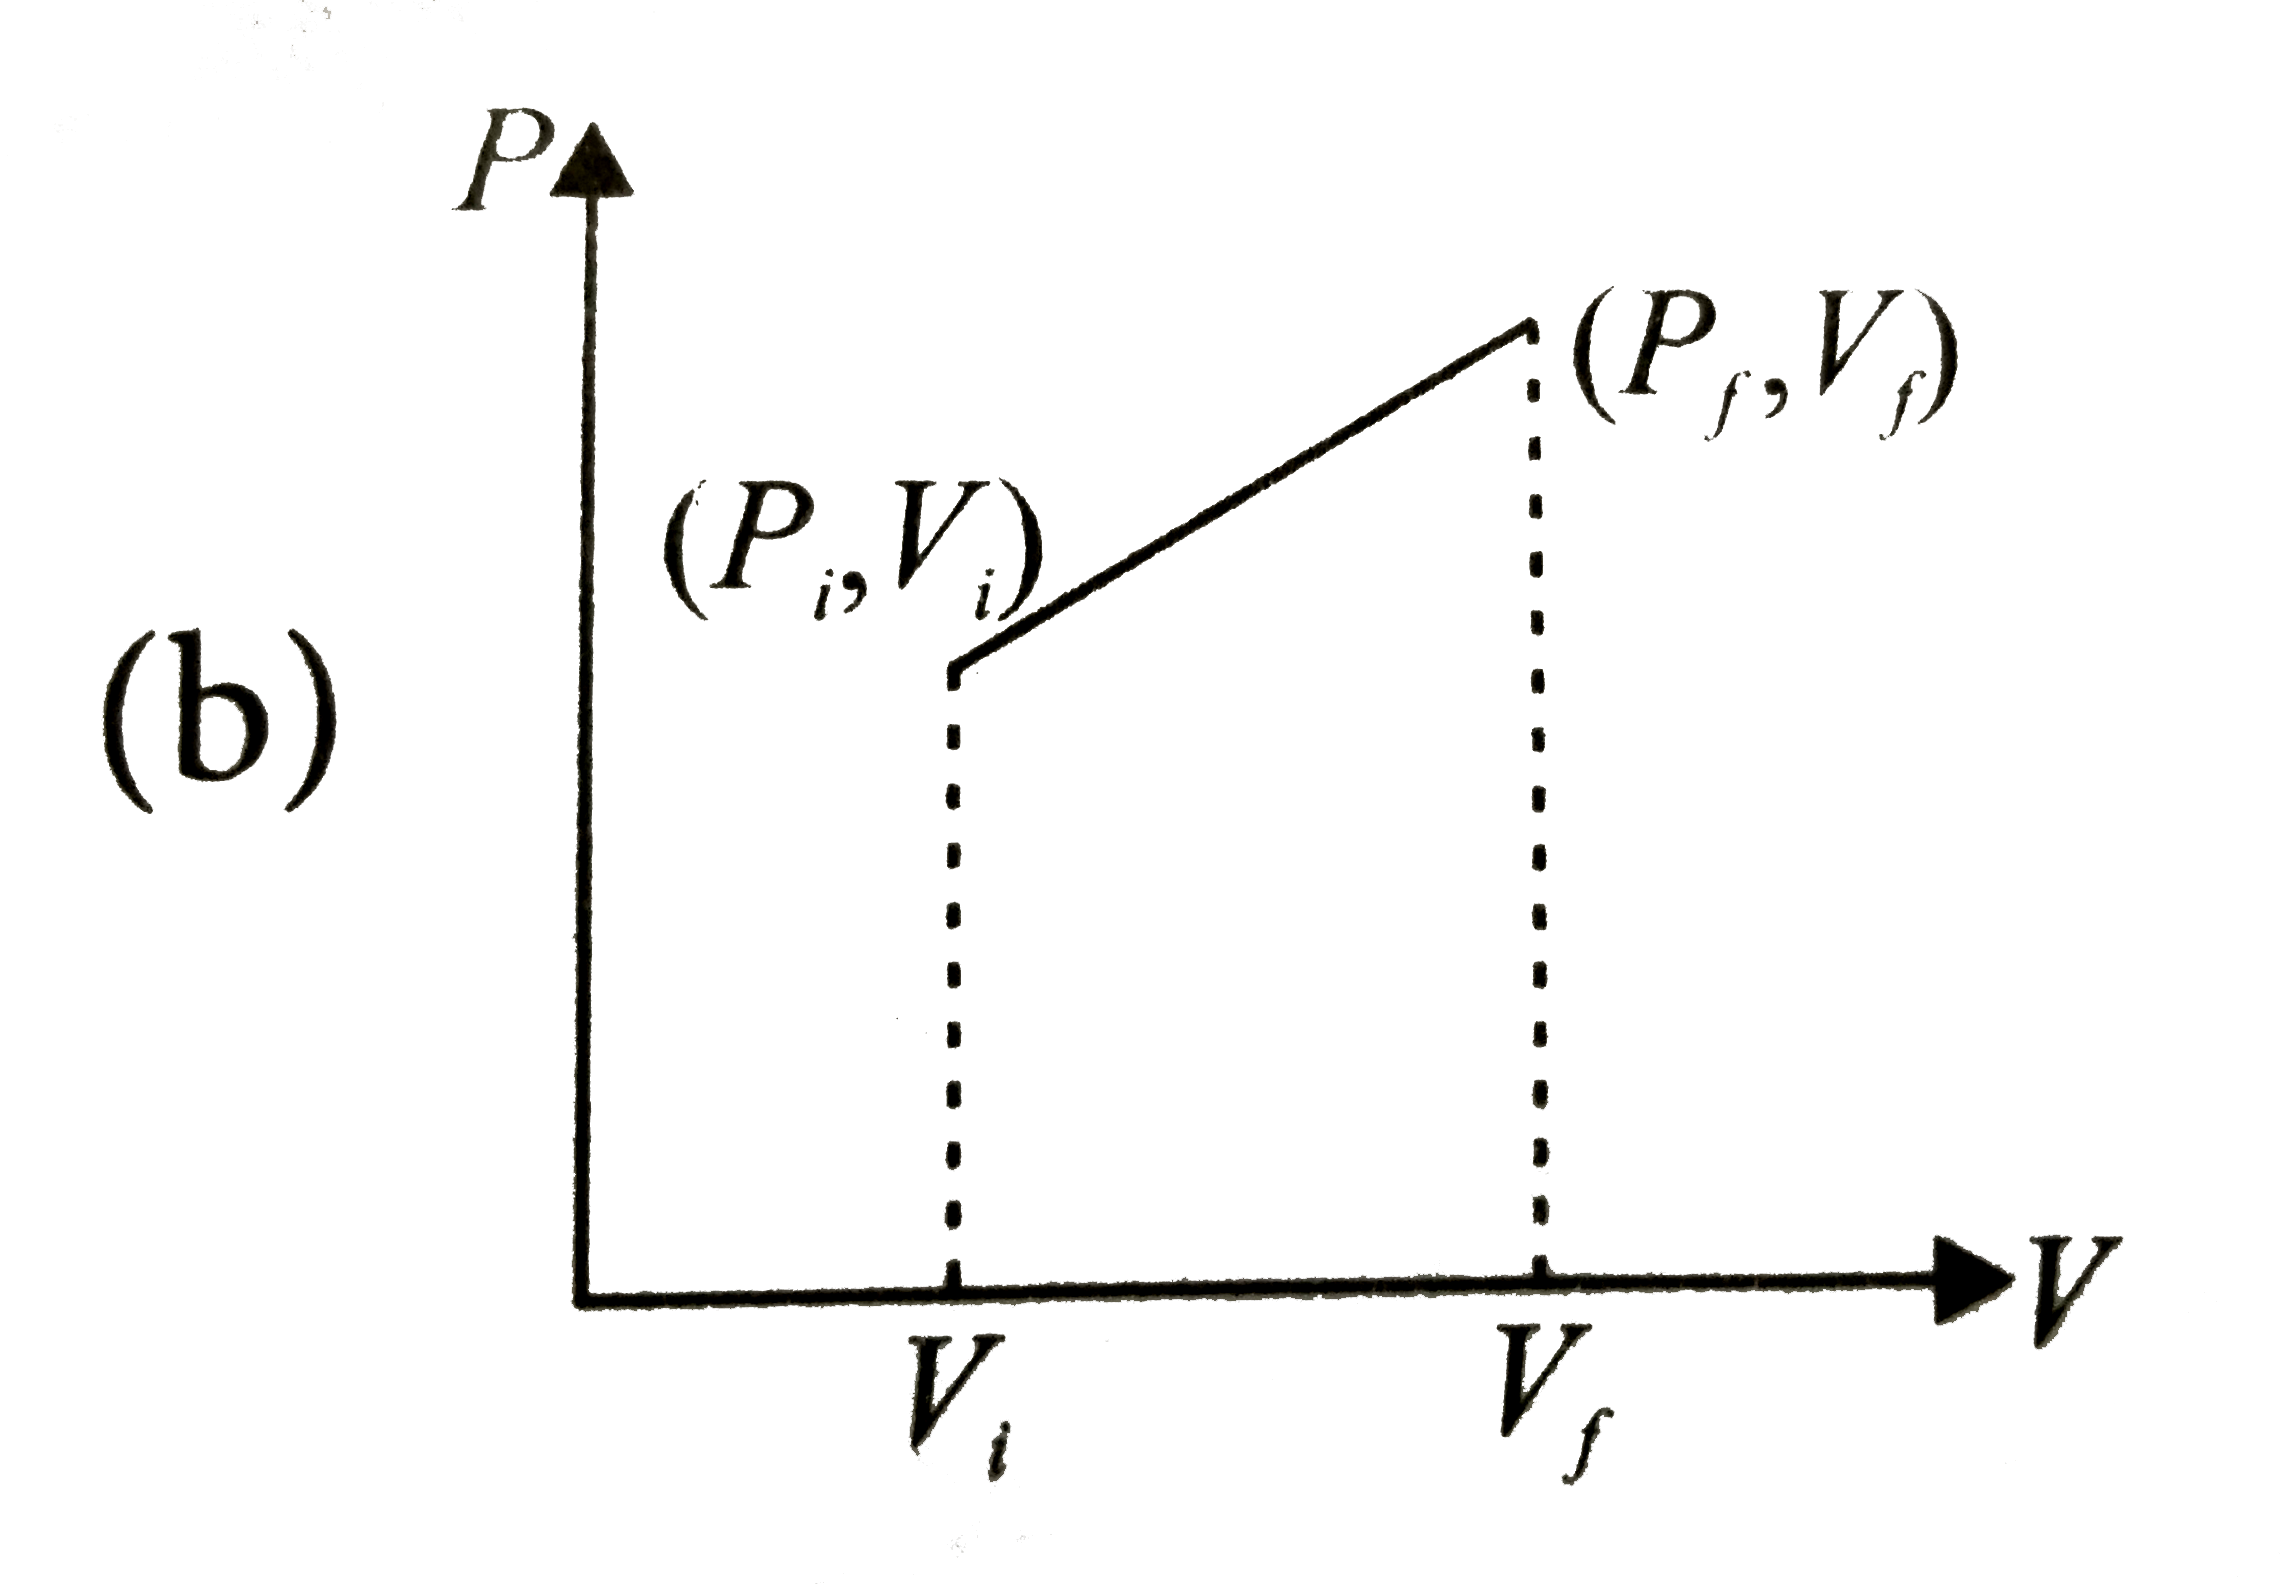 C
C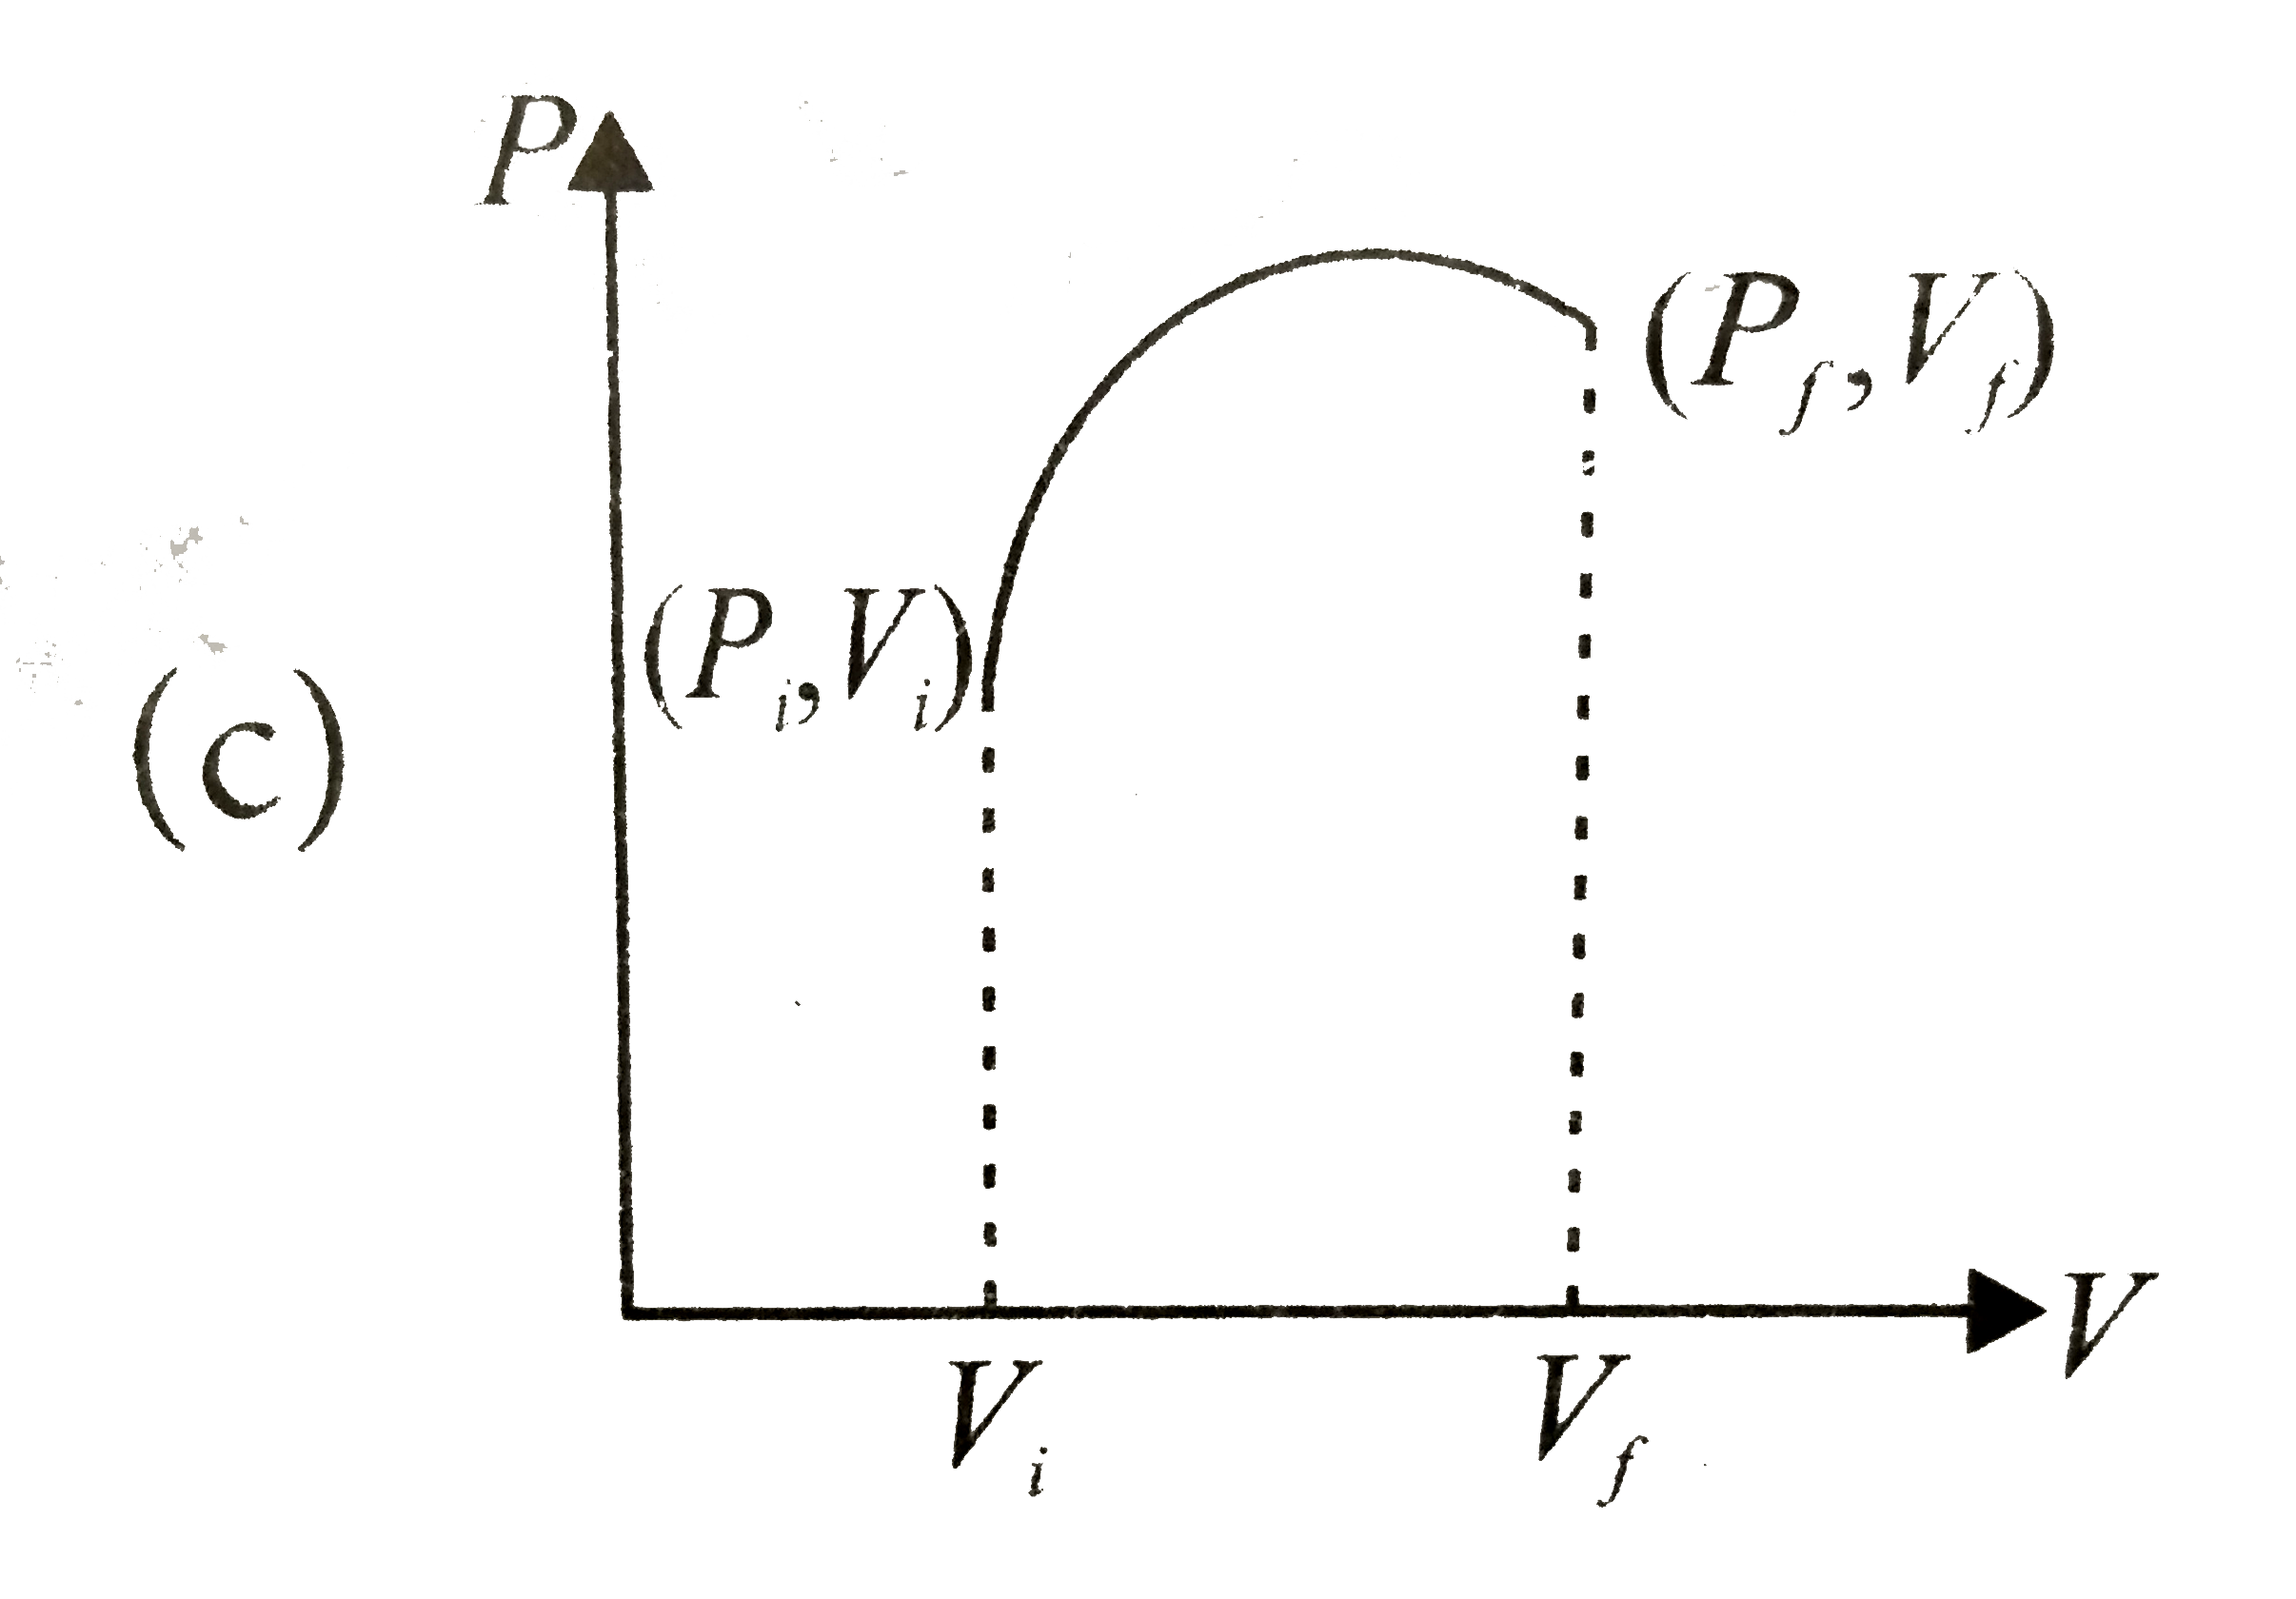 D
D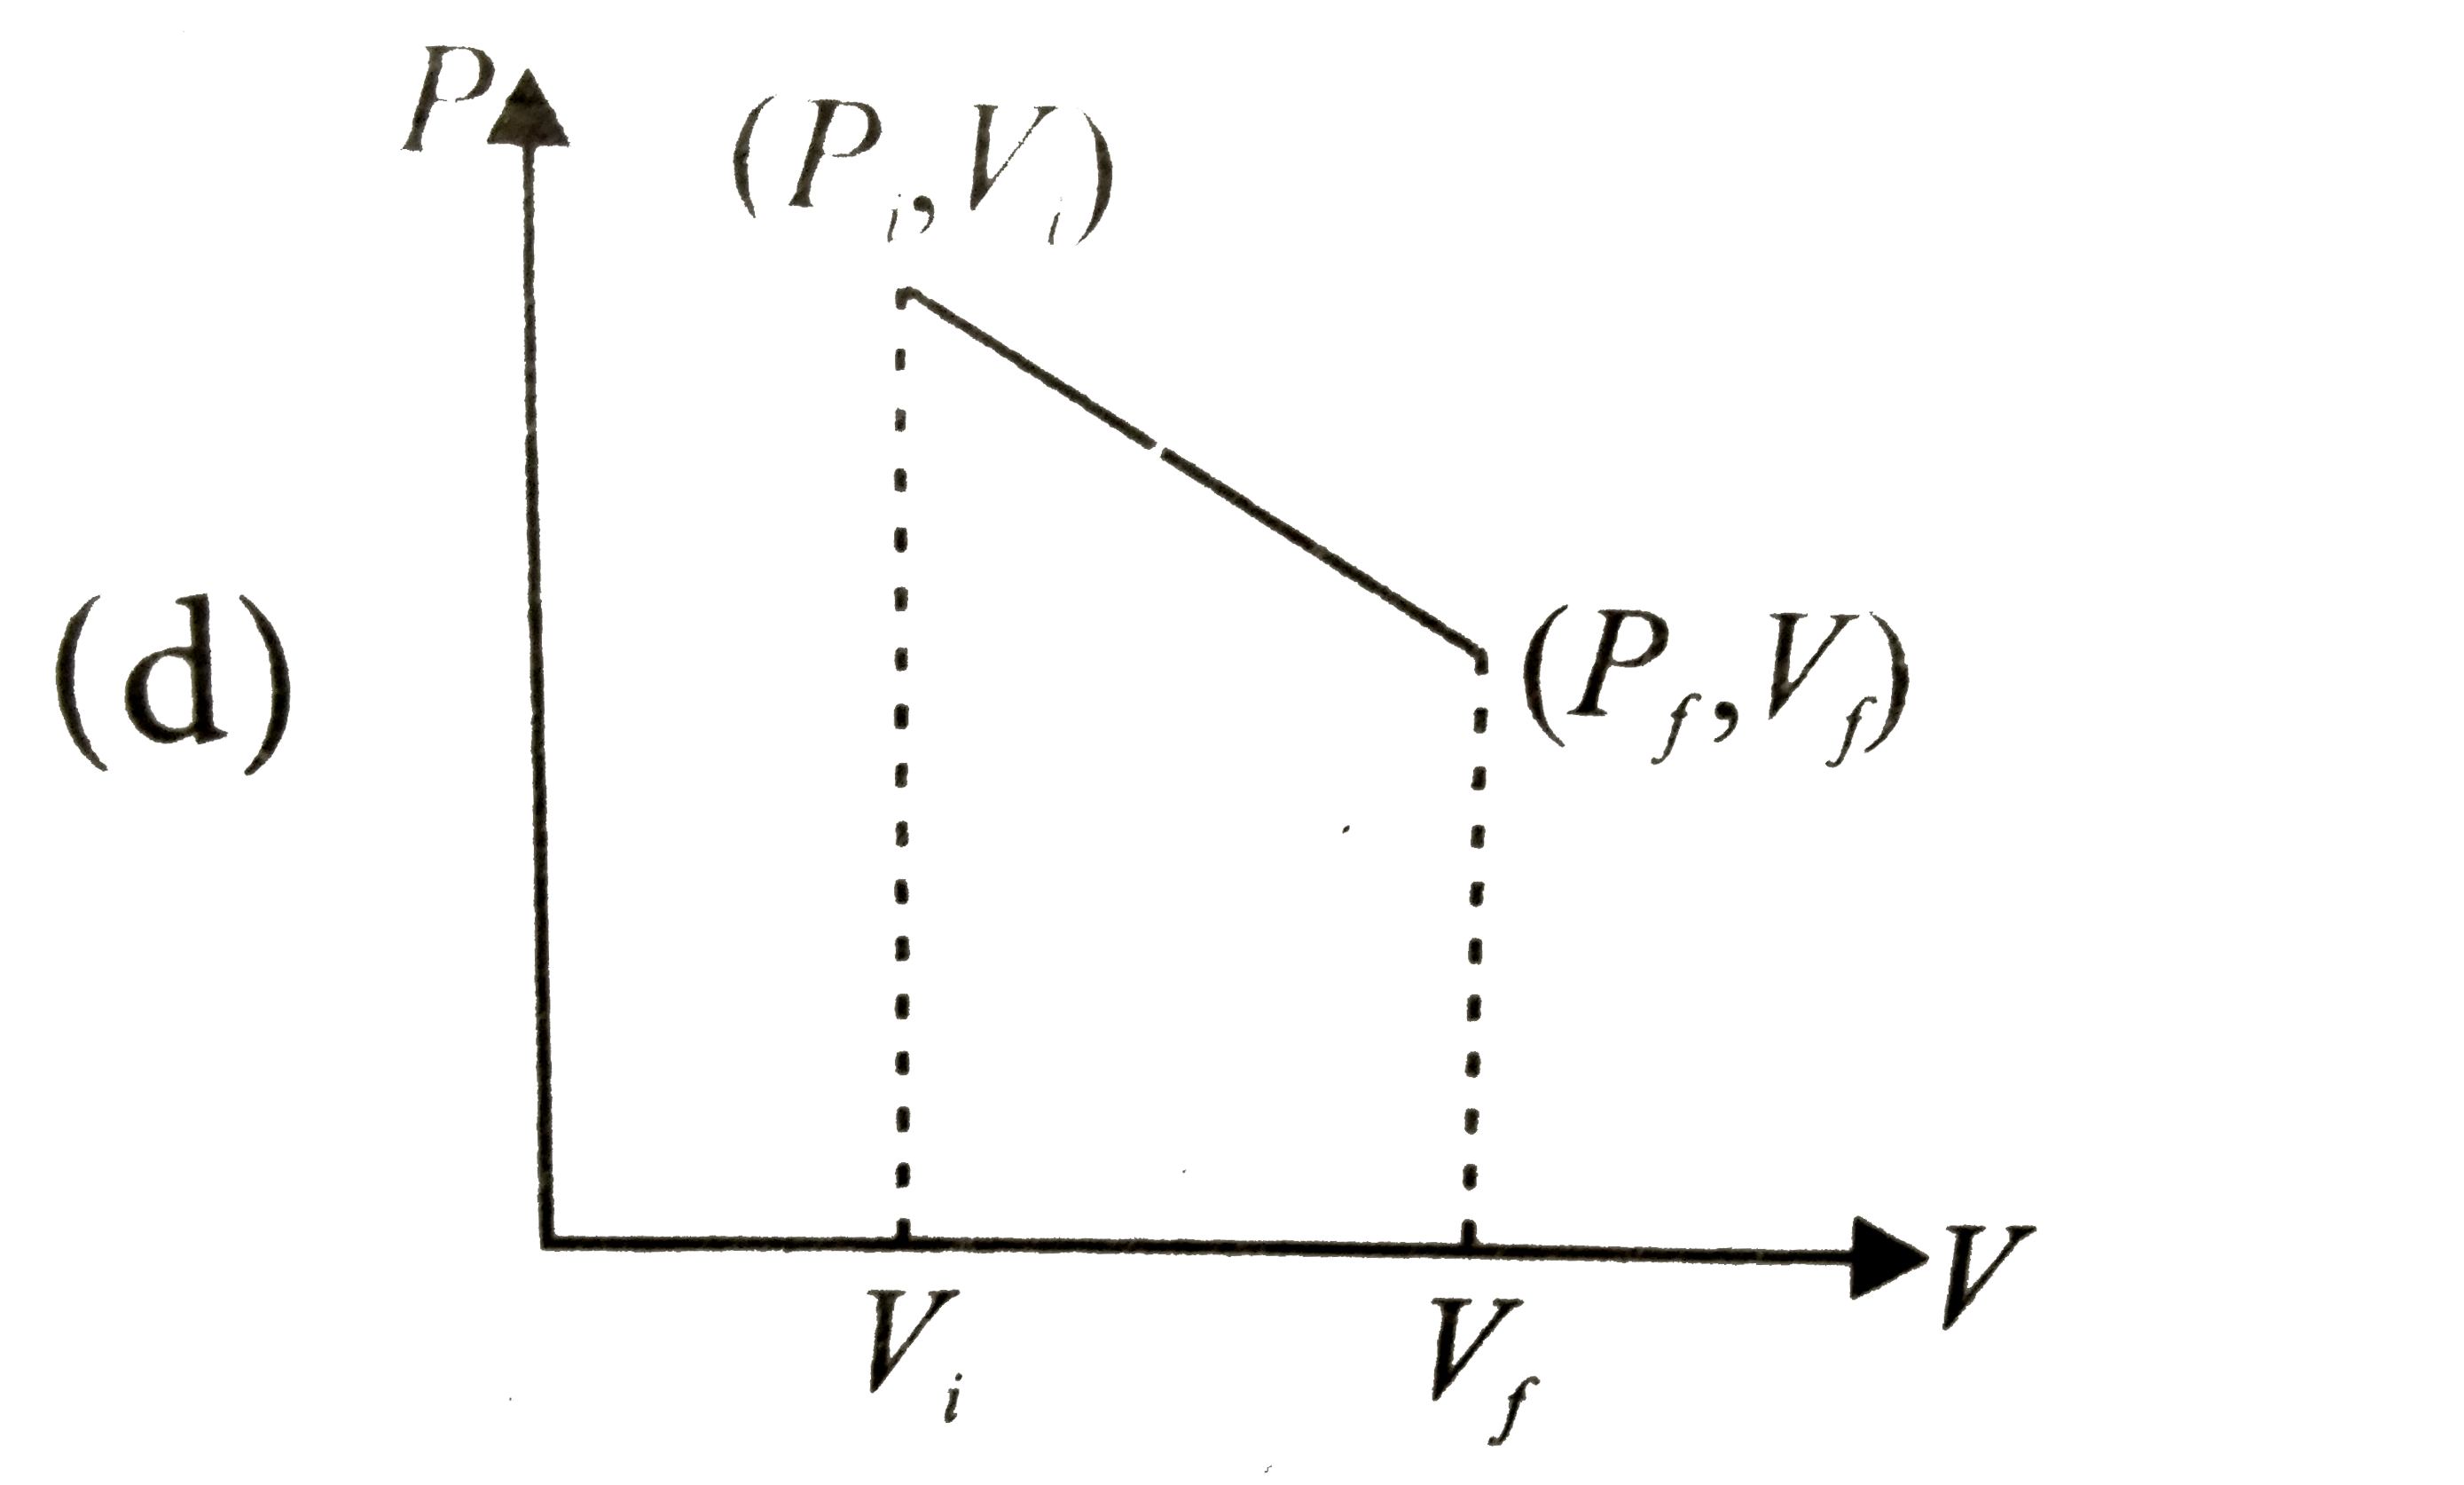
- Question 3 - Select One
The work done, W, during an isothermal process in which the gas expands from an intial volume V1, to a final volume V2 is given by (R : gas constant, T : temperature )
AR(V2−V1)logeT1T2BR(T2−T1)loge(V1V2)CRTloge[V2V1]D2RTloge[V1V2]
One mole of an ideal gas is taken from state A to state B by three different processes (a) ACB, (b) ADB and (c ) AEB as shown in the P−V diagram. The heat absorbed by the gas is
 View Solution
The equation of a state of a gas is given by p(V−b)=nRT. If 1 mole of a gas is isothermally expanded from volume V and 2V, the work done during the process is
View SolutionWhen a sample of ideal gas is changed from an initial state to a final state, various curves can be plotted for the process like P-V curve, V-T curve,P-T curve etc.
For example, P-V curve for a fixed amount of an ideal gas at constant temperature is a rectangular hyperbola, V-T curve for a fixed amount of an ideal gas at constant volume is again a straight line. However, the shapes may vary if the constant parameters are also changed.
Now, answer the following questions :
Which of the following graphs is not possible for a fixed amount of ideal gas upon moving from initial state A to final state B :View SolutionWhen a sample of ideal gas is changed from an initial state to a final state, various curves can be plotted for the process like P-V curve, V-T curve,P-T curve etc.
For example, P-V curve for a fixed amount of an ideal gas at constant temperature is a rectangular hyperbola, V-T curve for a fixed amount of an ideal gas at constant volume is again a straight line. However, the shapes may vary if the constant parameters are also changed.
Now, answer the following questions :
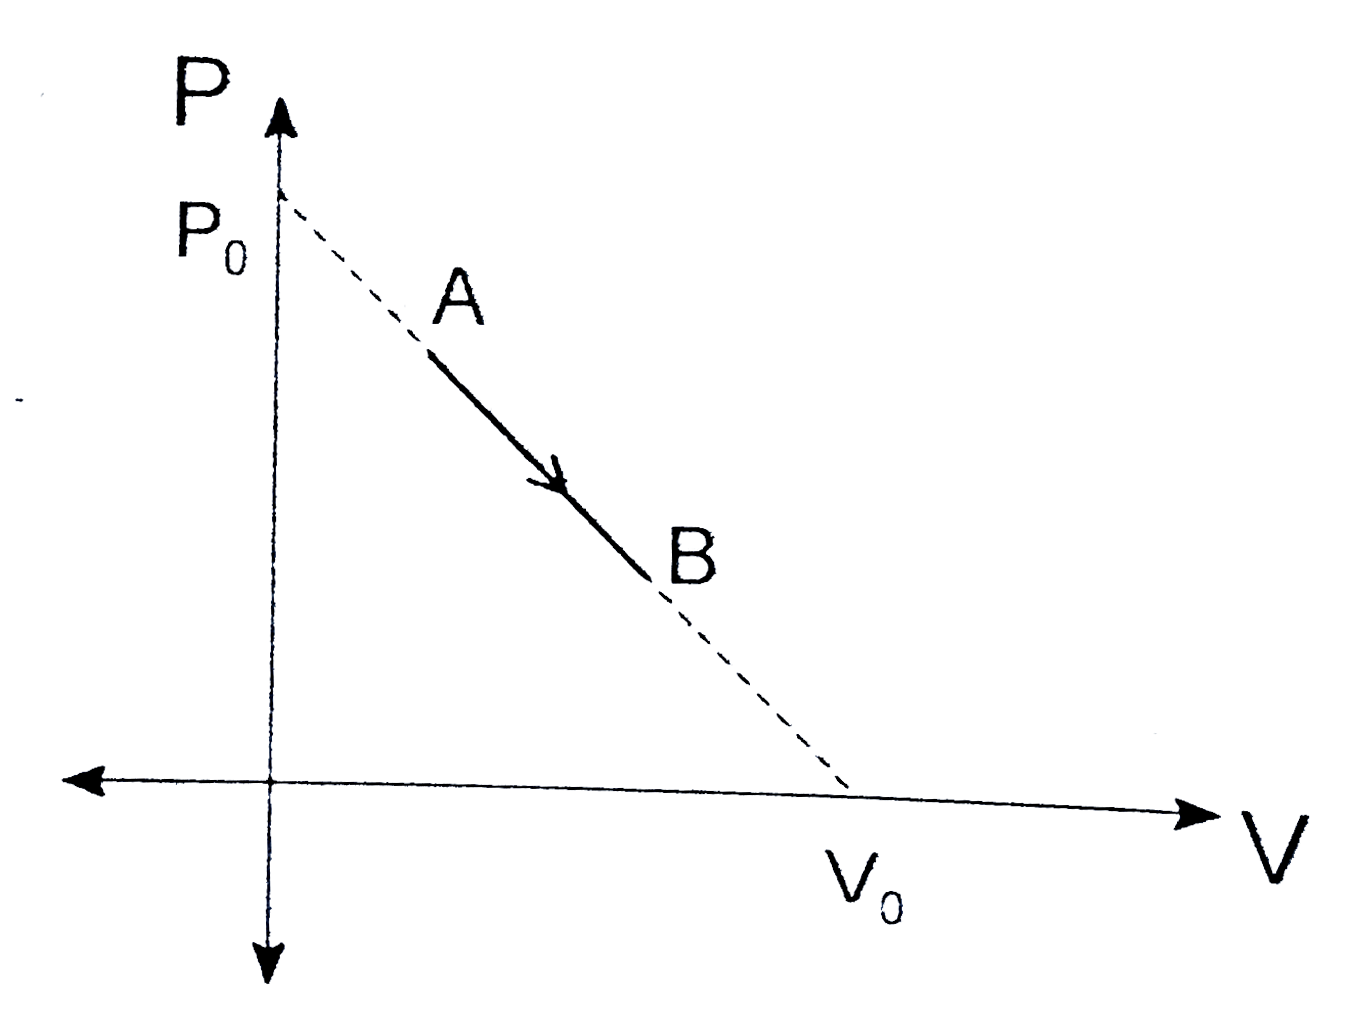
Two moles of an ideal gas is changed from its initial state (16 atm, 6L) to final state (4 atm, 15L) in such a way that this change can be represented by a straight line in P-V curve.The maximum temperature attained by the gas during the above change is :(Take : R=112LatmK−1mol−1)View SolutionOne mole of a monoatomic gas undergoes a linear process A→B in P−v diagram. The volume of the gas when the process turns from an endothermic to an exothermic one is
 View Solution
