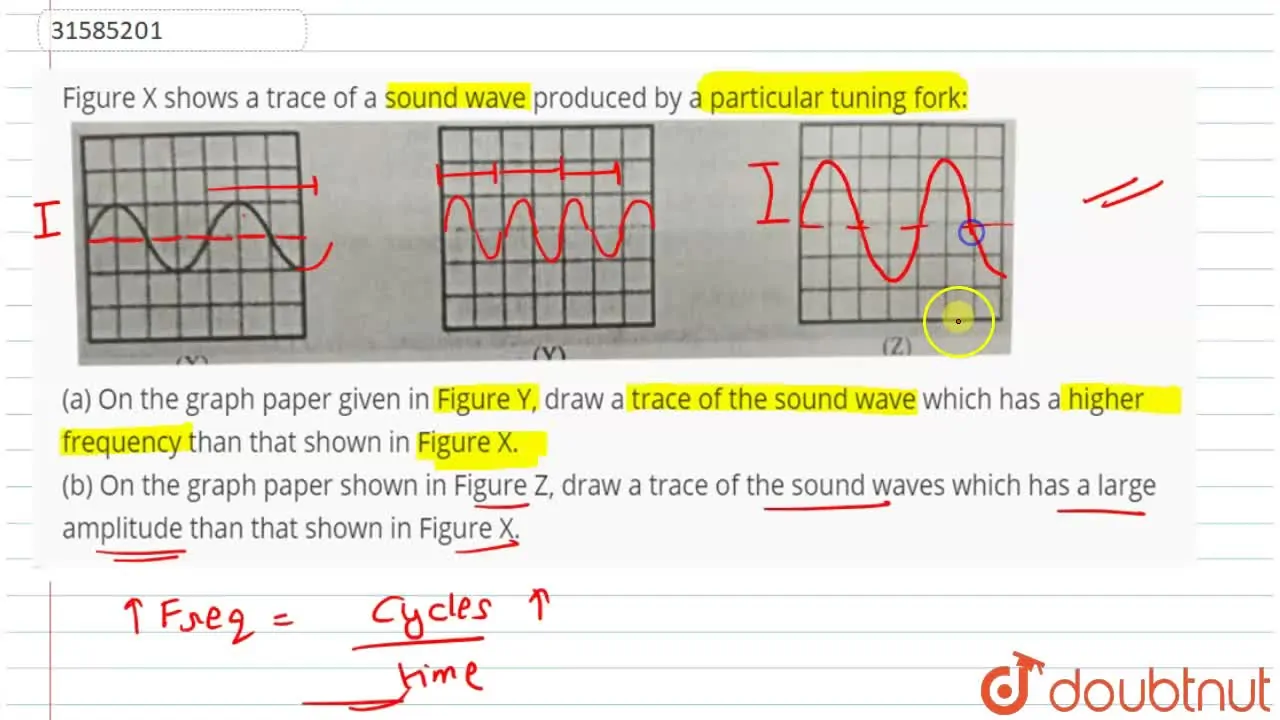
Figure X shows a trace of a sound wave produced by a particular tuning fork:

(a) On the graph paper given in Figure Y, draw a trace of the sound wave which has a higher frequency than that shown in Figure X.
(b) On the graph paper shown in Figure Z, draw a trace of the sound waves which has a large amplitude than that shown in Figure X.
The correct Answer is:(##NCERTPHYIXC05E01173_A01##)
Step by step video, text & image solution for Figure X shows a trace of a sound wave produced by a particular tuning fork: (a) On the graph paper given in Figure Y, draw a trace of the sound wave which has a higher frequency than that shown in Figure X. (b) On the graph paper shown in Figure Z, draw a trace of the sound waves which has a large amplitude than that shown in Figure X. by Physics experts to help you in doubts & scoring excellent marks in Class 9 exams.
Related Playlists
- BOOK - LAKHMIR SINGH & MANJIT KAURCHAPTER - SOUNDEXERCISE - Multiple Choice Questions37videos
SOUND
- BOOK - LAKHMIR SINGH & MANJIT KAURCHAPTER - SOUNDEXERCISE - NCERT5videos
SOUND
- BOOK - LAKHMIR SINGH & MANJIT KAURCHAPTER - SOUNDEXERCISE - Long Answer Type Questions13videos
SOUND
- BOOK - LAKHMIR SINGH & MANJIT KAURCHAPTER - MOTION EXERCISE - NCERT BOOK QUESTIONS AND EXERCISES3videos
MOTION
- BOOK - LAKHMIR SINGH & MANJIT KAURCHAPTER - WORK AND ENERGYEXERCISE - Multiple Choice Questions1videos
WORK AND ENERGY
Similar Questions
An ultrasonic sound wave has a frequency higher than:
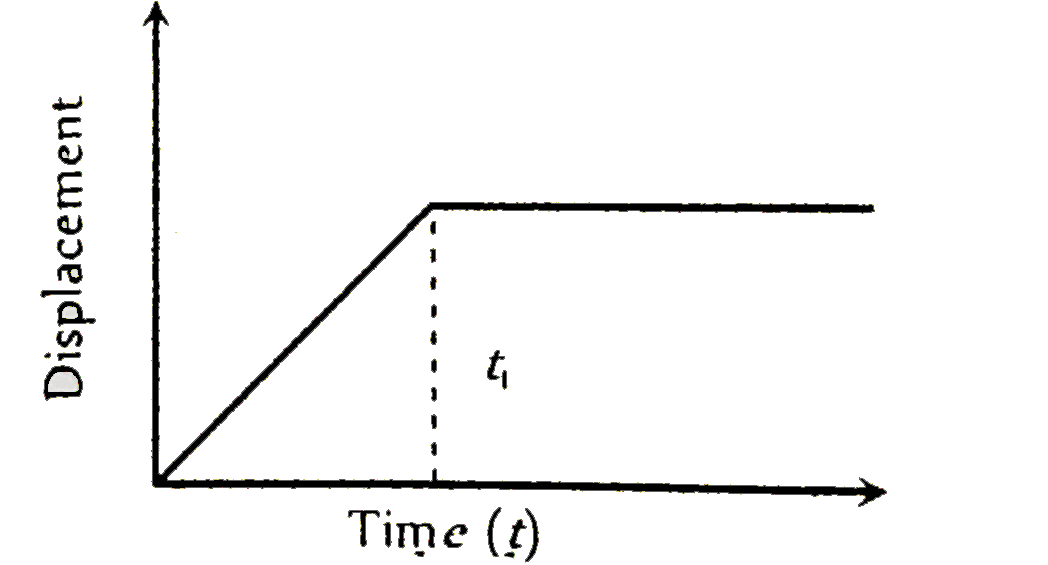
View SolutionThe x -t graph shown in figure represents
 View Solution
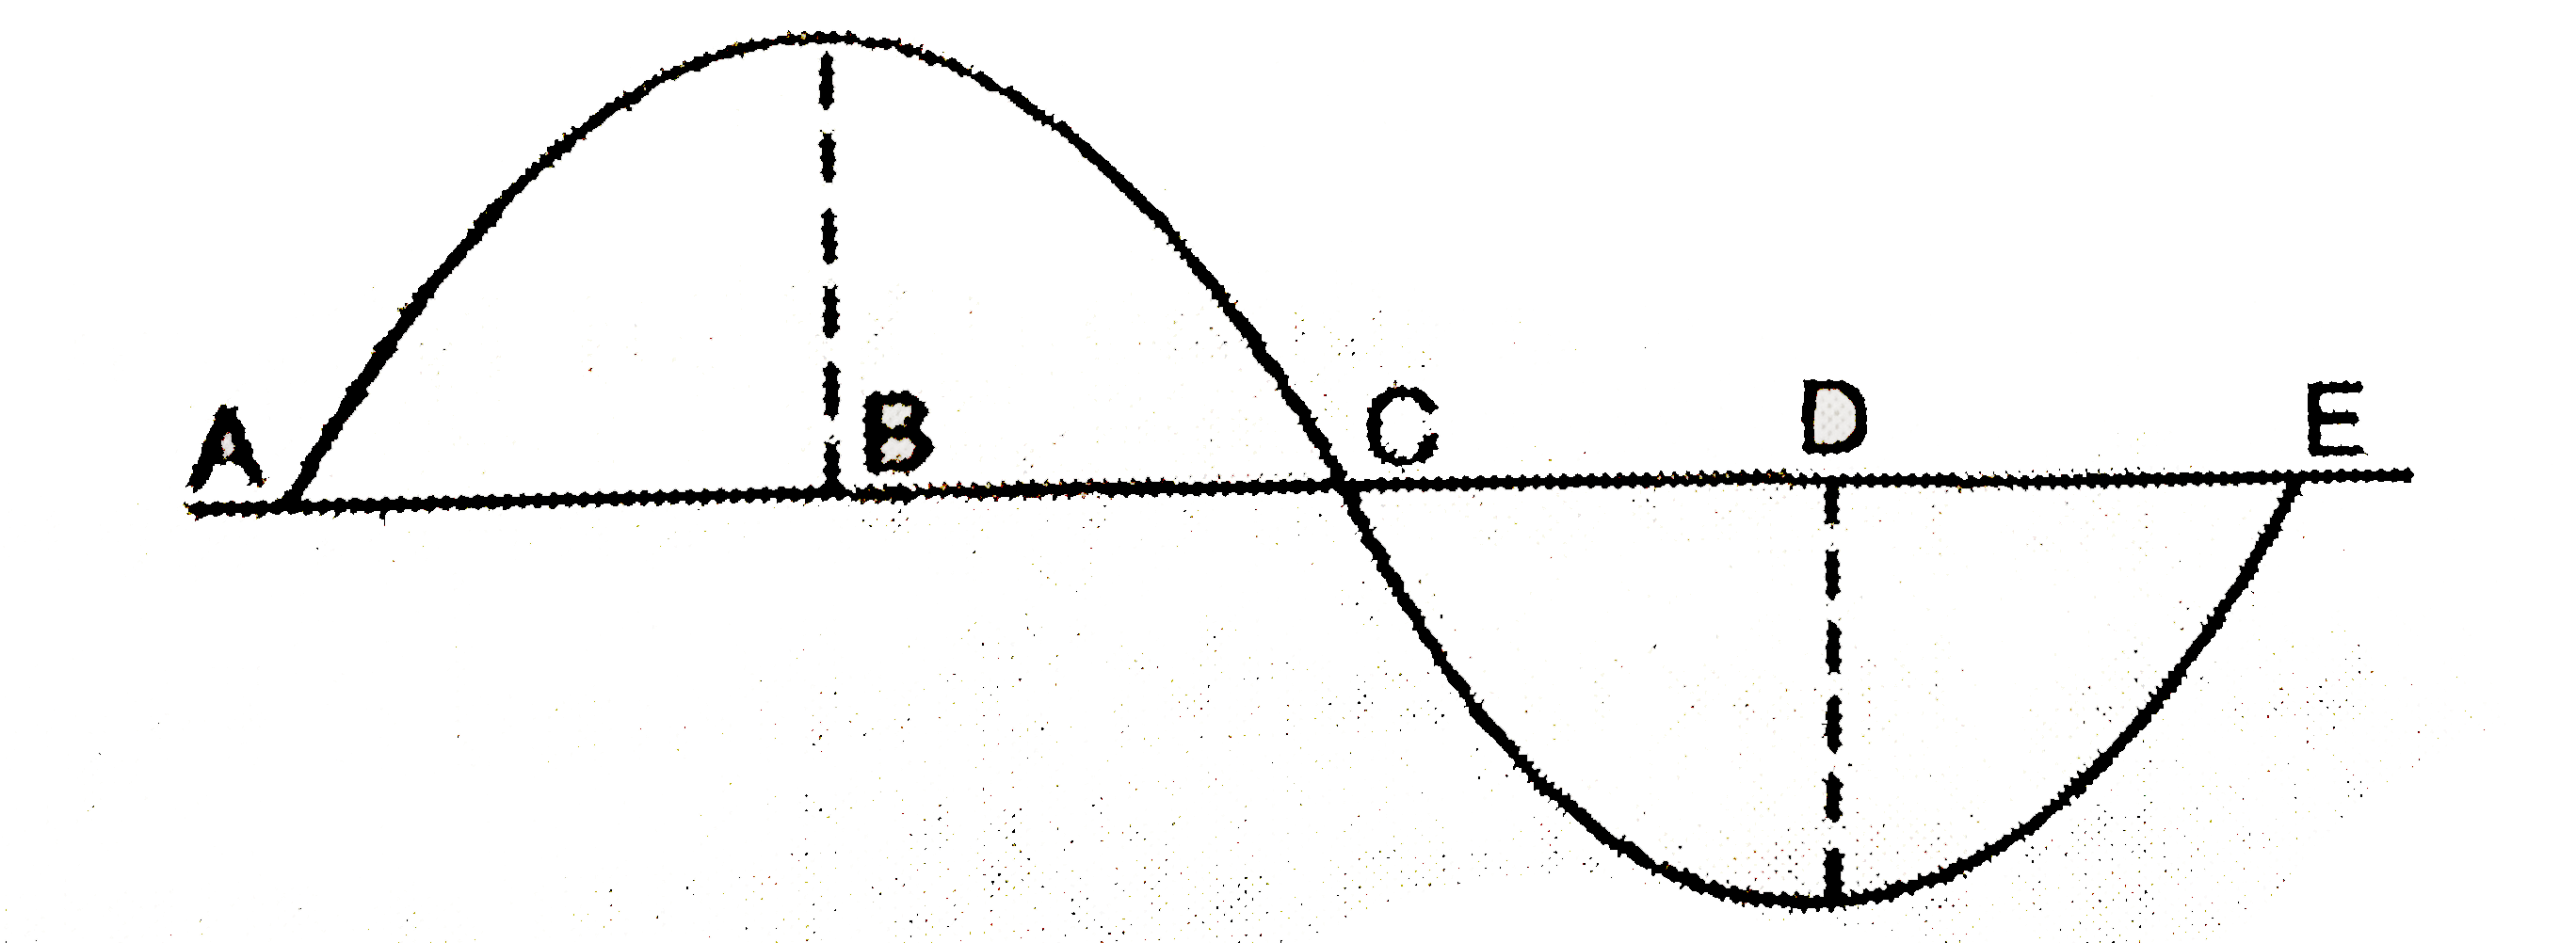
In the sound wave produced by a vibrating turning fork shown in the diagram, half the wavelength is represented by:
 View Solution
The oscilloscope traces for sound waves with different frequencies are shown here. The noises shown in the diagram in the increasing order of frequency are a
 View Solution
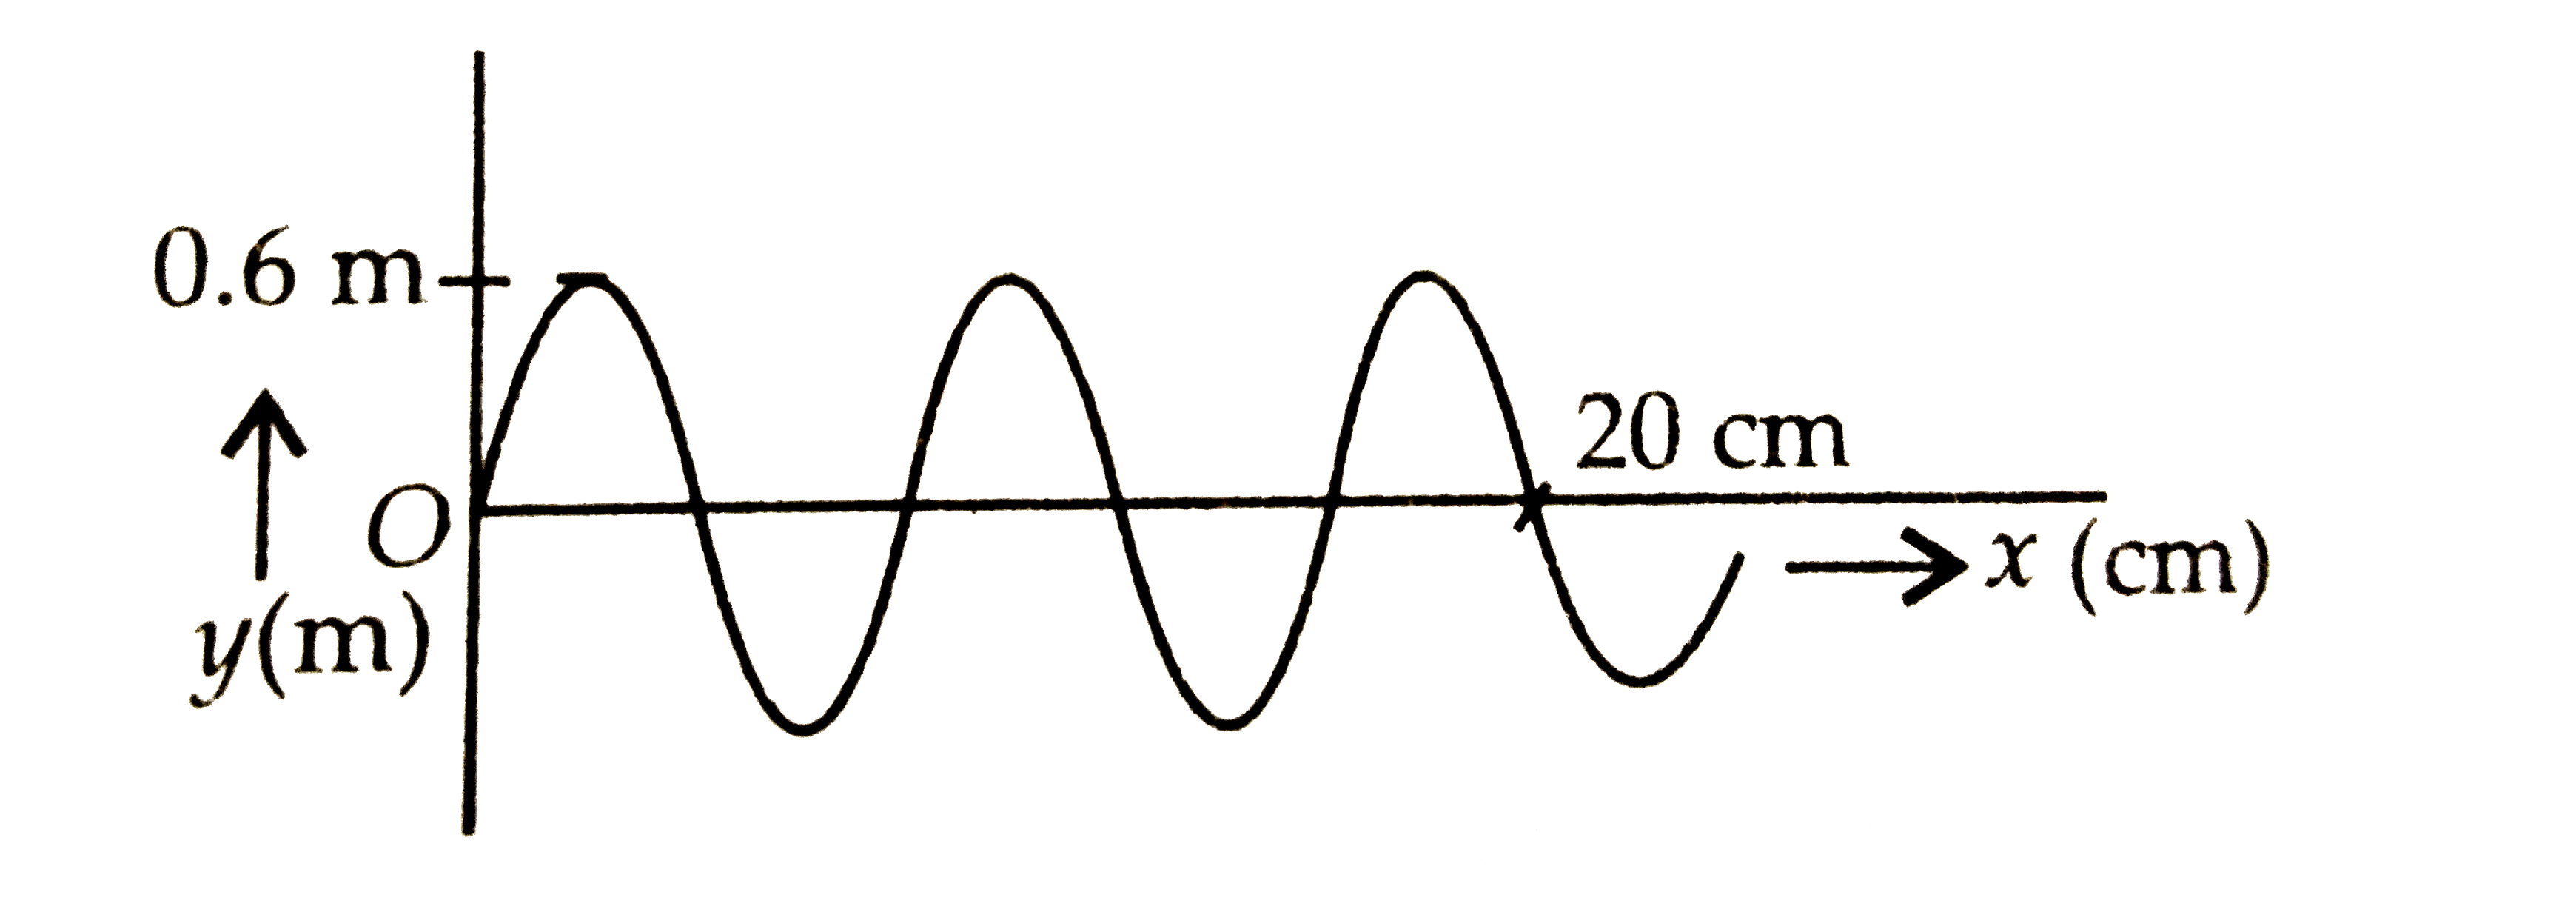
What is the wavelength of wave shown in given figure ?
 View Solution
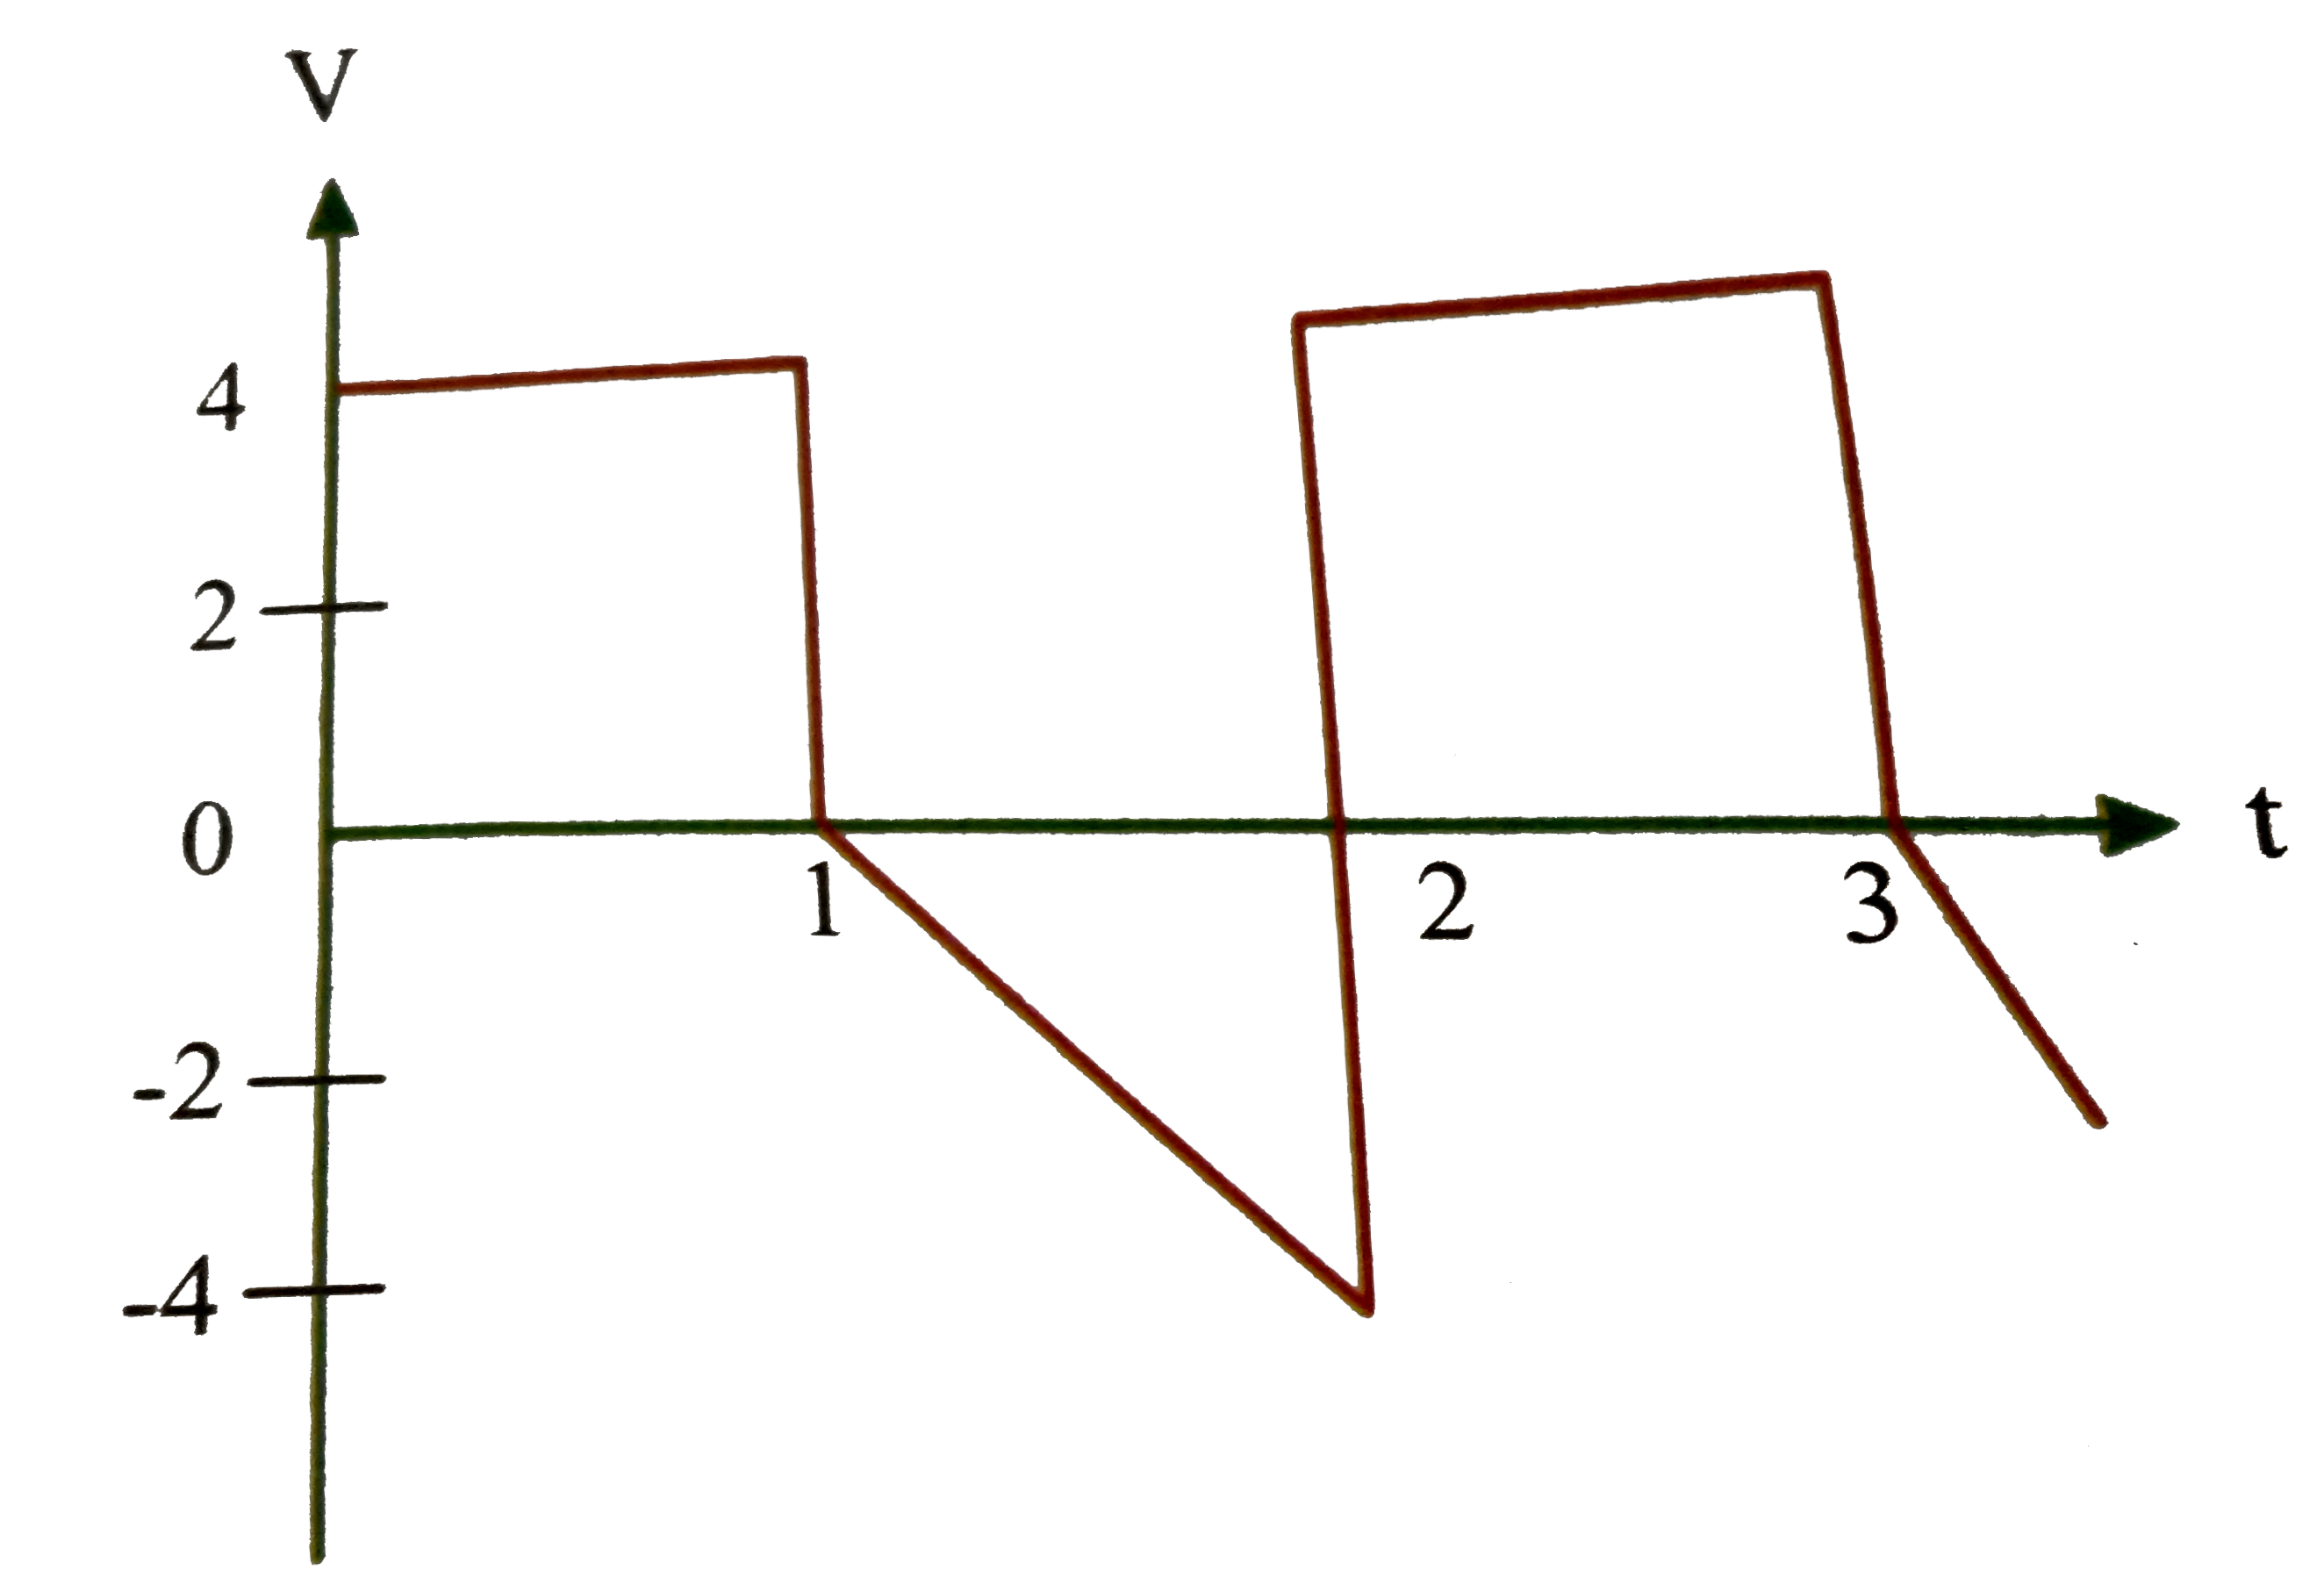
The rms and the average value of the voltage wave shown in figure are
 View Solution
What is the wavelength of wave shown in given figure?
 View Solution
Name one phenomenon that is shown by light waves, but not by sound waves.
View SolutionWhich of the following sound waves produces the loudest sound?
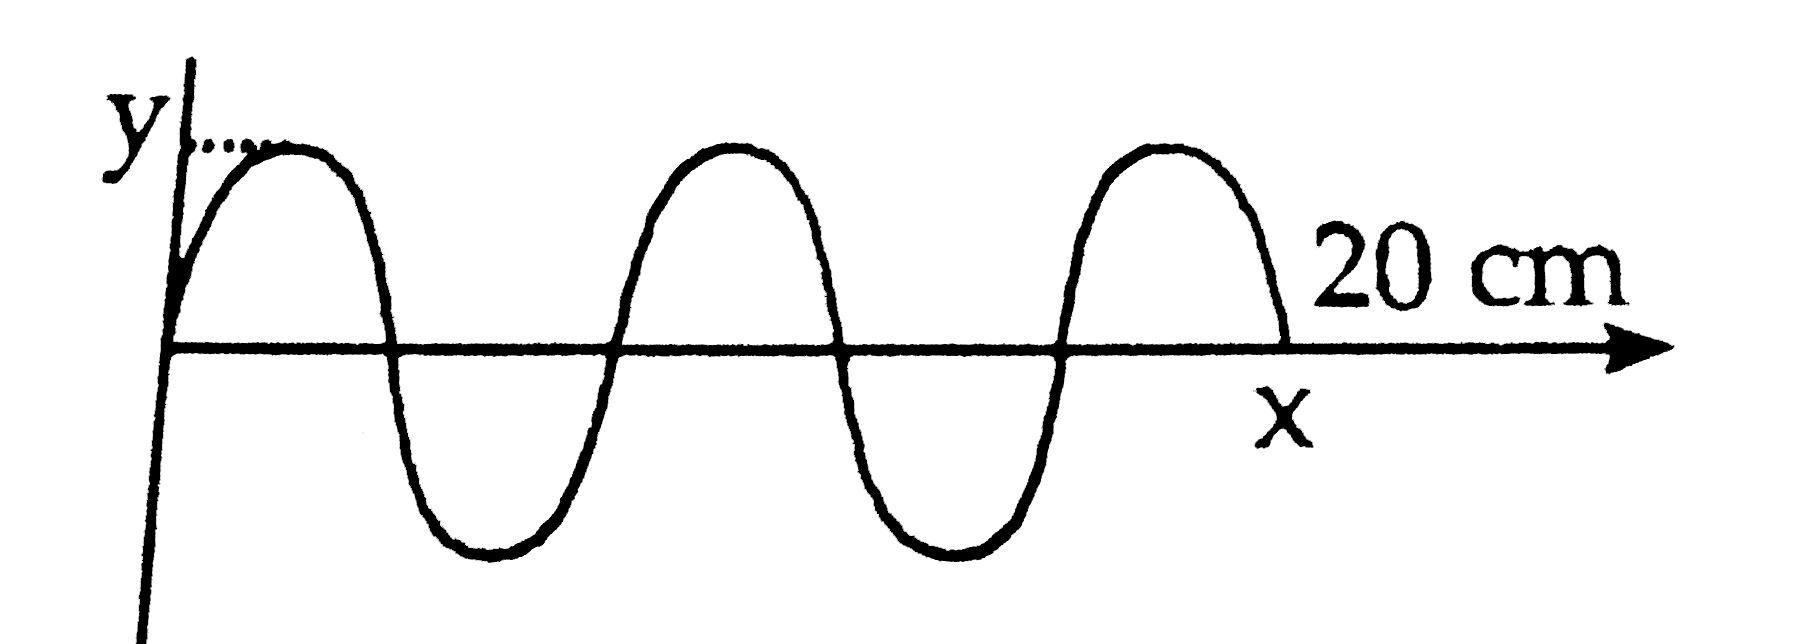
View SolutionFor the wave shown in the figure, the frequency and wavelength if its speed is 320 m/s are
 View Solution

