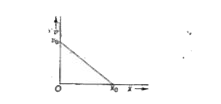
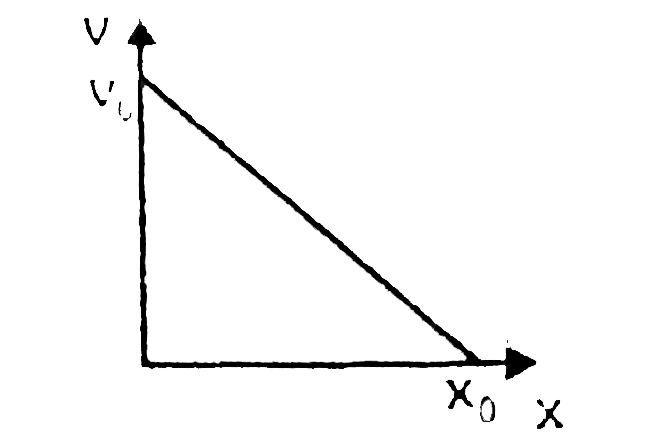
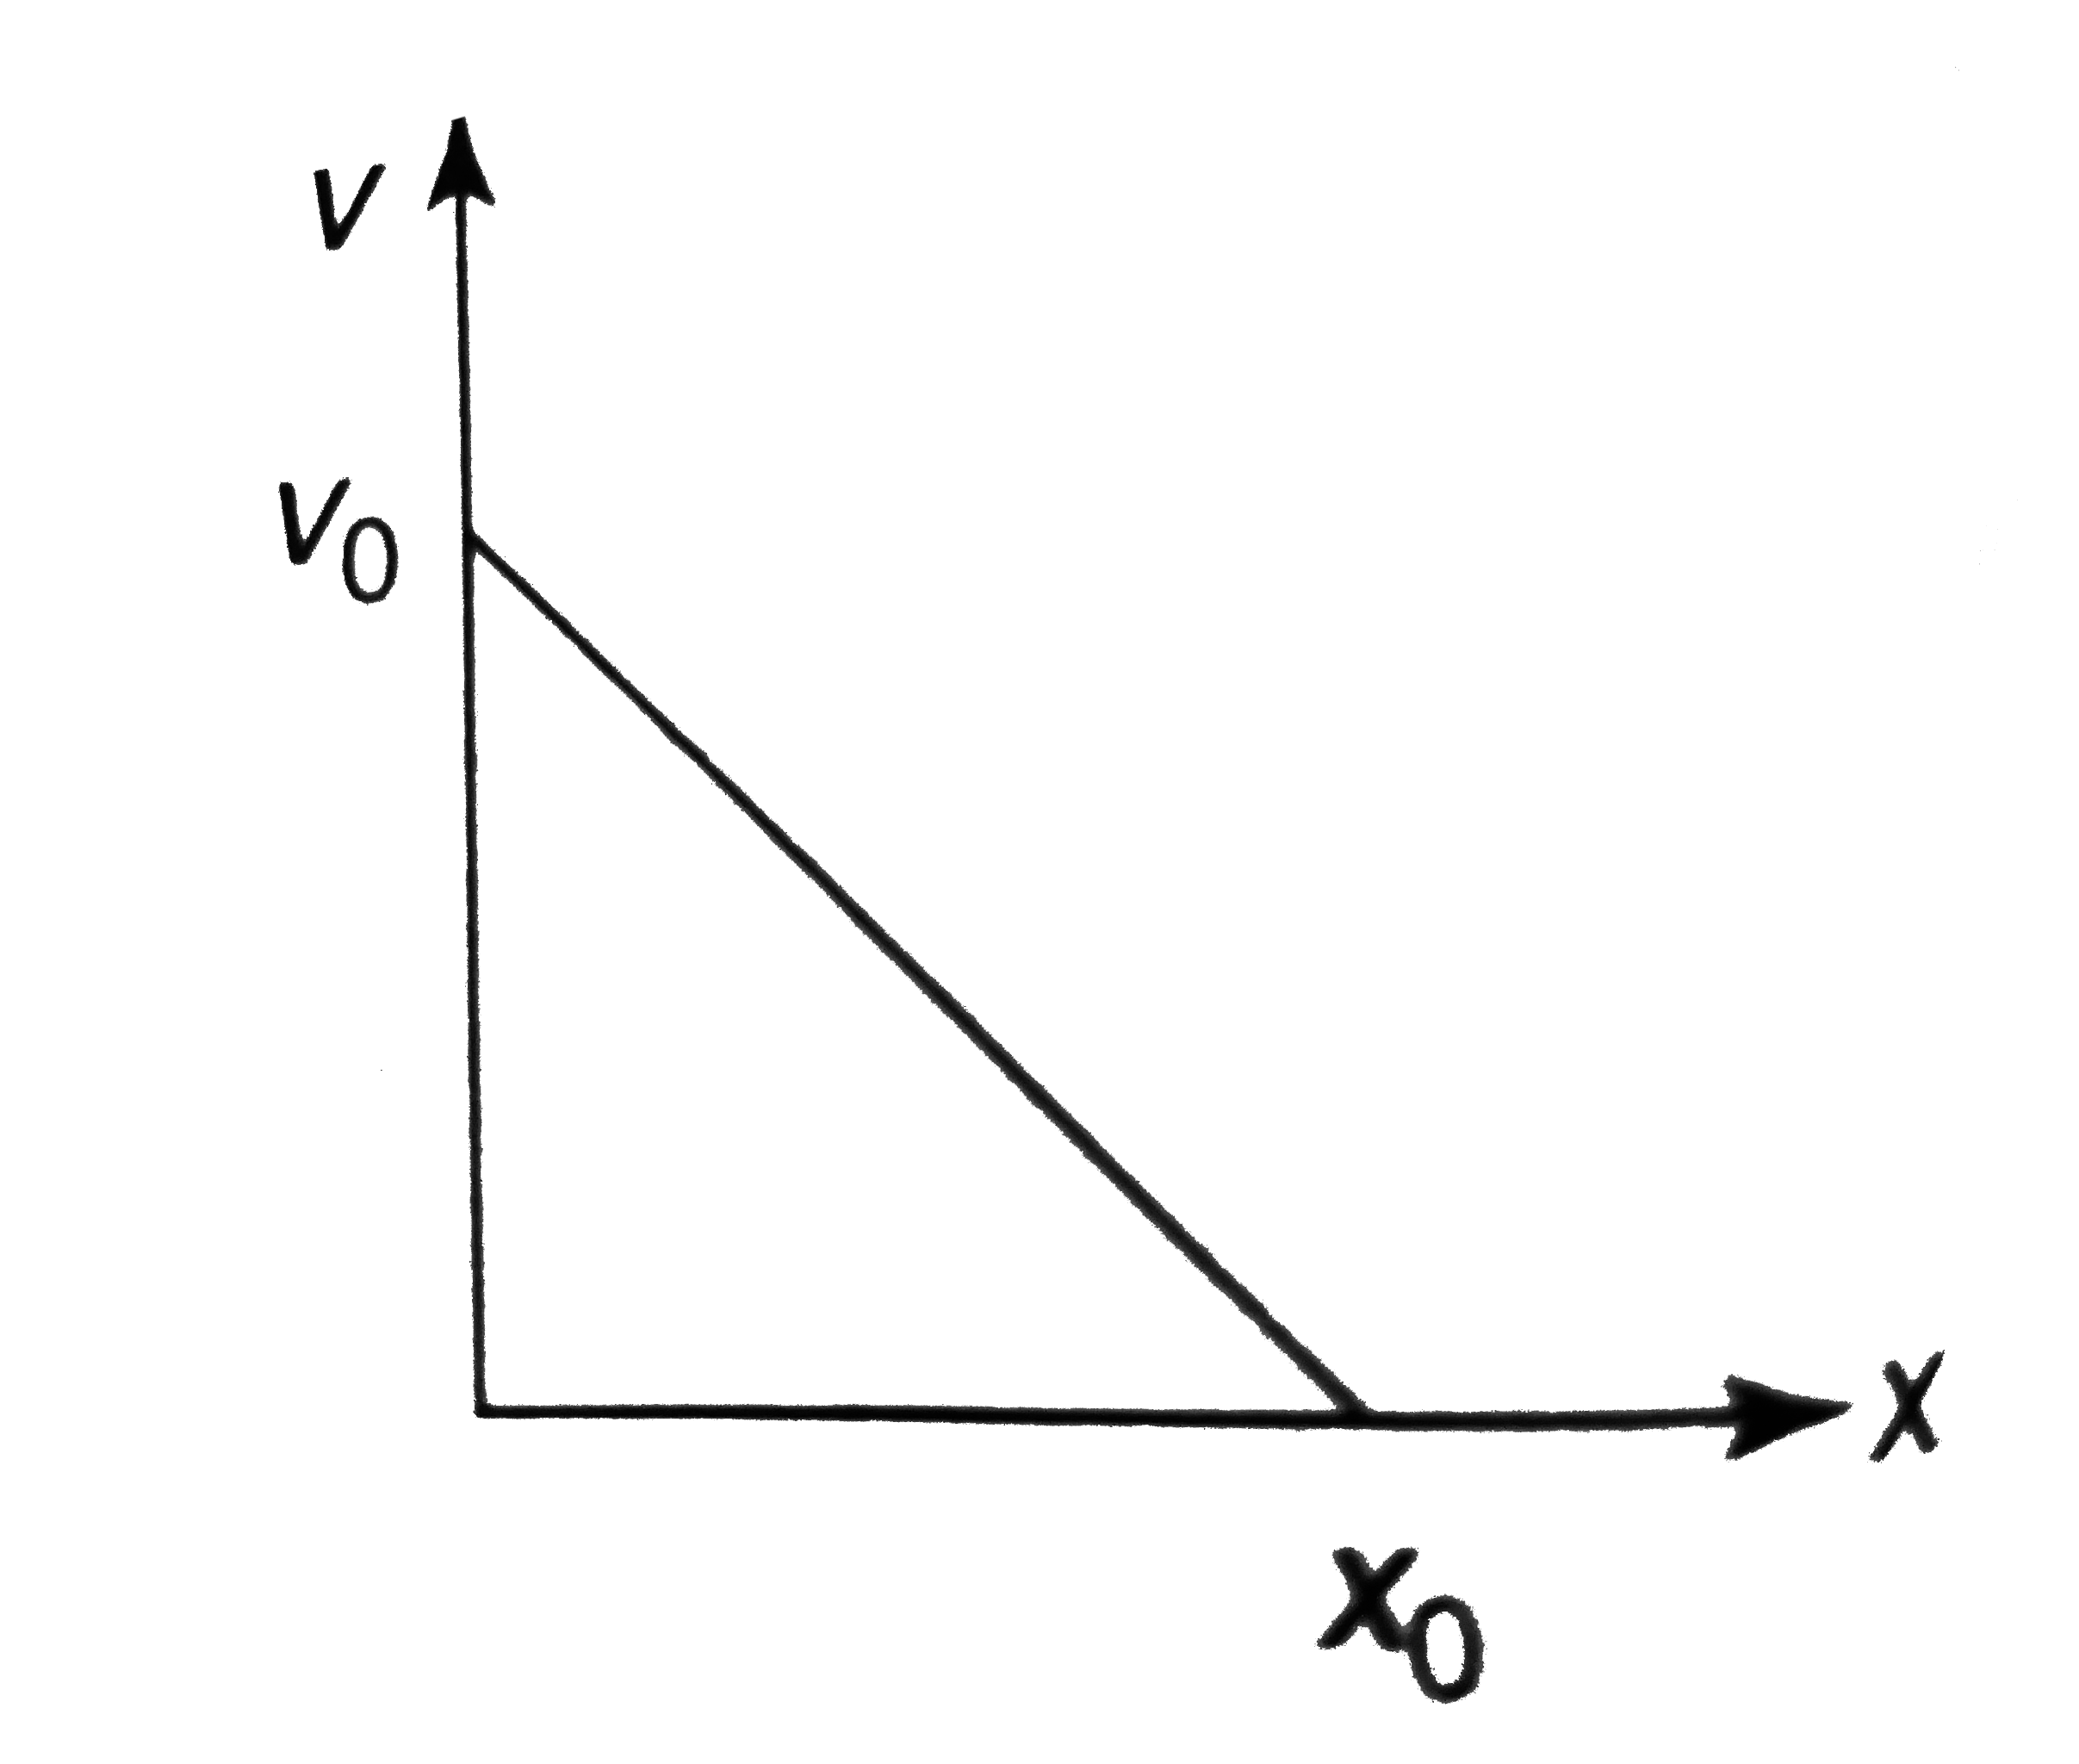
Figure shows the variation of velocity (v) of a body with position(x) from the origin O.Which of the graphs shown in fig correctly represents the variation of the acceleration (a) with position (x) ?
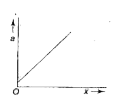

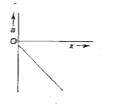

The correct Answer is:D
The slope of the given v versus x graphs is m=−v0x0 and intercept is c=+v0. Hence v varies with x as
v=−(v0x0)x+v0 …….1
Where v0 and x0 are constants of motion. Differentiating with respect to time t, we have
dvdt=−(v0x0)dxdt ora=−(v0x0)v ........2
Using Eq 1 in Eq. 2 we get a=(−(v0x0)(−v0x0x+v0) or a=(v0x0)2x−v20x0
Thus the graph of a versus x is a straight line having a positive slope =(v0x0)2 and negative intercept
=v20x0
Similar Questions
Which of the following graphs correctly represents the variation of g on the - Earth?
View SolutionThe given graph shows the variation of velocity with displacement. Which one of the graph given below correctly represents the variation of acceleration with displacement :-
 View Solution
The given graph shows the variation of velocity with displacement. Which one of the graphs given below correctly represents the variation of acceleration with displacement ?
 View Solution
The given graph shows the variation of velocity with displacement. Which one of the graphs given below correctly represents the variation of acceleration with displacement ?
 View Solution
Which of the following graphs best represents the variation of acceleration 'a' with displacement x?
View SolutionWhich of the following graphs best represents the variation of acceleration 'a' with displacement x?
View SolutionThe velocity -displacement graph of a particle is as shown in the figure. Which of the following graphs correctly represents the variation of acceleration with displacement?
 View Solution
The velocity -displacement graph of a particle is as shown in the figure. Which of the following graphs correctly represents the variation of acceleration with displacement?
 View Solution
The graph shown the variation with times t of the velocity v of an object . Which one of the following graphs best represents the variation of acceleration a of the object with time t?
 View Solution
The graph shown the variation with times t of the velocity v of an object . Which one of the following graphs best represents the variation of acceleration a of the object with time t?
 View Solution

