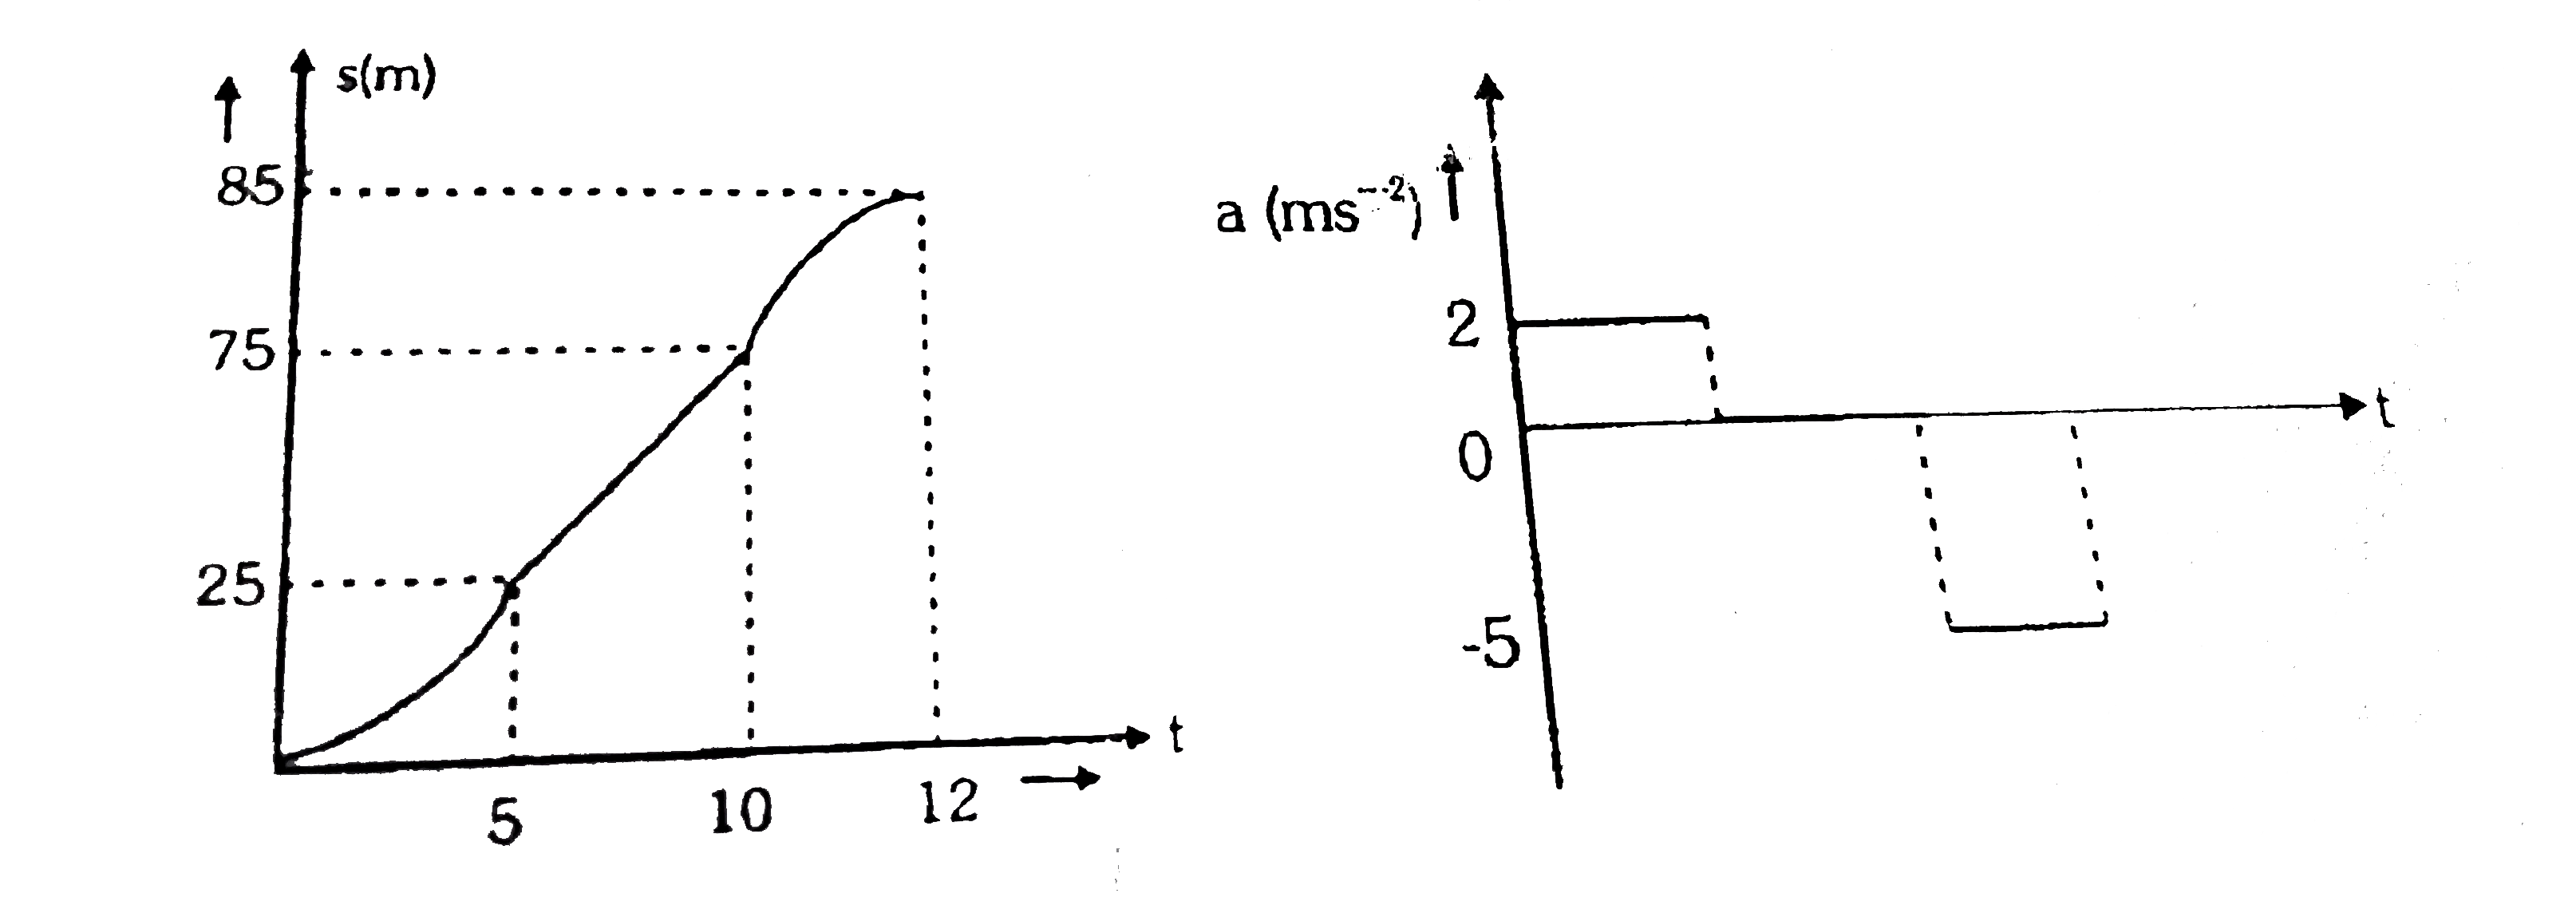
Draw displacement time and acceleration -time graph for the given velocity-time graph
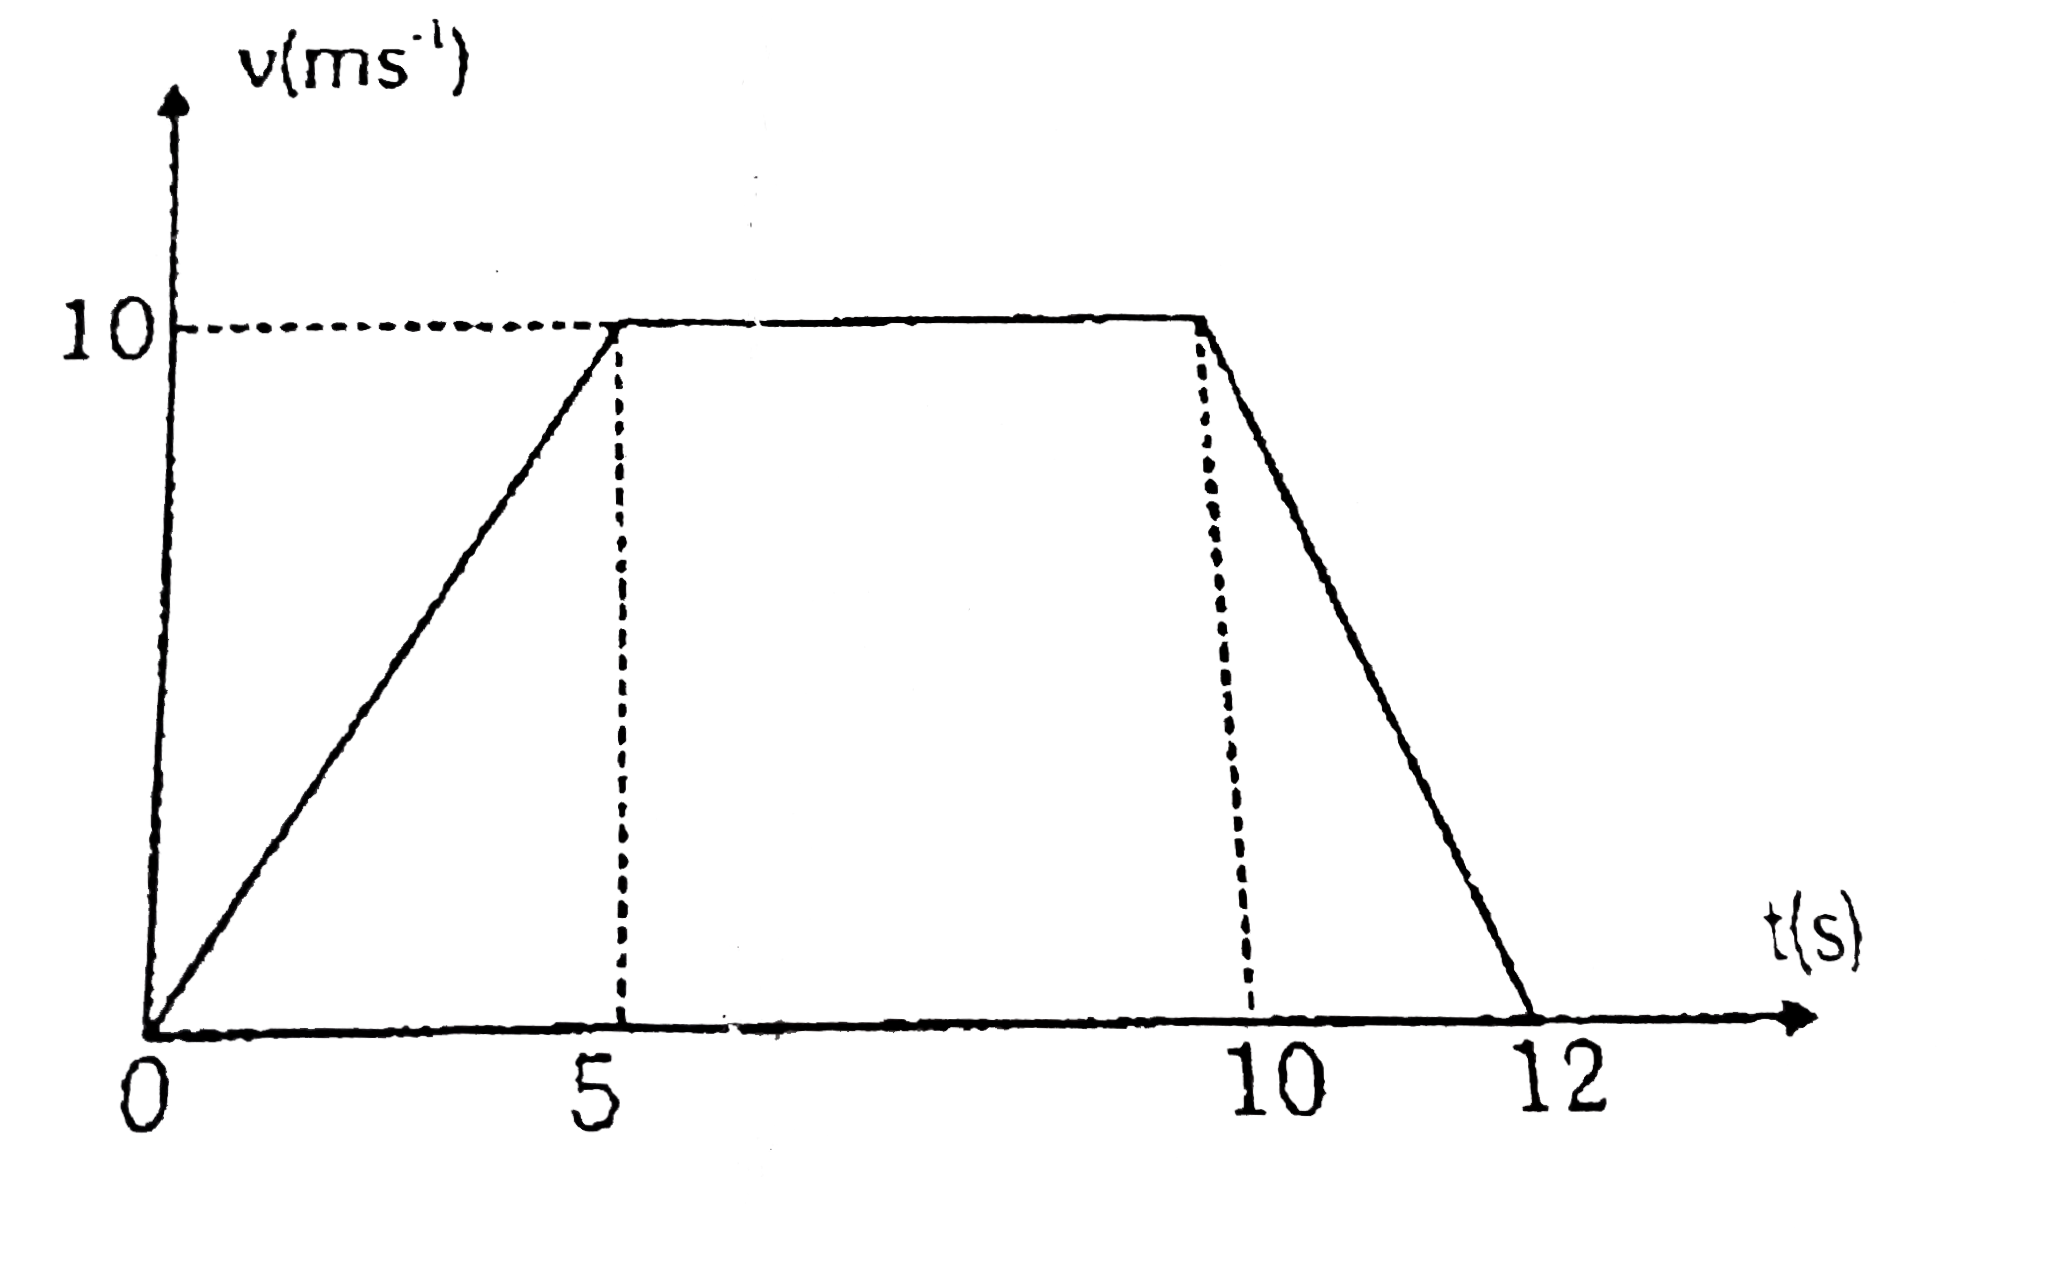
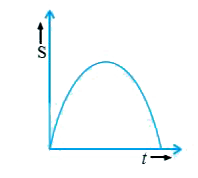
For 0≤t≤5v∝t⇒s∝t2 and a1= constant 105=2m/s2
for whole interval s1= Area under the curve =12×5×10=25m
For 5≤t≤10,v=10ms−1⇒a=0
for whole interval s2= area under the curve =5×10=50m
For 10≤t≤12 v linearly decreases decreases with time ⇒a3=−102=−5ms−2
for whole interval s3= Area under the curve =12×2×10=10m
Related Playlists
- BOOK - ALLENCHAPTER - KINEMATICSEXERCISE - EXERCISE-0155videos
KINEMATICS
- BOOK - ALLENCHAPTER - KINEMATICSEXERCISE - EXERCISE-0257videos
KINEMATICS
- BOOK - ALLENCHAPTER - ERROR AND MEASUREMENTEXERCISE - Part-2(Exercise-2)(B)22videos
ERROR AND MEASUREMENT
- BOOK - ALLENCHAPTER - KINEMATICS (MOTION ALONG A STRAIGHT LINE AND MOTION IN A PLANE)EXERCISE - BEGINNER S BOX-78videos
KINEMATICS (MOTION ALONG A STRAIGHT LINE AND MOTION IN A PLANE)
Similar Questions
Draw the acceleration-time graphs for the given velocity-time graphs of a particle moving along x-axis.
 View Solution
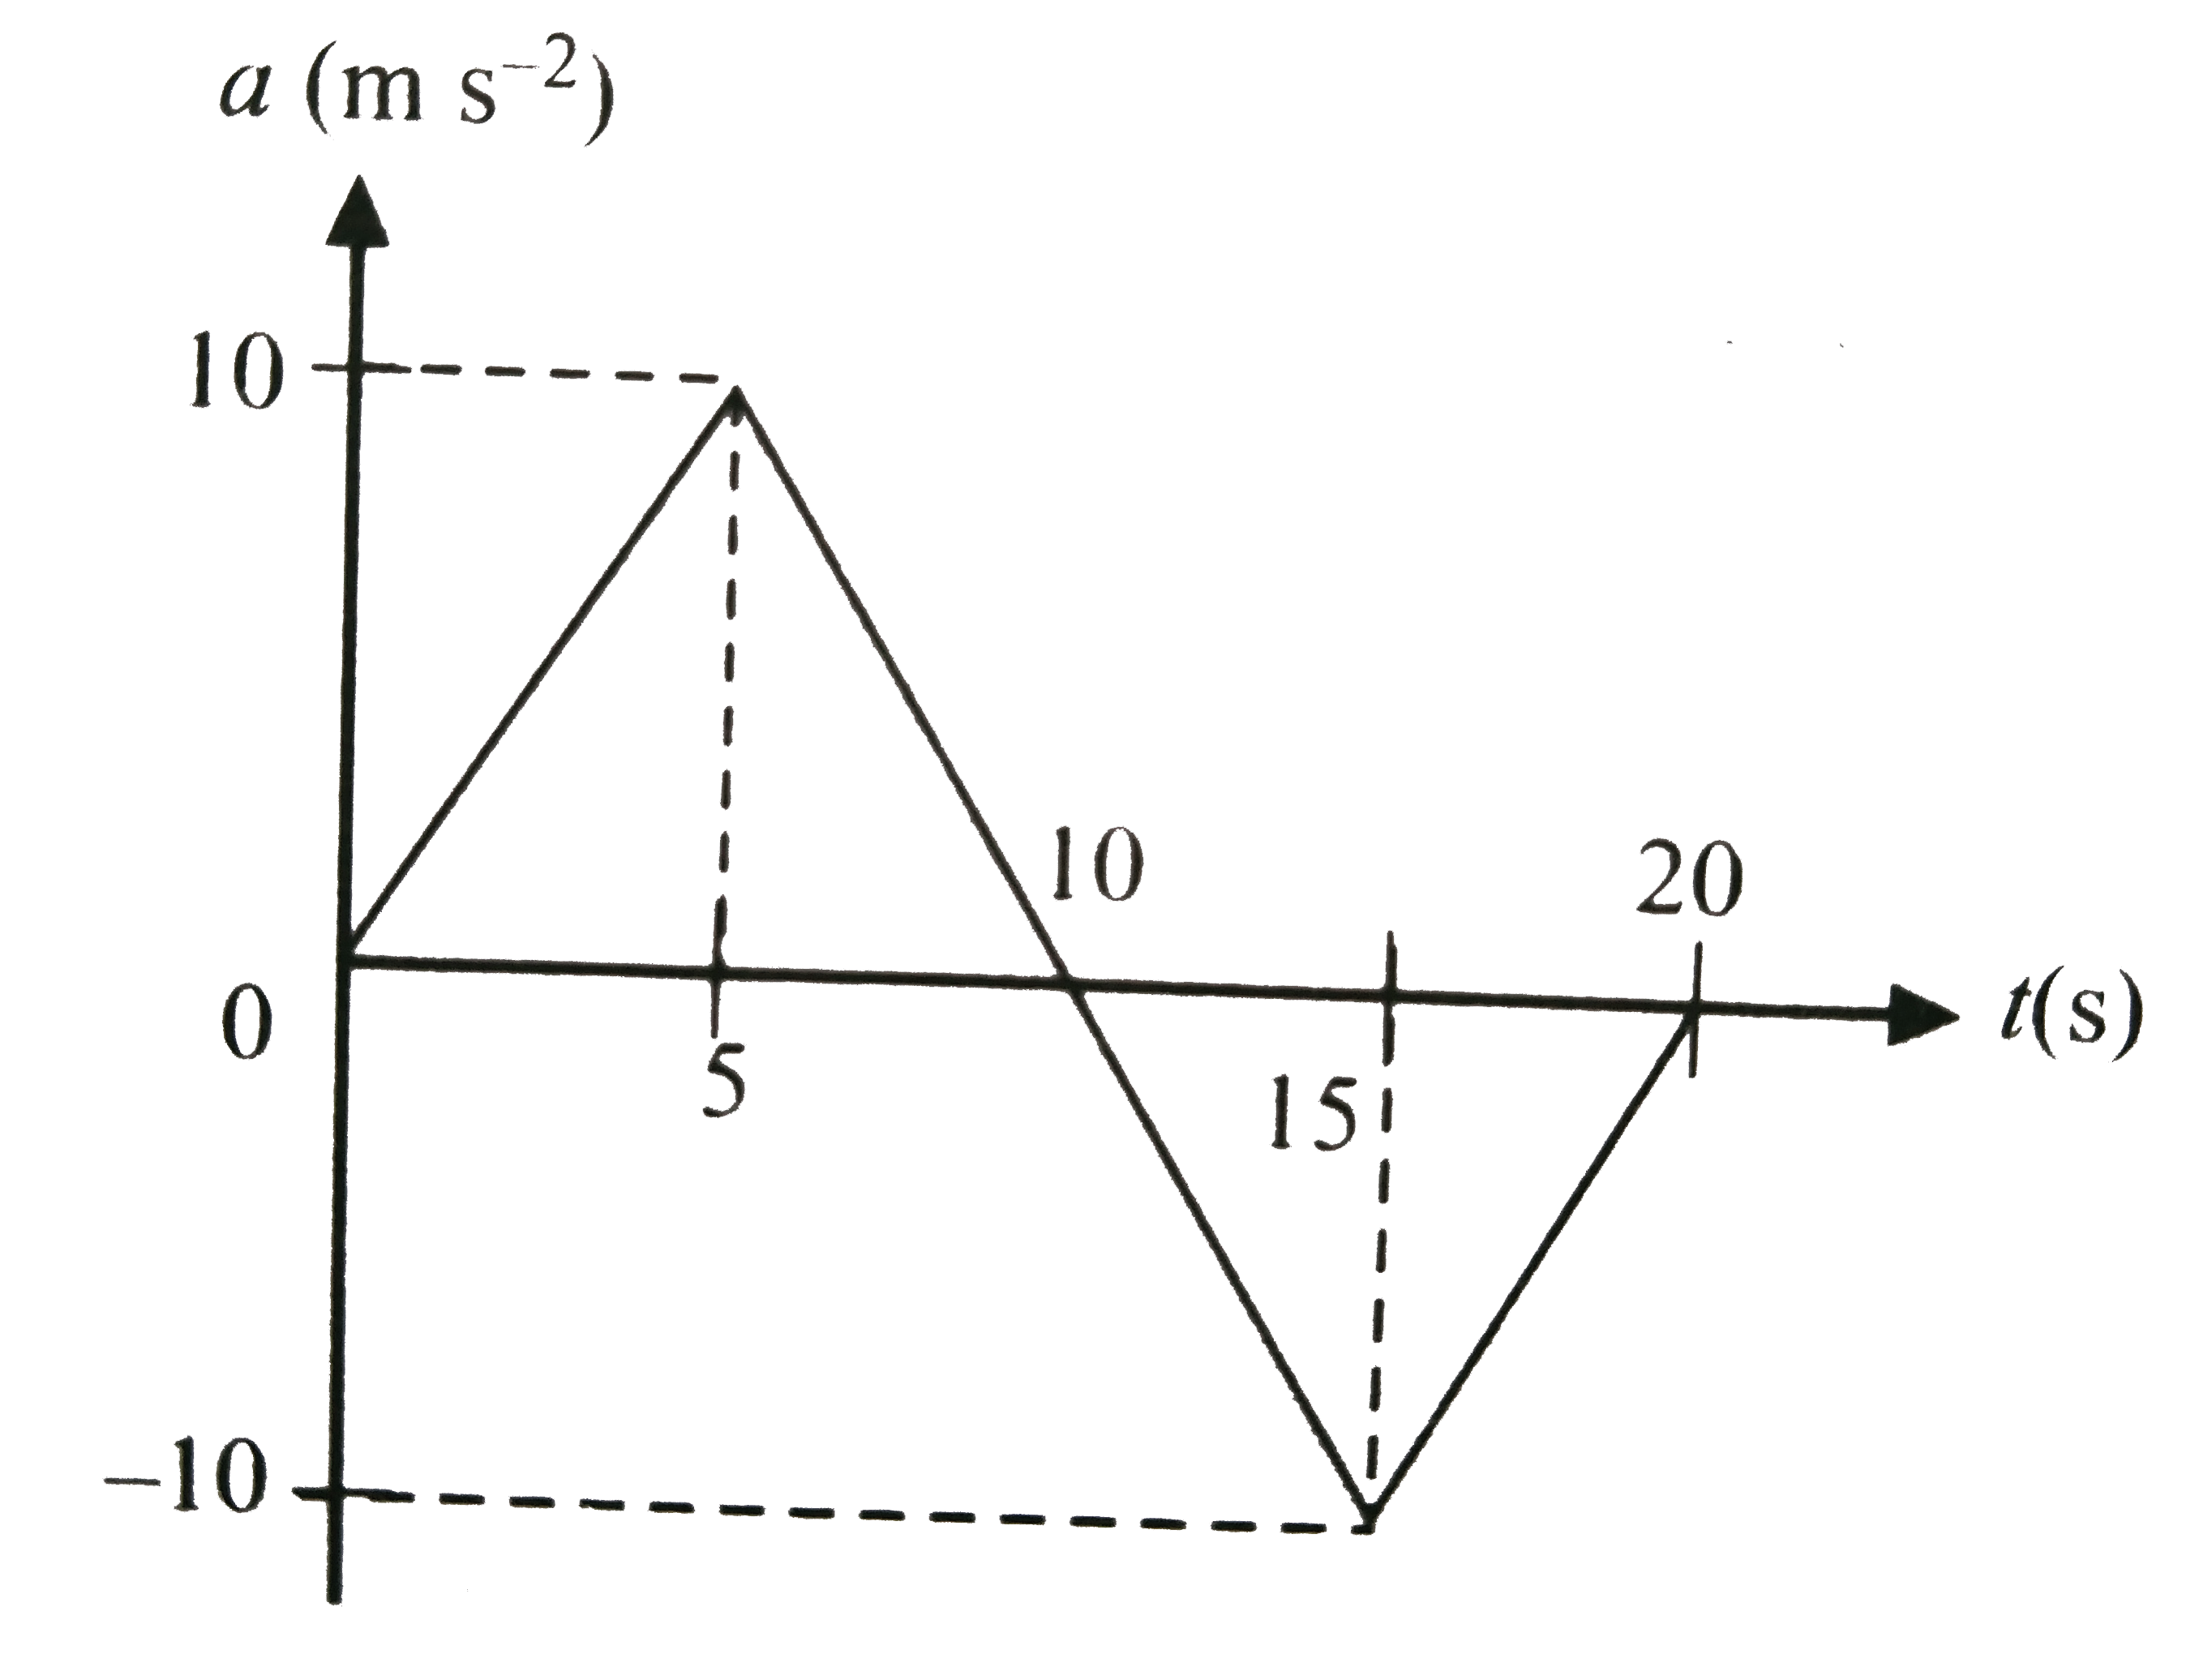
Plot the acceleration-time graph of the welocity-time graph given in.
 .View Solution
For a given acceleration − time graph, there exist ………………………… velocity − time graph
View SolutionAssertion: Area under velocity-time graph give displacement.
Reason: Area under acceleration-time graph give velocity.View SolutionWhich of the following can be a closed curve? Give one example each.
(i) Velocity-time graph
(ii) Displacement-time graph
(iii) Acceleration-time graph
(iv) Velocity-displacement graphView SolutionDraw displacement-time, velocity-time and acceleration-time graphs for a particle executing simple harmonic motion. Discuss their phase relationship.
View SolutionGraphs(Displacement-time)
View SolutionDraw areal velocity time graph for Mars.
View SolutionAcceleration||Acceleration-Time Graph
View SolutionThe graph of displacement v/s time is given below. Its corresponding velocity-time graph will be :
 View Solution

