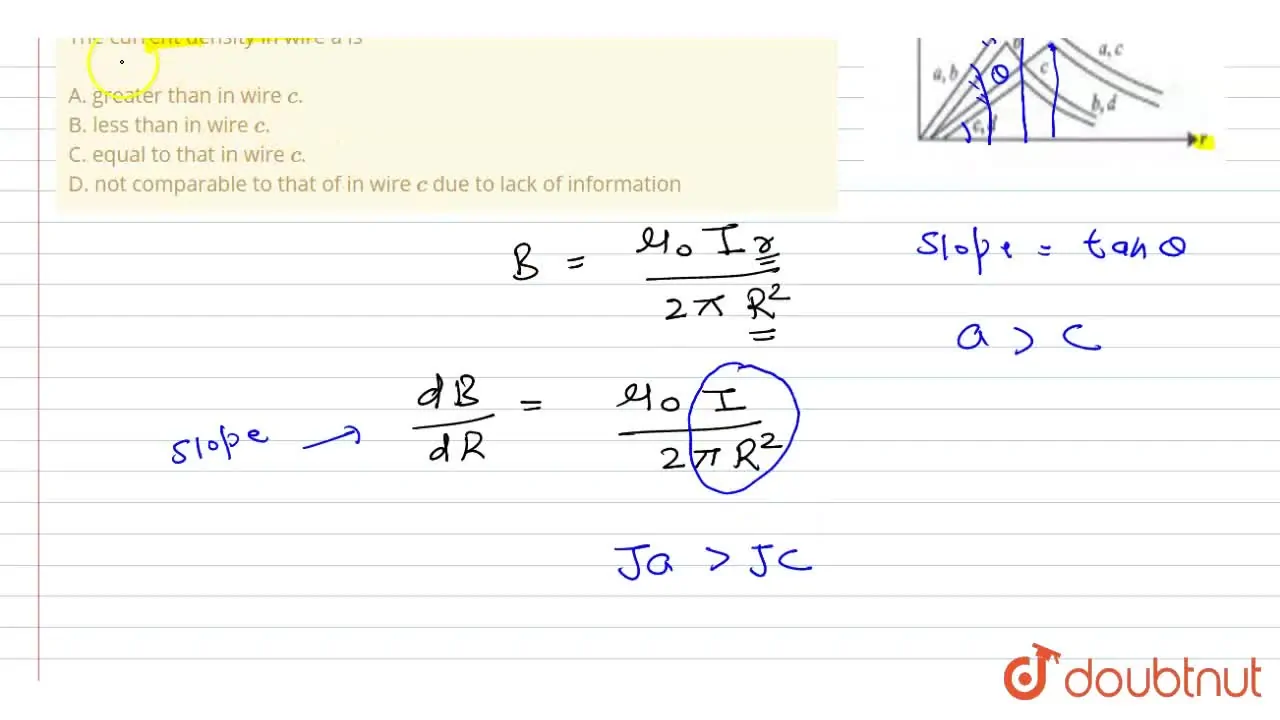
Curves in the graph shown in Fig. give, as function of radius distance r, the magnitude B of the magnetic field inside and outside four long wire a,b,c and d, carrying currents that are uniformly distributed across the cross sections of the wires. Overlapping portions of the plots are indicated by double labels.
The current density in wire a is
A. greater than in wire c.
B. less than in wire c.
C. equal to that in wire c.
D. not comparable to that of in wire c due to lack of information
greater than in wire c.
less than in wire c.
equal to that in wire c.
not comparable to that of in wire c due to lack of information
The correct Answer is:A
Step by step video & image solution for Curves in the graph shown in Fig. give, as function of radius distance r, the magnitude B of the magnetic field inside and outside four long wire a,b,c and d, carrying currents that are uniformly distributed across the cross sections of the wires. Overlapping portions of the plots are indicated by double labels. The current density in wire a is<BR><BR>A. greater than in wire c.<BR>B. less than in wire c.<BR>C. equal to that in wire c.<BR>D. not comparable to that of in wire c due to lack of information by Physics experts to help you in doubts & scoring excellent marks in Class 12 exams.
Related Playlists
- BOOK - RESONANCE ENGLISHCHAPTER - ELECTRODYNAMICSEXERCISE - Exercise-2 PART-3 COMPREHENSION- 35videos
ELECTRODYNAMICS
- BOOK - RESONANCE ENGLISHCHAPTER - ELECTRODYNAMICSEXERCISE - Exercise-3 PART-120videos
ELECTRODYNAMICS
- BOOK - RESONANCE ENGLISHCHAPTER - ELECTRODYNAMICSEXERCISE - Exercise-2 PART-3 COMPREHENSION-15videos
ELECTRODYNAMICS
- BOOK - RESONANCE ENGLISHCHAPTER - ELECTRO MAGNETIC WAVESEXERCISE - Exercise 327videos
ELECTRO MAGNETIC WAVES
- BOOK - RESONANCE ENGLISHCHAPTER - ELECTROMAGNETIC INDUCTIONEXERCISE - A.l.P19videos
ELECTROMAGNETIC INDUCTION
Similar Questions
Curves in the graph shown in Fig. give, as function of radius distance r, the magnitude B of the magnetic field inside and outside four long wire a,b,c and d, carrying currents that are uniformly distributed across the cross sections of the wires. Overlapping portions of the plots are indicated by double labels.

Which wire has the greatest radius?View SolutionCurves in the graph shown in Fig. give, as function of radius distance r, the magnitude B of the magnetic field inside and outside four long wire a,b,c and d, carrying currents that are uniformly distributed across the cross sections of the wires. Overlapping portions of the plots are indicated by double labels.

Which wire has the greatest radius?View SolutionCurves in the graph shown in Fig. give, as function of radius distance r, the magnitude B of the magnetic field inside and outside four long wire a,b,c and d, carrying currents that are uniformly distributed across the cross sections of the wires. Overlapping portions of the plots are indicated by double labels.
Which wire has the greatest radius?
A. a
B. b
C. c
D. dView SolutionCurves in the graph shown in Fig. give, as function of radius distance r, the magnitude B of the magnetic field inside and outside four long wire a,b,c and d, carrying currents that are uniformly distributed across the cross sections of the wires. Overlapping portions of the plots are indicated by double labels.

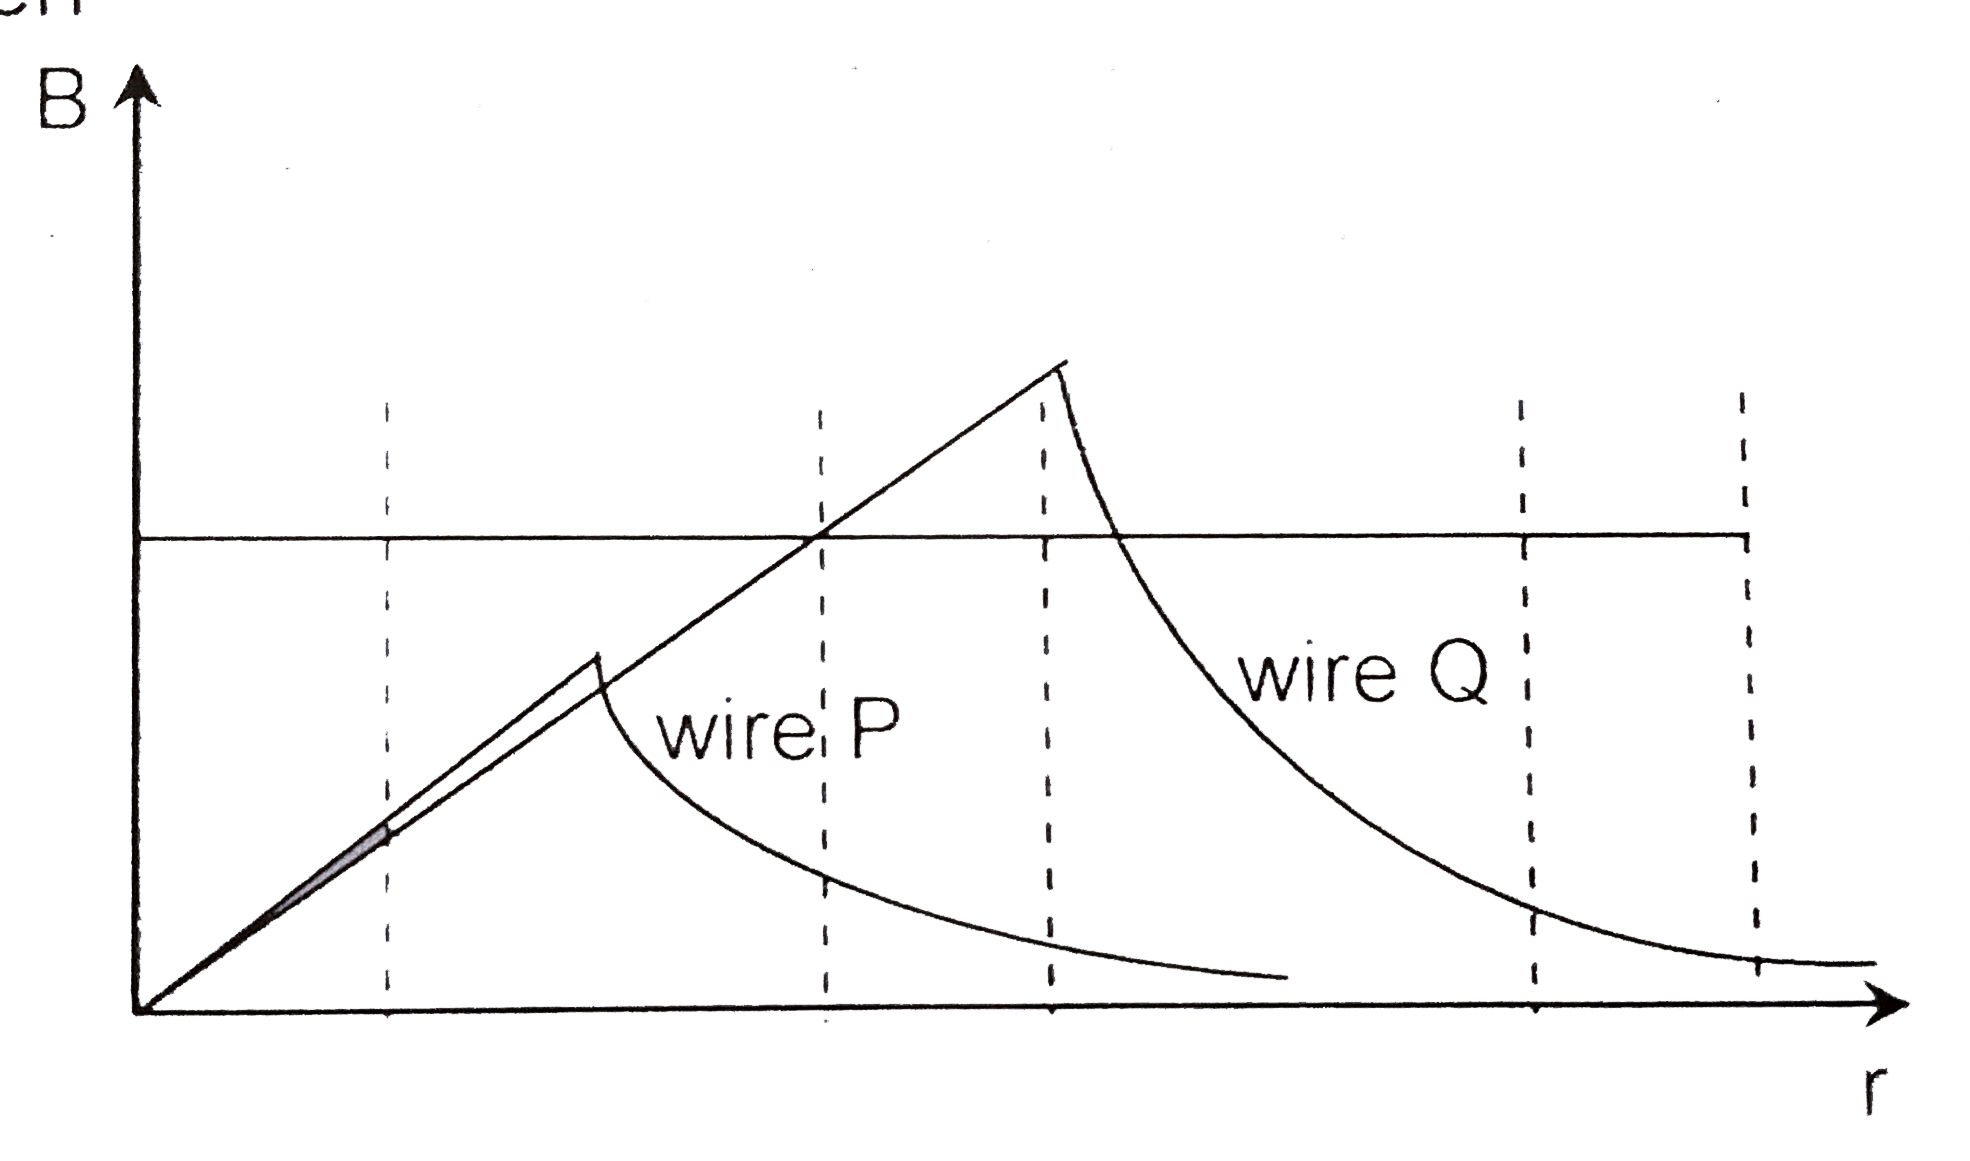
which wire has the greatest magnitude of the magnetic field on the surface?View SolutionFigure shown variation of magnetic field inside and outside two cylindrical wires P and Q carrying currents that are uniformly distributed across the cross section of wires. If current density for two wires are JP and JQ then
 View Solution
A uniform current I is flowing in a long wire of radius R. If the current is uniformly distributed across the cross-sectional area of the wire, then
View SolutionA cylindrical long wire of radius R carries a current I uniformly distributed over the cross sectional area of the wire. The magnetic field at a distance x from the surface inside the wire is
View SolutionA long straight wire of radius a carries a steady current i. The current is uniformly distributed across its cross section. The ratio of the magnetis field at (a)/(2)and(2a) is
View SolutionConsider the magnetic field produced by a finitely long current carrying wire .
View SolutionA long, straight wire of radius R carries a current distributed uniformly over its cross section. The magnitude of the magnetic field is
View Solution


