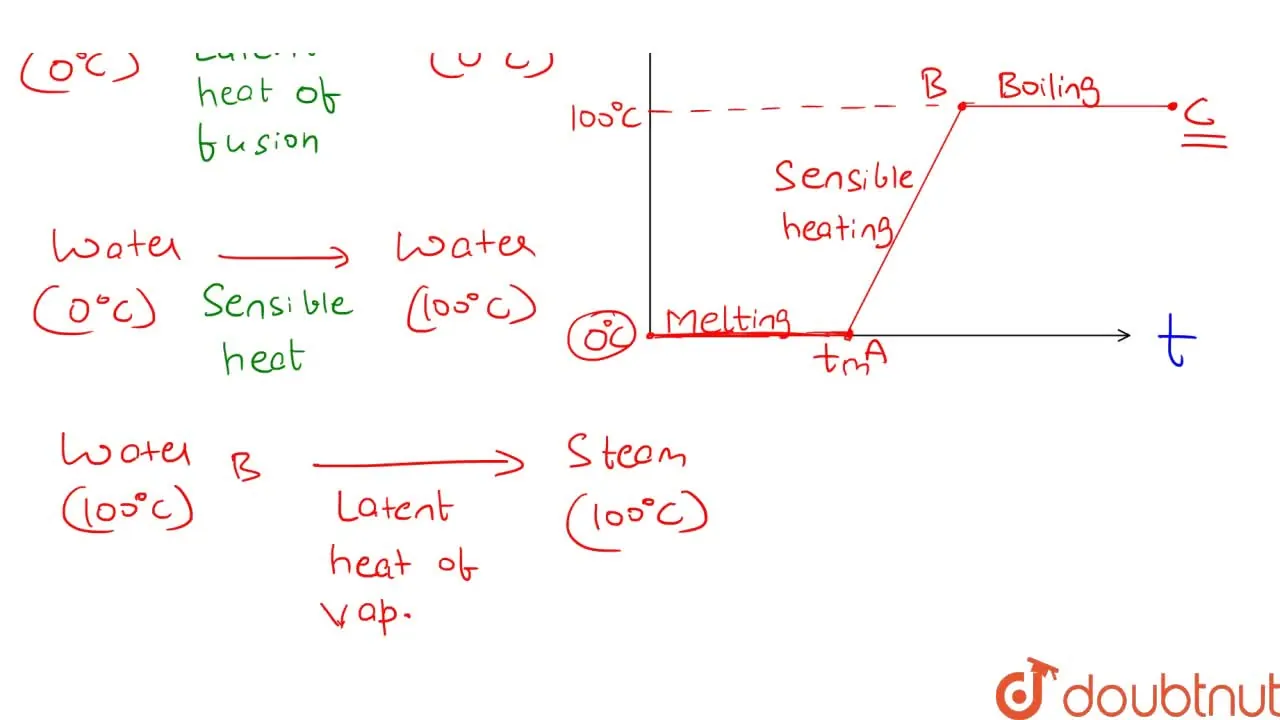
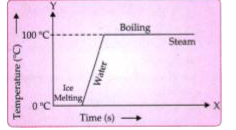
A piece of ice at 0∘C is heated at a constant rate and its temperature recorded at regular intervals till steam is formed at 100∘C. Draw a temperature-time graph to represent the change in phase. Label the different parts of your graph.
Related Playlists
Similar Questions
1 kg of ice at 0∘C is heated at a constant rate and its temperature is recorded after every 30 s till steam is formed at 100∘C. Draw a temperature-time graph to represent the change of phases.
View SolutionA slab of ice at 0∘C is constantly heated till the steam is formed at 100∘C. Draw a graph showing the change in temperature with time. Label the various parts of the graph properly.
View SolutionA certain mass of ice at 0∘C is converted to steam at 100∘C by constant heating, Draw temperature-time graph showing the change in phases.
View SolutionA certain mass of ice at 0∘C is converted to steam at 100∘C by constant heating, Draw temperature-time graph showing the change in phases.
View Solution500g of ice at 0°C is mixed with 1g steam at 100°C. The final temperature of the mixture is
View Solution100 g ice at 0∘C is mixed with 10 g steam at 100∘C . Find the final temperature.
View Solution5g ice at 0∘C is mixed with 5g of steam at 100∘C. What is the final temperature?
View SolutionA piece of ice is heated at a constant rate. The variation in temperature with time of heating is shown in the graph in Fig. 11.6.
(i) What is represented by the part AB ?
(ii) What does the part CD represent ?
(iii) What conclusion do you draw regarding the nature of ice from the graph ?View Solution30 g ice at 0∘C is mixed with 25 g steam at 100∘C. Find the final temperature and composition
View SolutionState the volume changes observed when a givenmass of water is heated from 0∘C to 10∘C. Sketch a temperature volume graph to show the behaviour.
View Solution


