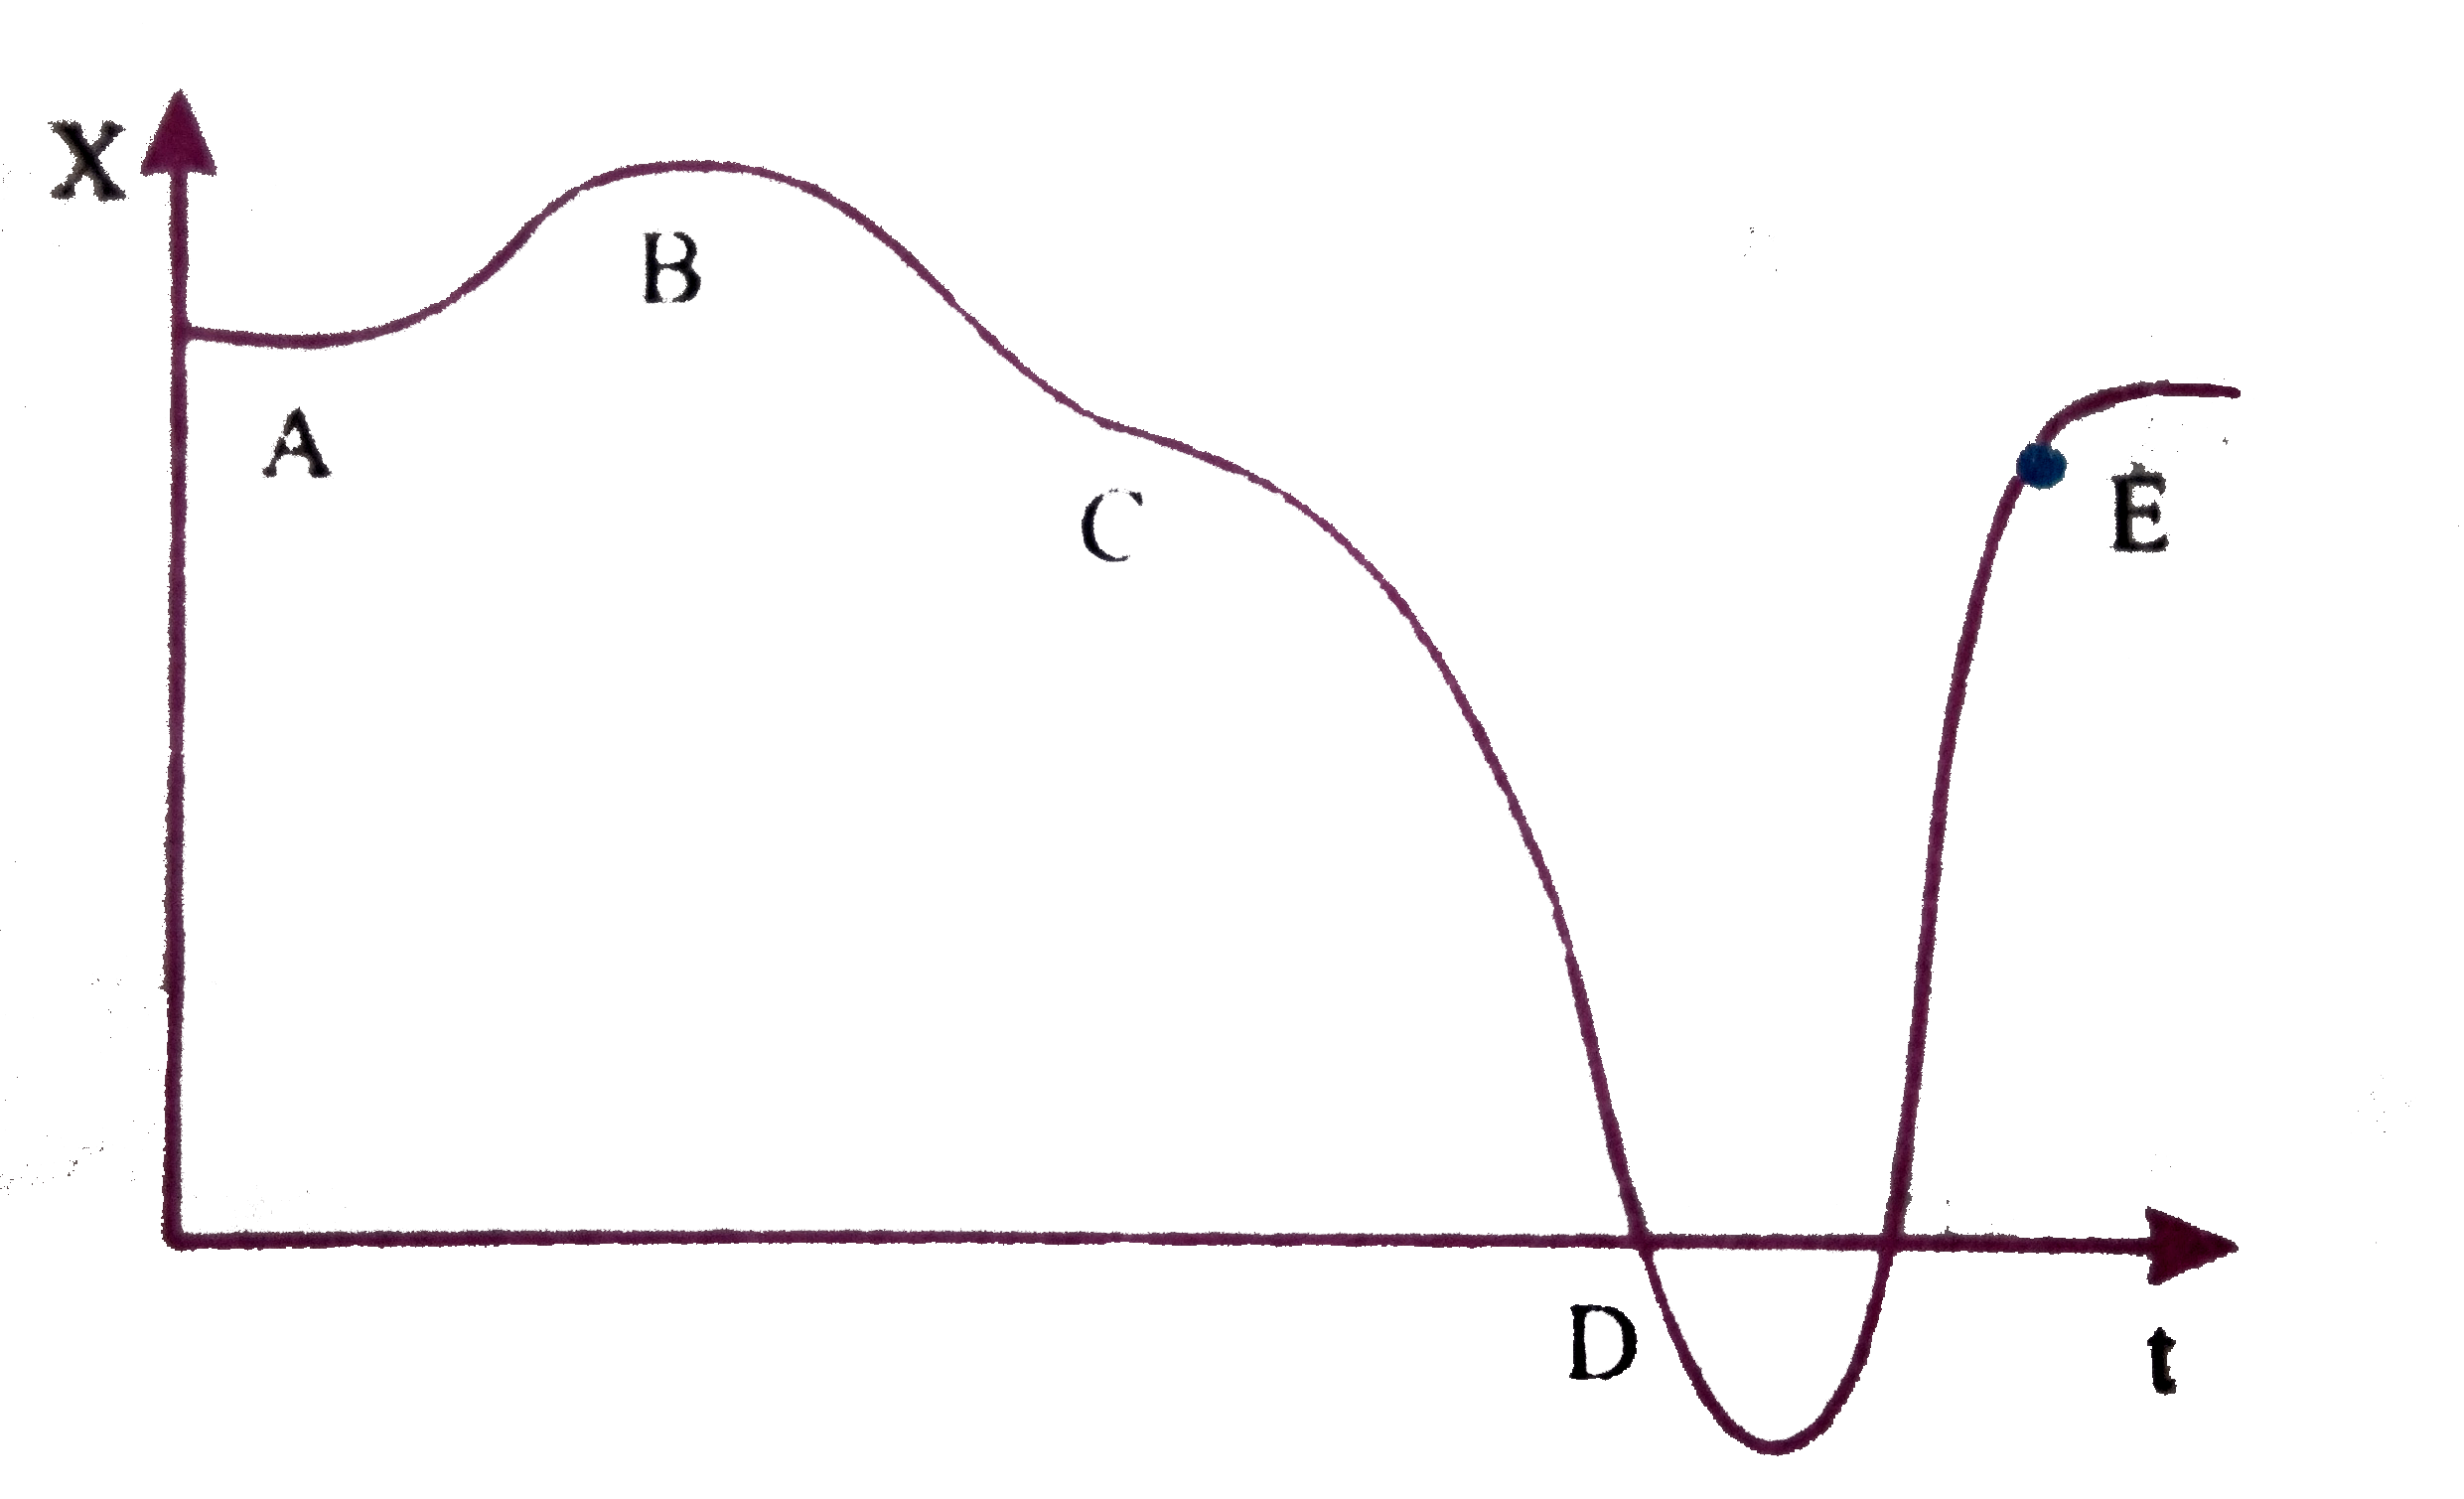
A graph of x versus t is shown in figure. Choose correct alternative from below.
The particle was released from rest at t=0
At B, the acceleration a>0
Average velocity V>0
The speed at D exceeds that at E
The correct Answer is:A, C, D
As per the diagram, at point A the graph is parallel to time axis hence, v=dxdt=0. As the starting point is A hence, we can say that the particle is starting from rest.
At C, the graph changes slope, hence, velocity also changes. As graph c is almost parallel to time axis hence, we can say that velocity vanishes.
As direction of acceleration changes hence, we can say that it may be zero in between.
From the graph it is clear that
|slope at D|>|slope at E|
Hence, speed at D will be more than at E.
Related Playlists
- BOOK - NCERT EXEMPLAR ENGLISHCHAPTER - MOTION IN A STRAIGHT LINE EXERCISE - Very Short Answer Type Qns14videos
MOTION IN A STRAIGHT LINE
- BOOK - NCERT EXEMPLAR ENGLISHCHAPTER - MOTION IN A STRAIGHT LINE EXERCISE - Very Short Answer Type Qns14videos
MOTION IN A STRAIGHT LINE
- BOOK - NCERT EXEMPLAR ENGLISHCHAPTER - MOTION IN A PLANEEXERCISE - Multiple Choice Questions37videos
MOTION IN A PLANE
- BOOK - NCERT EXEMPLAR ENGLISHCHAPTER - OSCILLATIONSEXERCISE - All Questions36videos
OSCILLATIONS
Similar Practice Problems
- Question 1 - Select One
Pressure versus temperature graph of an ideal gas of equal number of moles of different volumes is plotted as shown in Fig. Choose the correct alternative.
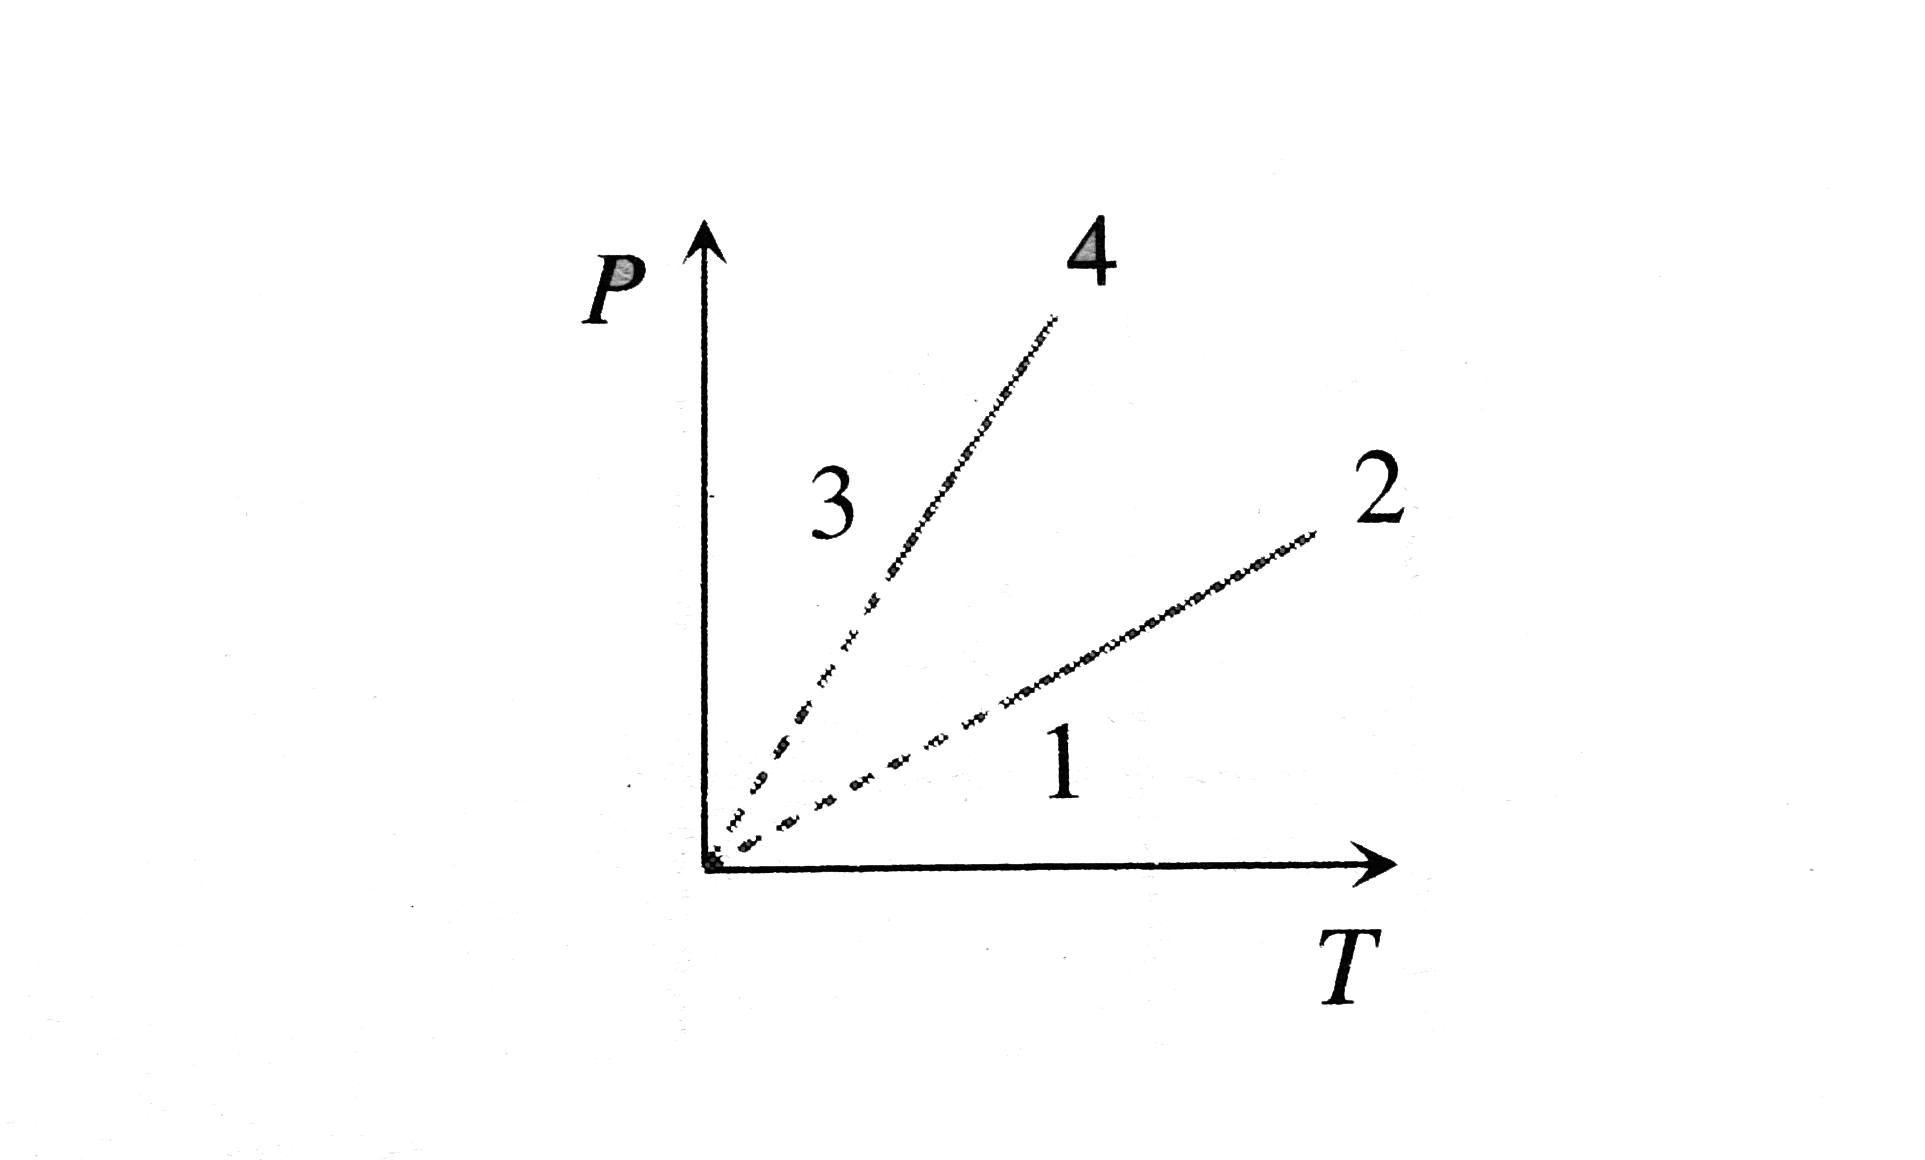 AV1=V2=V3=V4BV4>V3>V2>V1CV1=V2,V3=V4andV2>V3DV1=V2,V3=V4andV2<V3
Similar Questions
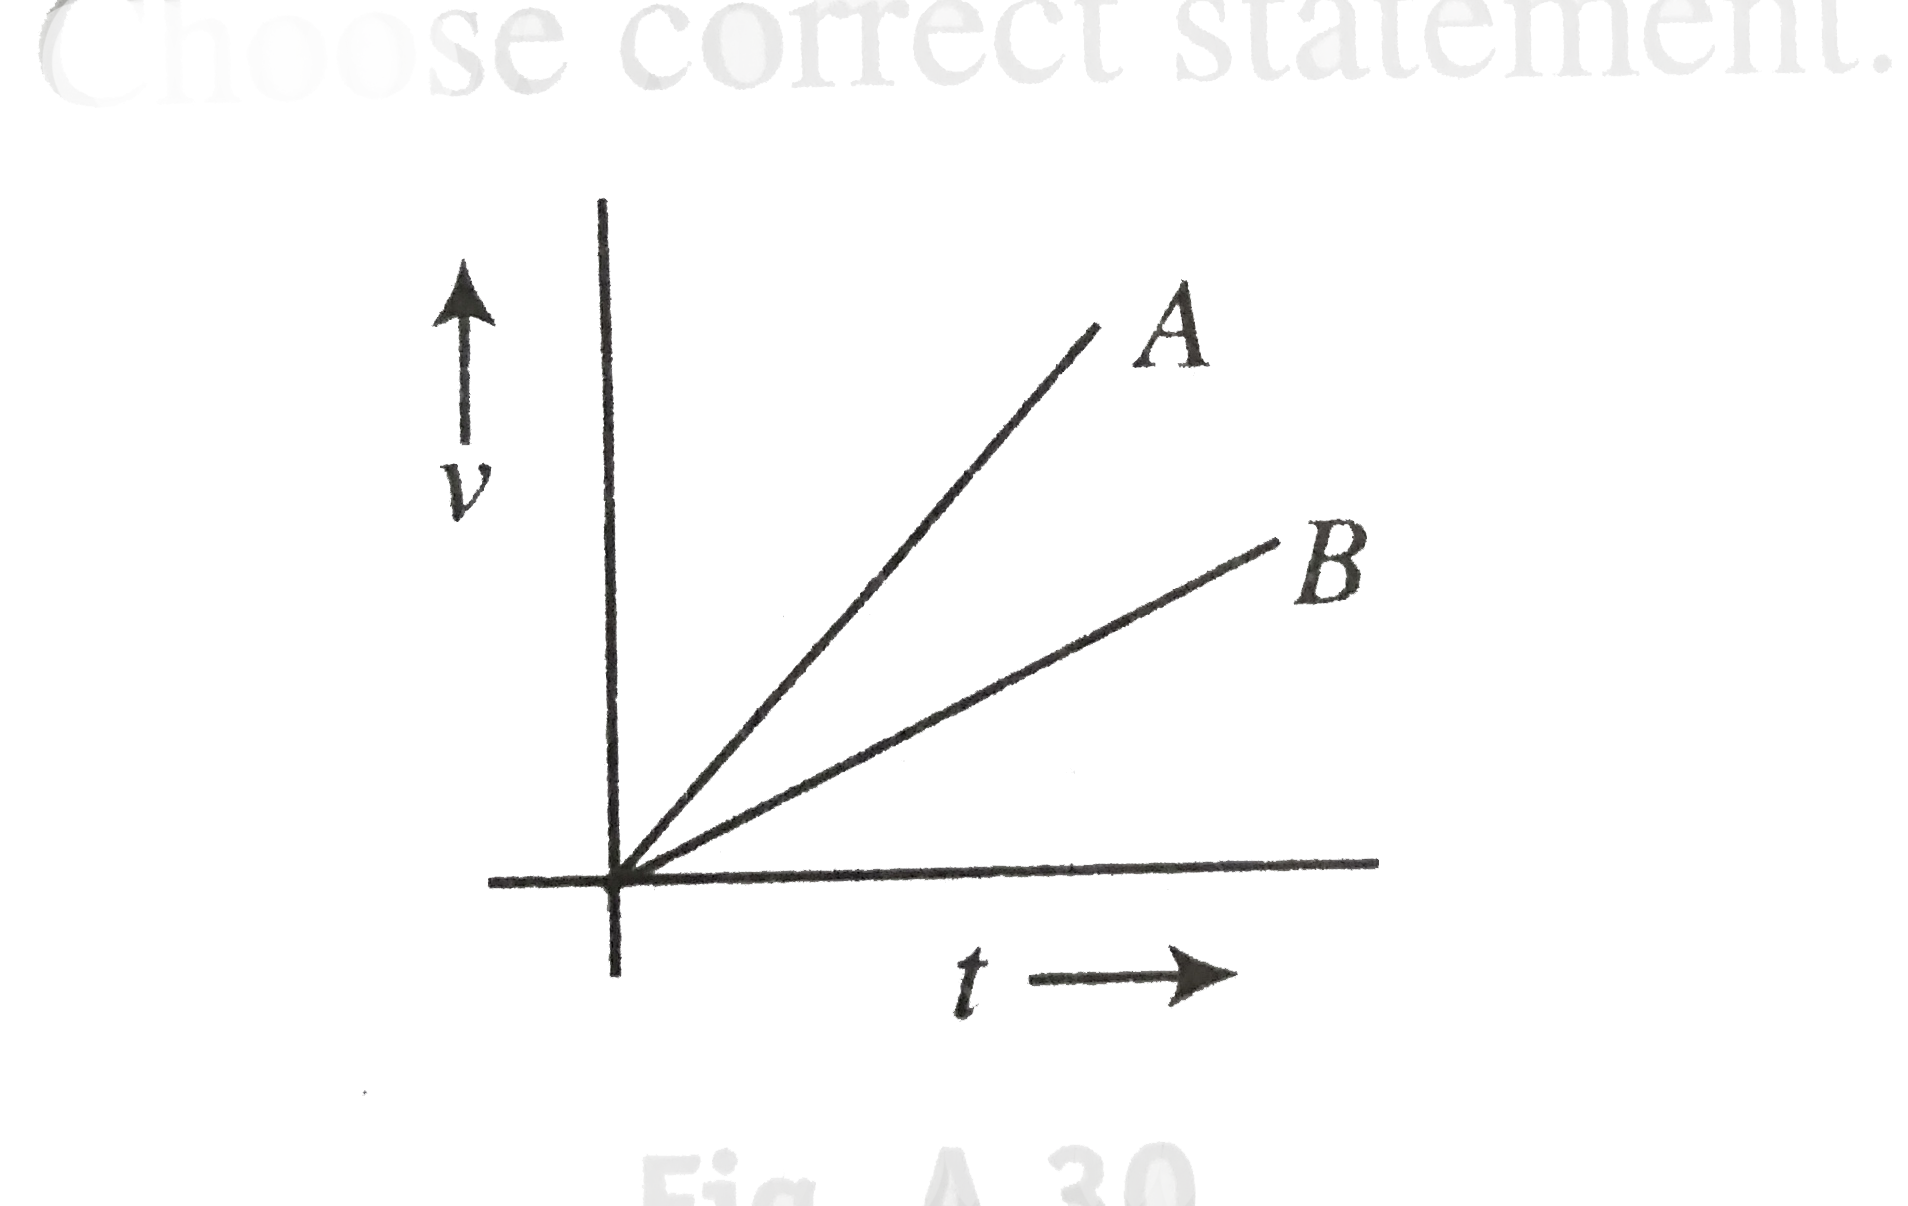
The velocity - time graph of two bodies A and B is shown in figure. Choose correct statement.
 View Solution
Volume versus temperature (V-T) graph of an ideal gas of equal number of moles is plotted as shown in the figure. Choose the correct alternative.
View SolutionA solid cylinder of mass M and radius R pure rolls on a rough surface as shown in the figure. Choose the correct alternative (s).
 View Solution
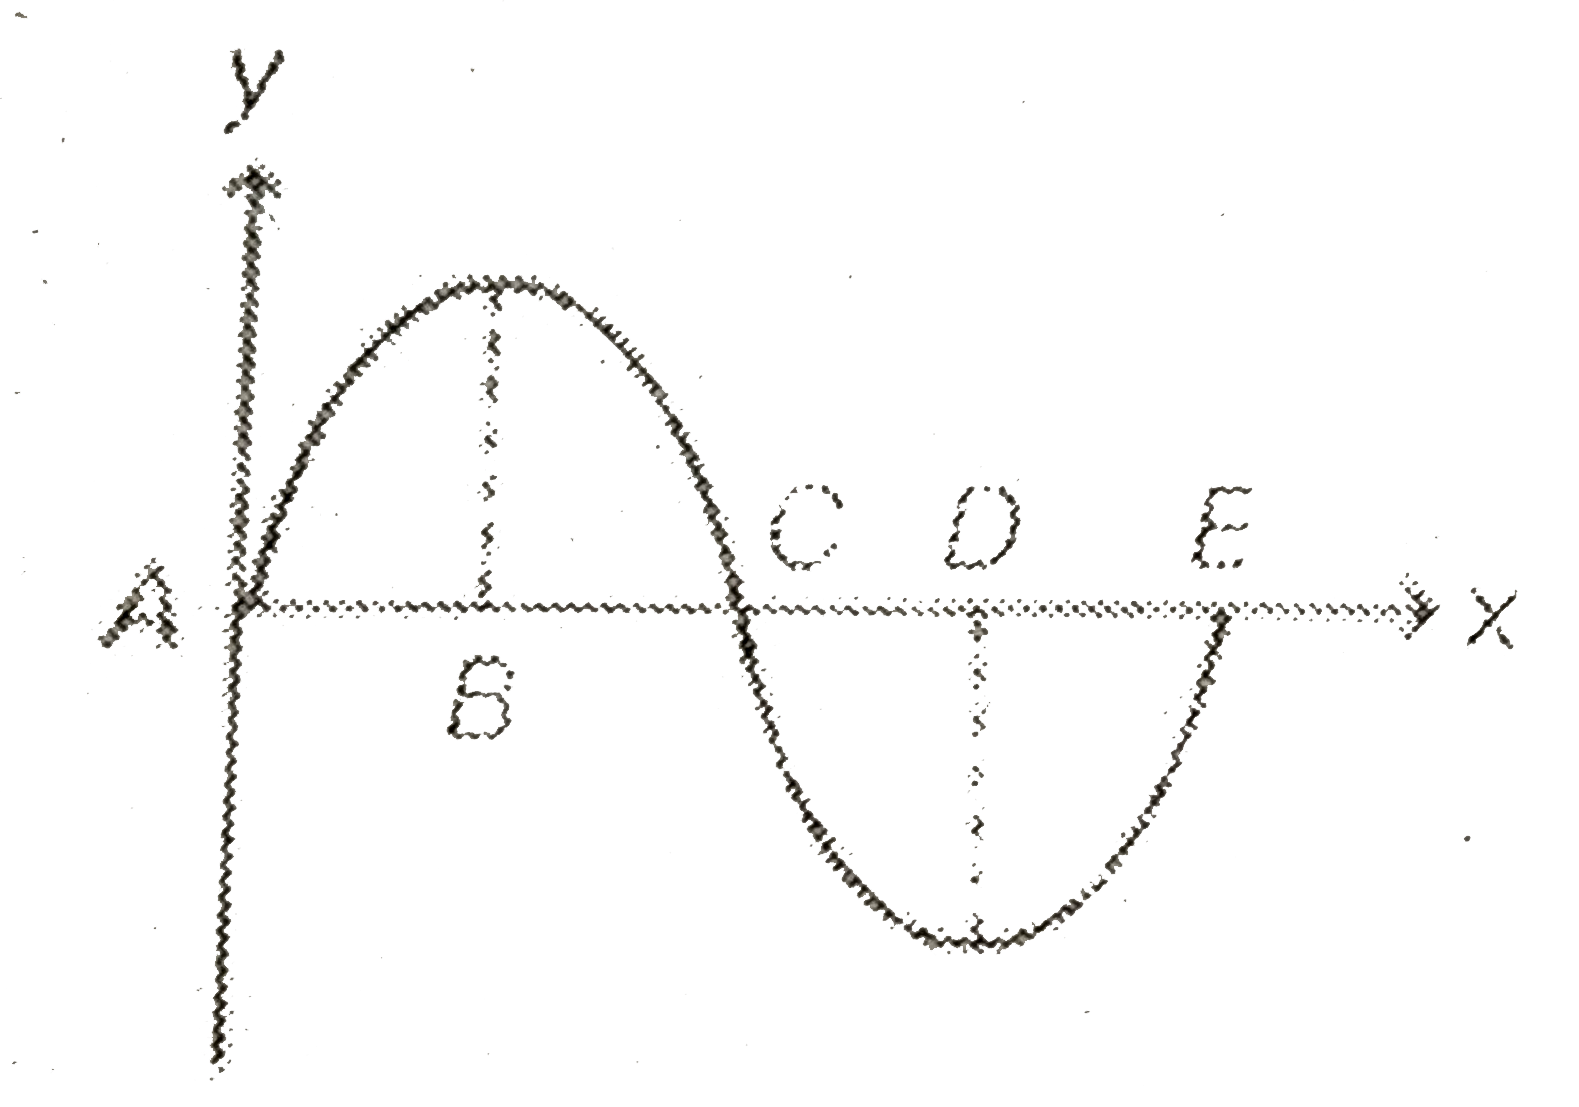
Sound wave is travellimg along positive x -direction . Displacement (y) of particles from their mean position at position x is a shown in figure . Choose the correct alternative(s).
 View Solution
Circuit as shown in figure below, choose the correct statement
 View Solution
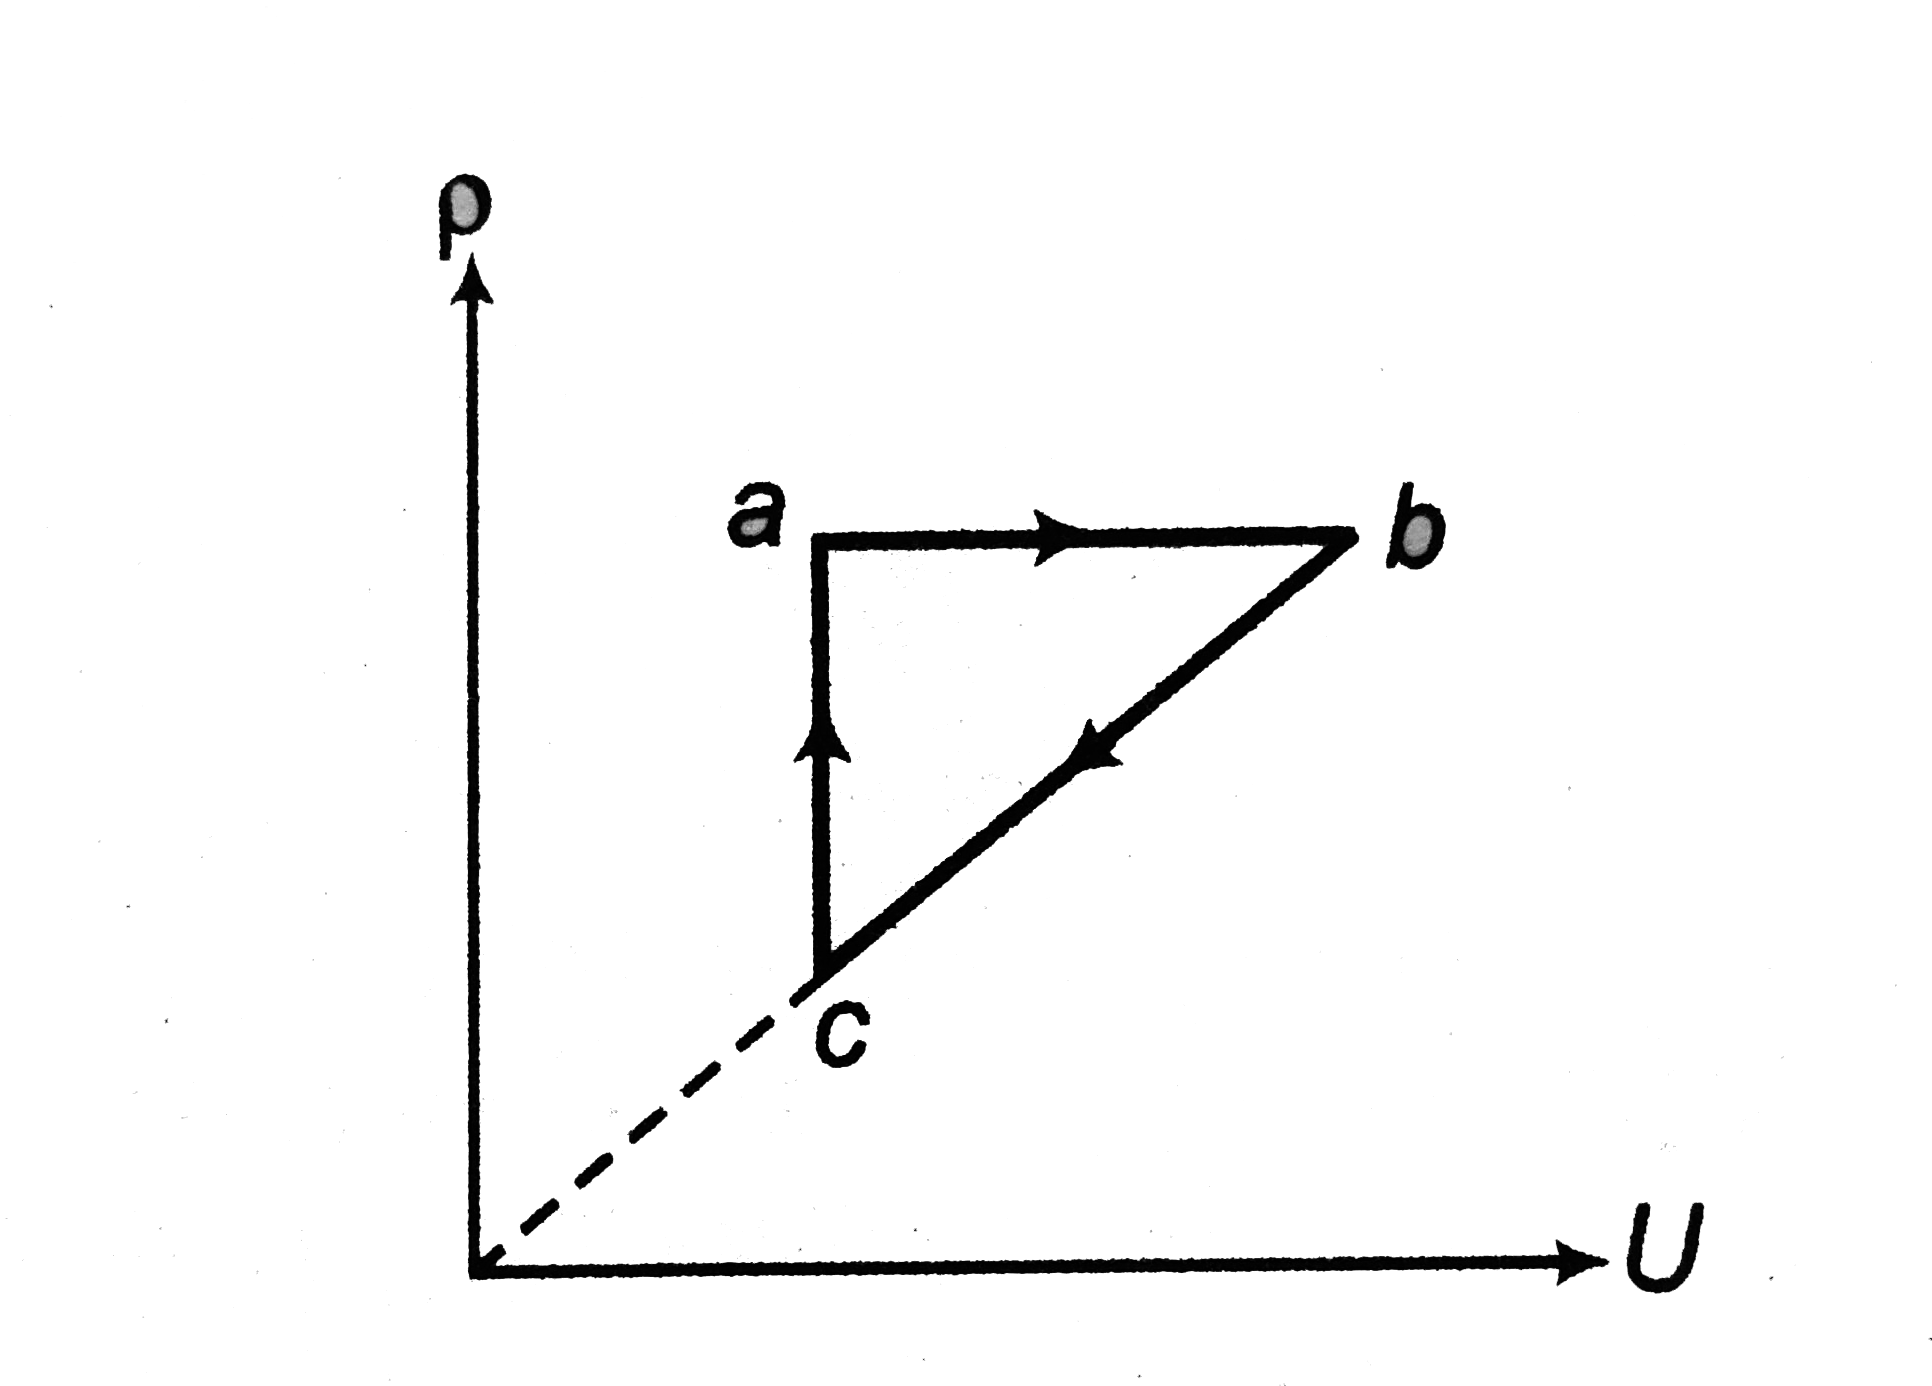
Density (ρ) versus internal energy (U) graph of a gas is as shown in figure. Choose the correct options.
Here, W is work done by gas and Q is heat given to the gas.
 View Solution
Pressure versus temperature graph of an ideal gas of equal number of moles of different volumes is plotted as shown in Fig. Choose the correct alternative.
 View Solution
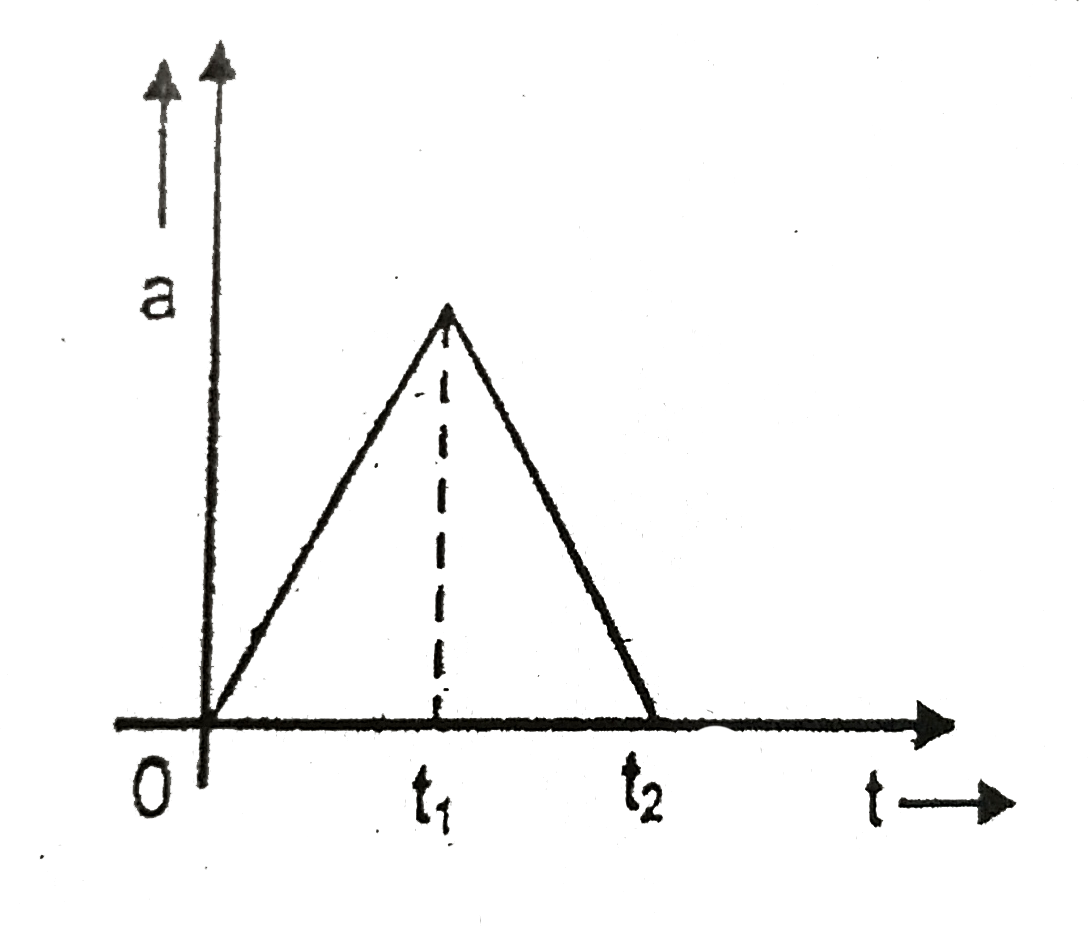
A particle starts to move along a straight line. The acceleration versus time graph of particle is as shown in figure. The correct velocity versus time graph is :
 View Solution
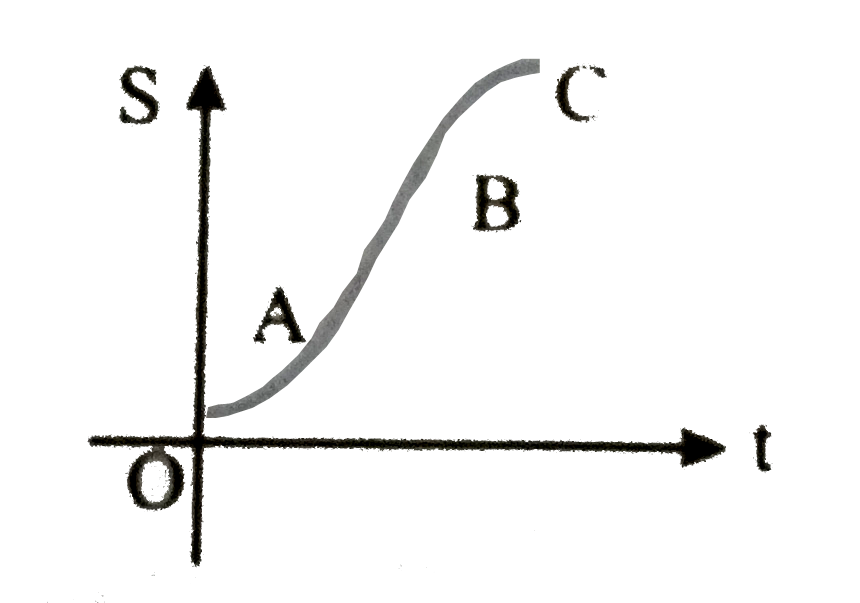
Displacement time graph of a particle moving in a straight line is as shown in figure. Select the correct alternative (s) :
 .View Solution

