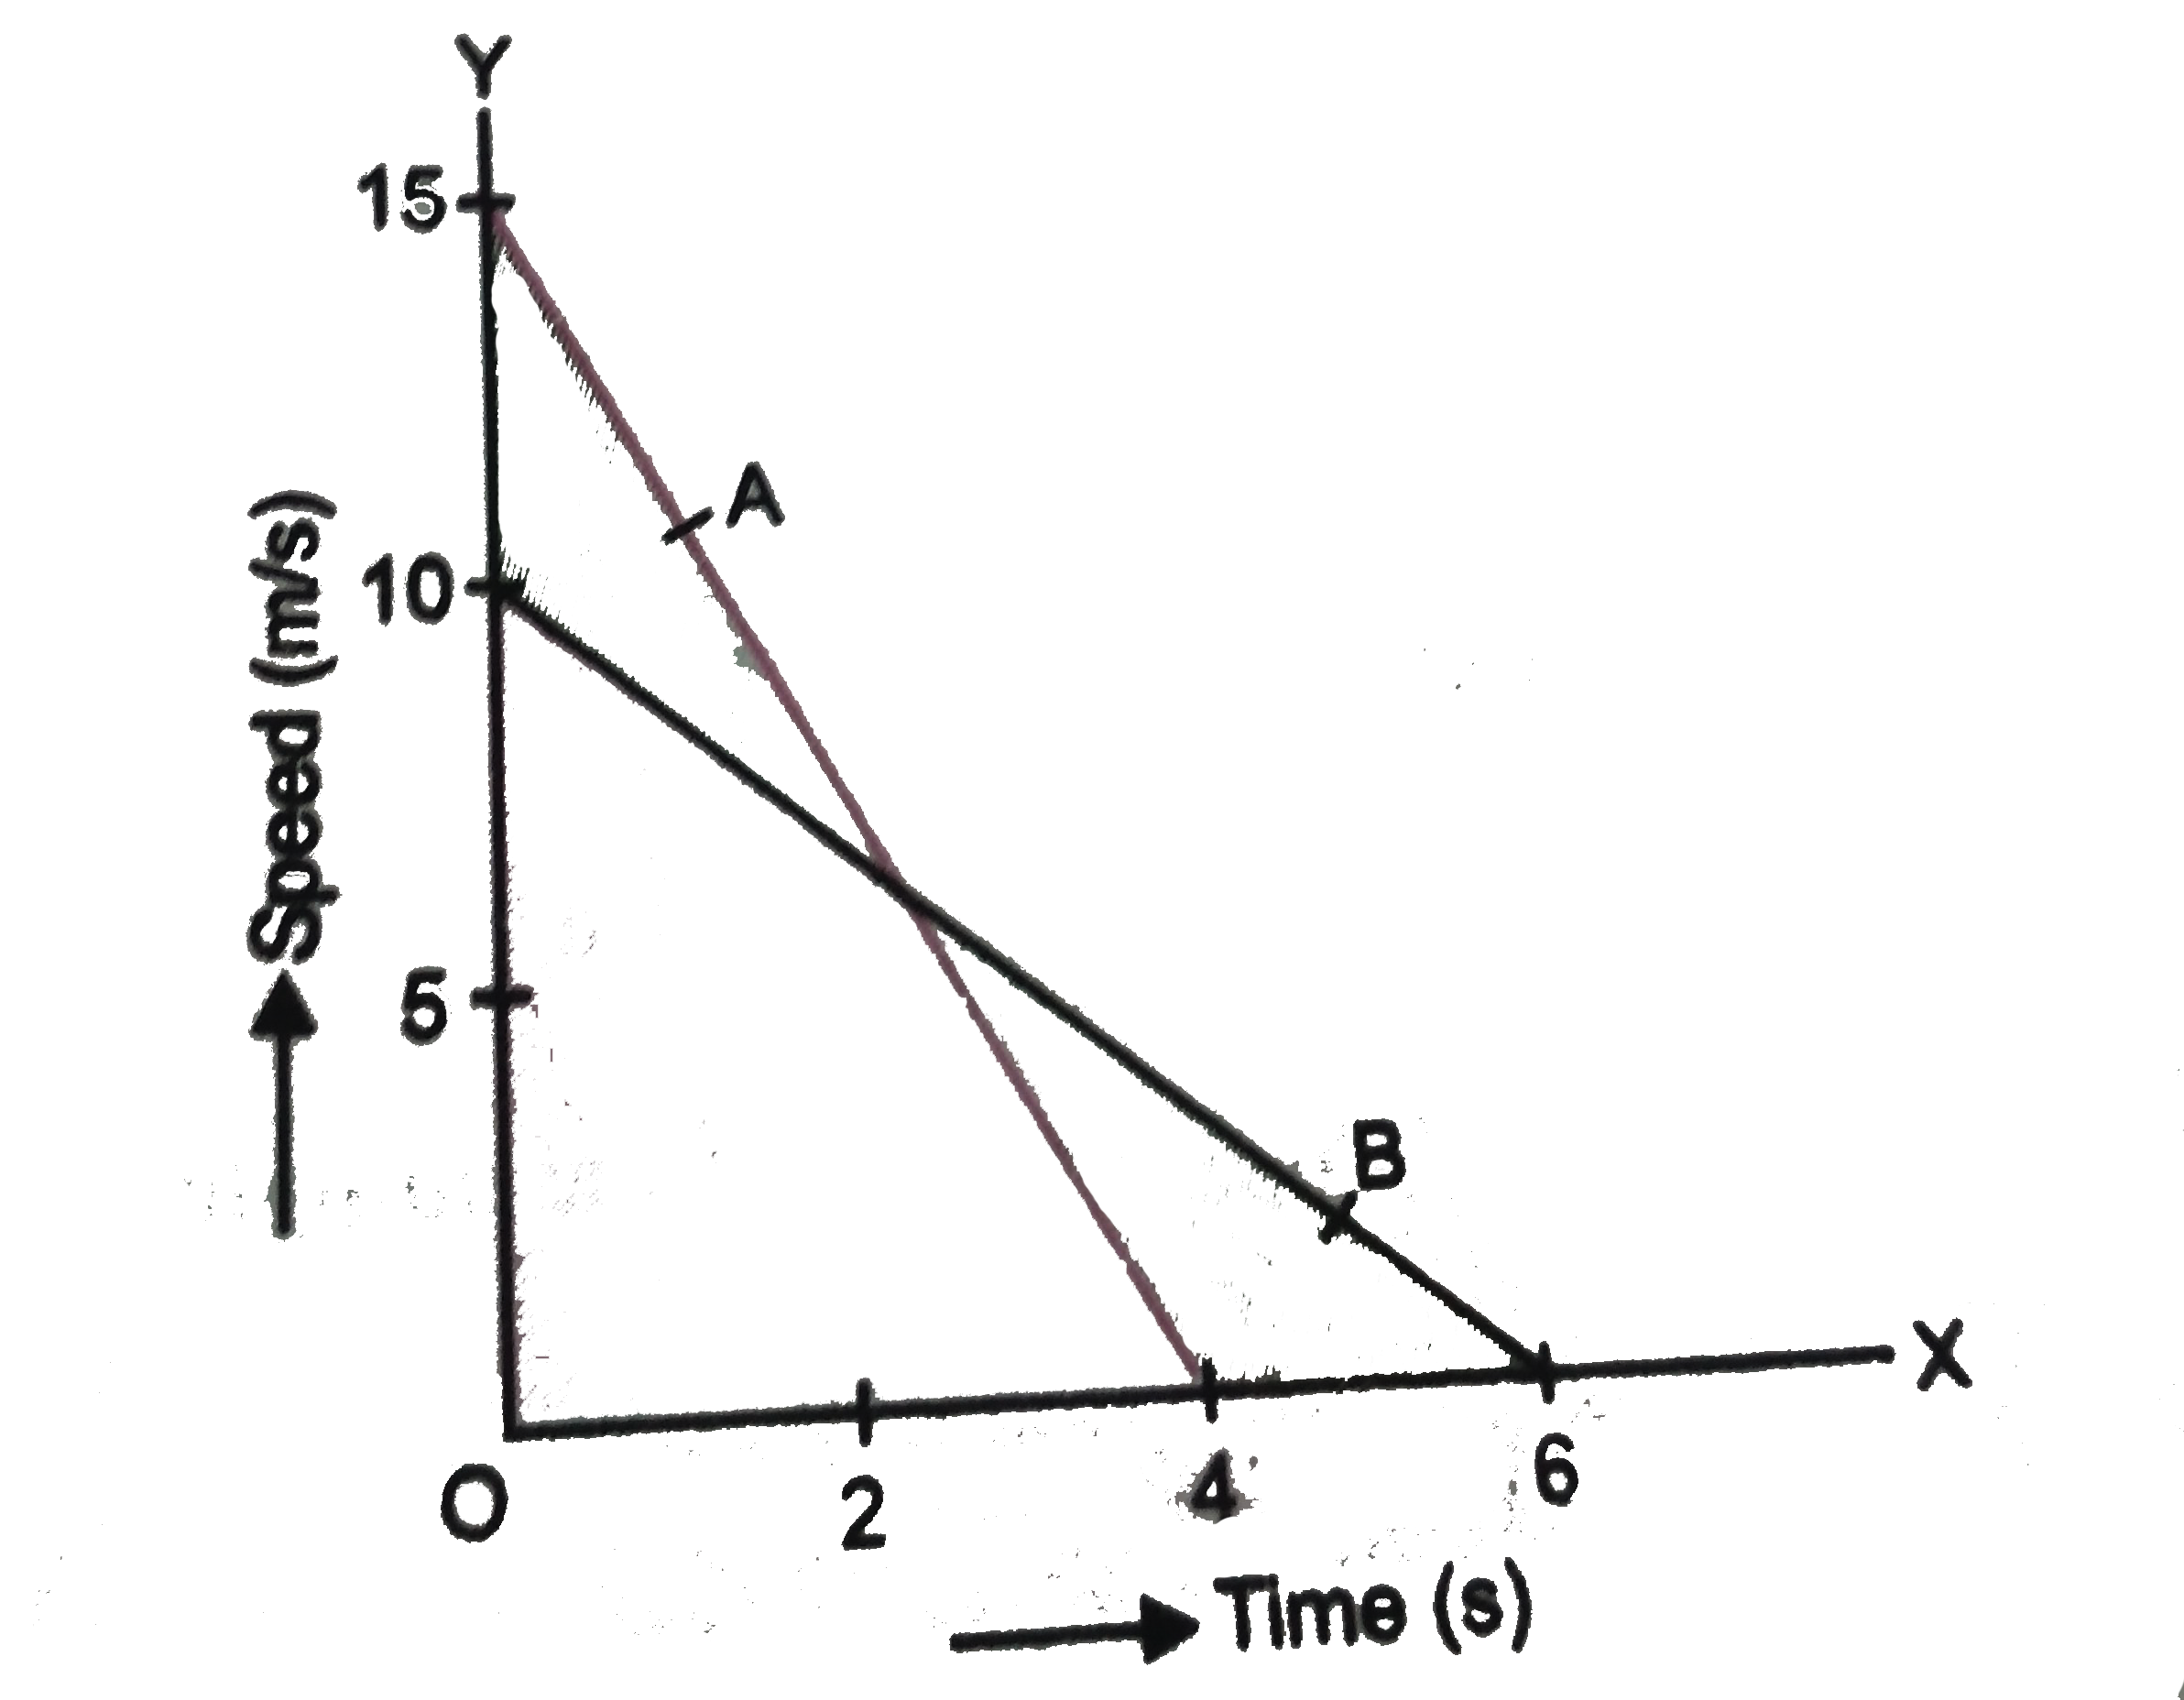
A driver of a car A travelling at 54km/h applies the brakes and stops the car in 4 seconds. Another driver of car B travelling at 36km/h applies the brakes and stops the car in 6 seconds. Plot speed versus time graphs for the two car. which of the cars travelled farther before stopping ?
For Car A
u=54km/h=54×1000m60×60s=15m/s
v=0,t=4sec.
For Car B
u=36km/h=36×1000m60×60s=10m/s
The speed time graphs for cars A and B are as hsown in Fig.
Distance travelled by A before stopping
s1= area under vel. time graph of A=15×42=30m
Distance travelled by B before stopping
s2= area under vel. time graph of B=10×62=30m
Clearly, s1=s2

Related Playlists
- BOOK - PRADEEPCHAPTER - MOTIONEXERCISE - formative Assesment paper pen test15videos
MOTION
- BOOK - PRADEEPCHAPTER - MOTIONEXERCISE - Formative Assessment 1(b) - Oral testing (Exercise)1videos
MOTION
- BOOK - PRADEEPCHAPTER - MOTIONEXERCISE - Worksheet testing(fill in the blanks)5videos
MOTION
- BOOK - PRADEEPCHAPTER - GRAVITATIONEXERCISE - Model Test paper (1)36videos
GRAVITATION
- BOOK - PRADEEPCHAPTER - SOUNDEXERCISE - Model Test (sec - B)12videos
SOUND
Similar Questions
a driver of a car travelling at 52km/h applies the brakes and acceleration uniformly in the opposite direction. The car stops in 5s. Another driver going at 34km/h in another car applies his brakes slowly and stops in 10s. On the same graph paper, plot the speed versus time graphs for the two cars. Which of the two cars travelled farther after the brakes were applied ?
View SolutionWhen the driver of a fast moving car suddenly applies brakes, the passengers in the car
View SolutionWhen a car driver travelling at a speed of 10 m/s applies brakes and brings the car to rest in 20 s, then retardation will be :
View SolutionA car is travelling with a speed of 36 km/hr.The driver applies the brakes & retard the car uniformly.The car is stopped in 5 seconds. The retardation of the car
View SolutionA car travelling at 20 km/h speeds up to 6 km/h in 6 seconds. What is its acceleration ?
View SolutionA car is travelling 60 km in 2 h, then the distance travelled by the car in 6 h, if the speed remains constant, is :
View SolutionA car travelling at 36km/h speeds upto 72km/h in 5 seconds. What is its acceleration ? If the same car stops in 20 seconds , what is the acceleration?
View SolutionA car 2 m long travelling at 30ms−1 overtakes another car 4 m long travelling at 20ms−1. The time taken by the first car to pass the second car is
View SolutionA car is initially travelling at 50.0 km/h. The brakes are applied and the car stops over a distance of 35 m. What was magnitude of the car's acceleration while it was braking ?
View SolutionThe distance travelled by a motor car in t seconds after the brakes are applied is s feet where s=22t−12t2. The distance travelled by the car before it stops, is
View Solution


