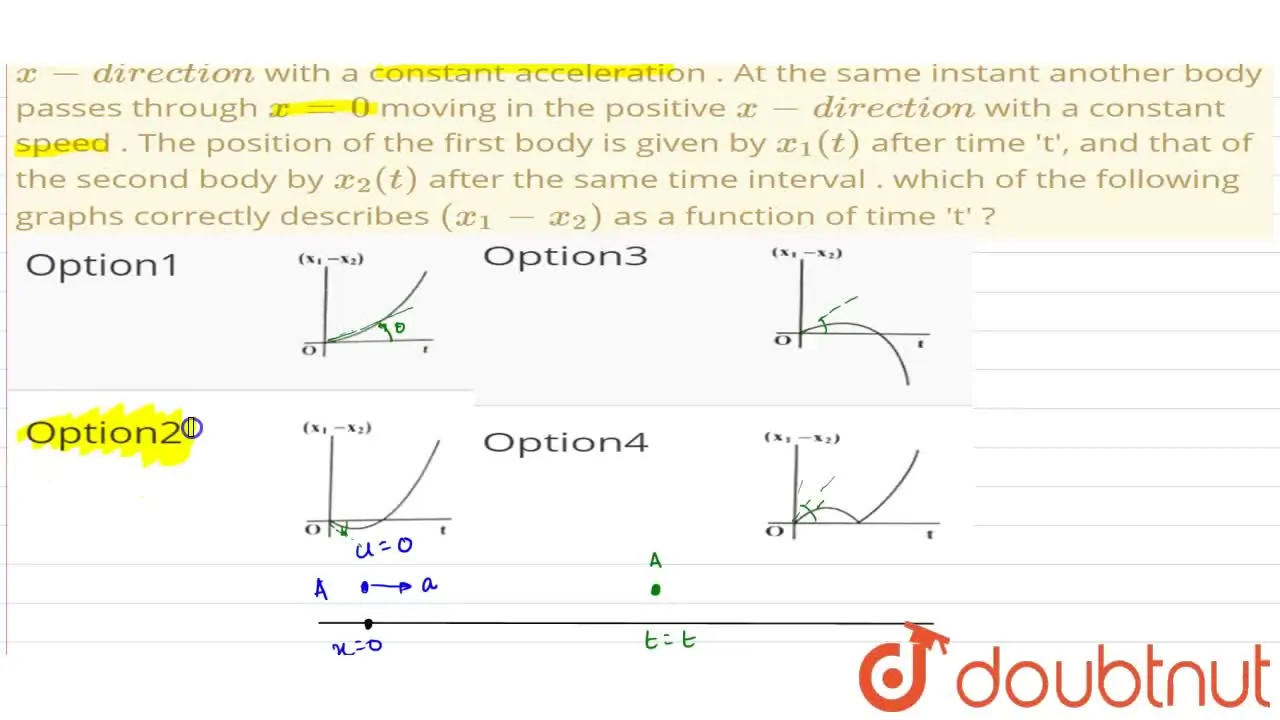
A body is at rest at x=0 . At t=0, it starts moving in the positive x−direction with a constant acceleration . At the same instant another body passes through x=0 moving in the positive x−direction with a constant speed . The position of the first body is given by x1(t) after time 't', and that of the second body by x2(t) after the same time interval . which of the following graphs correctly describes (x1−x2) as a function of time 't' ?
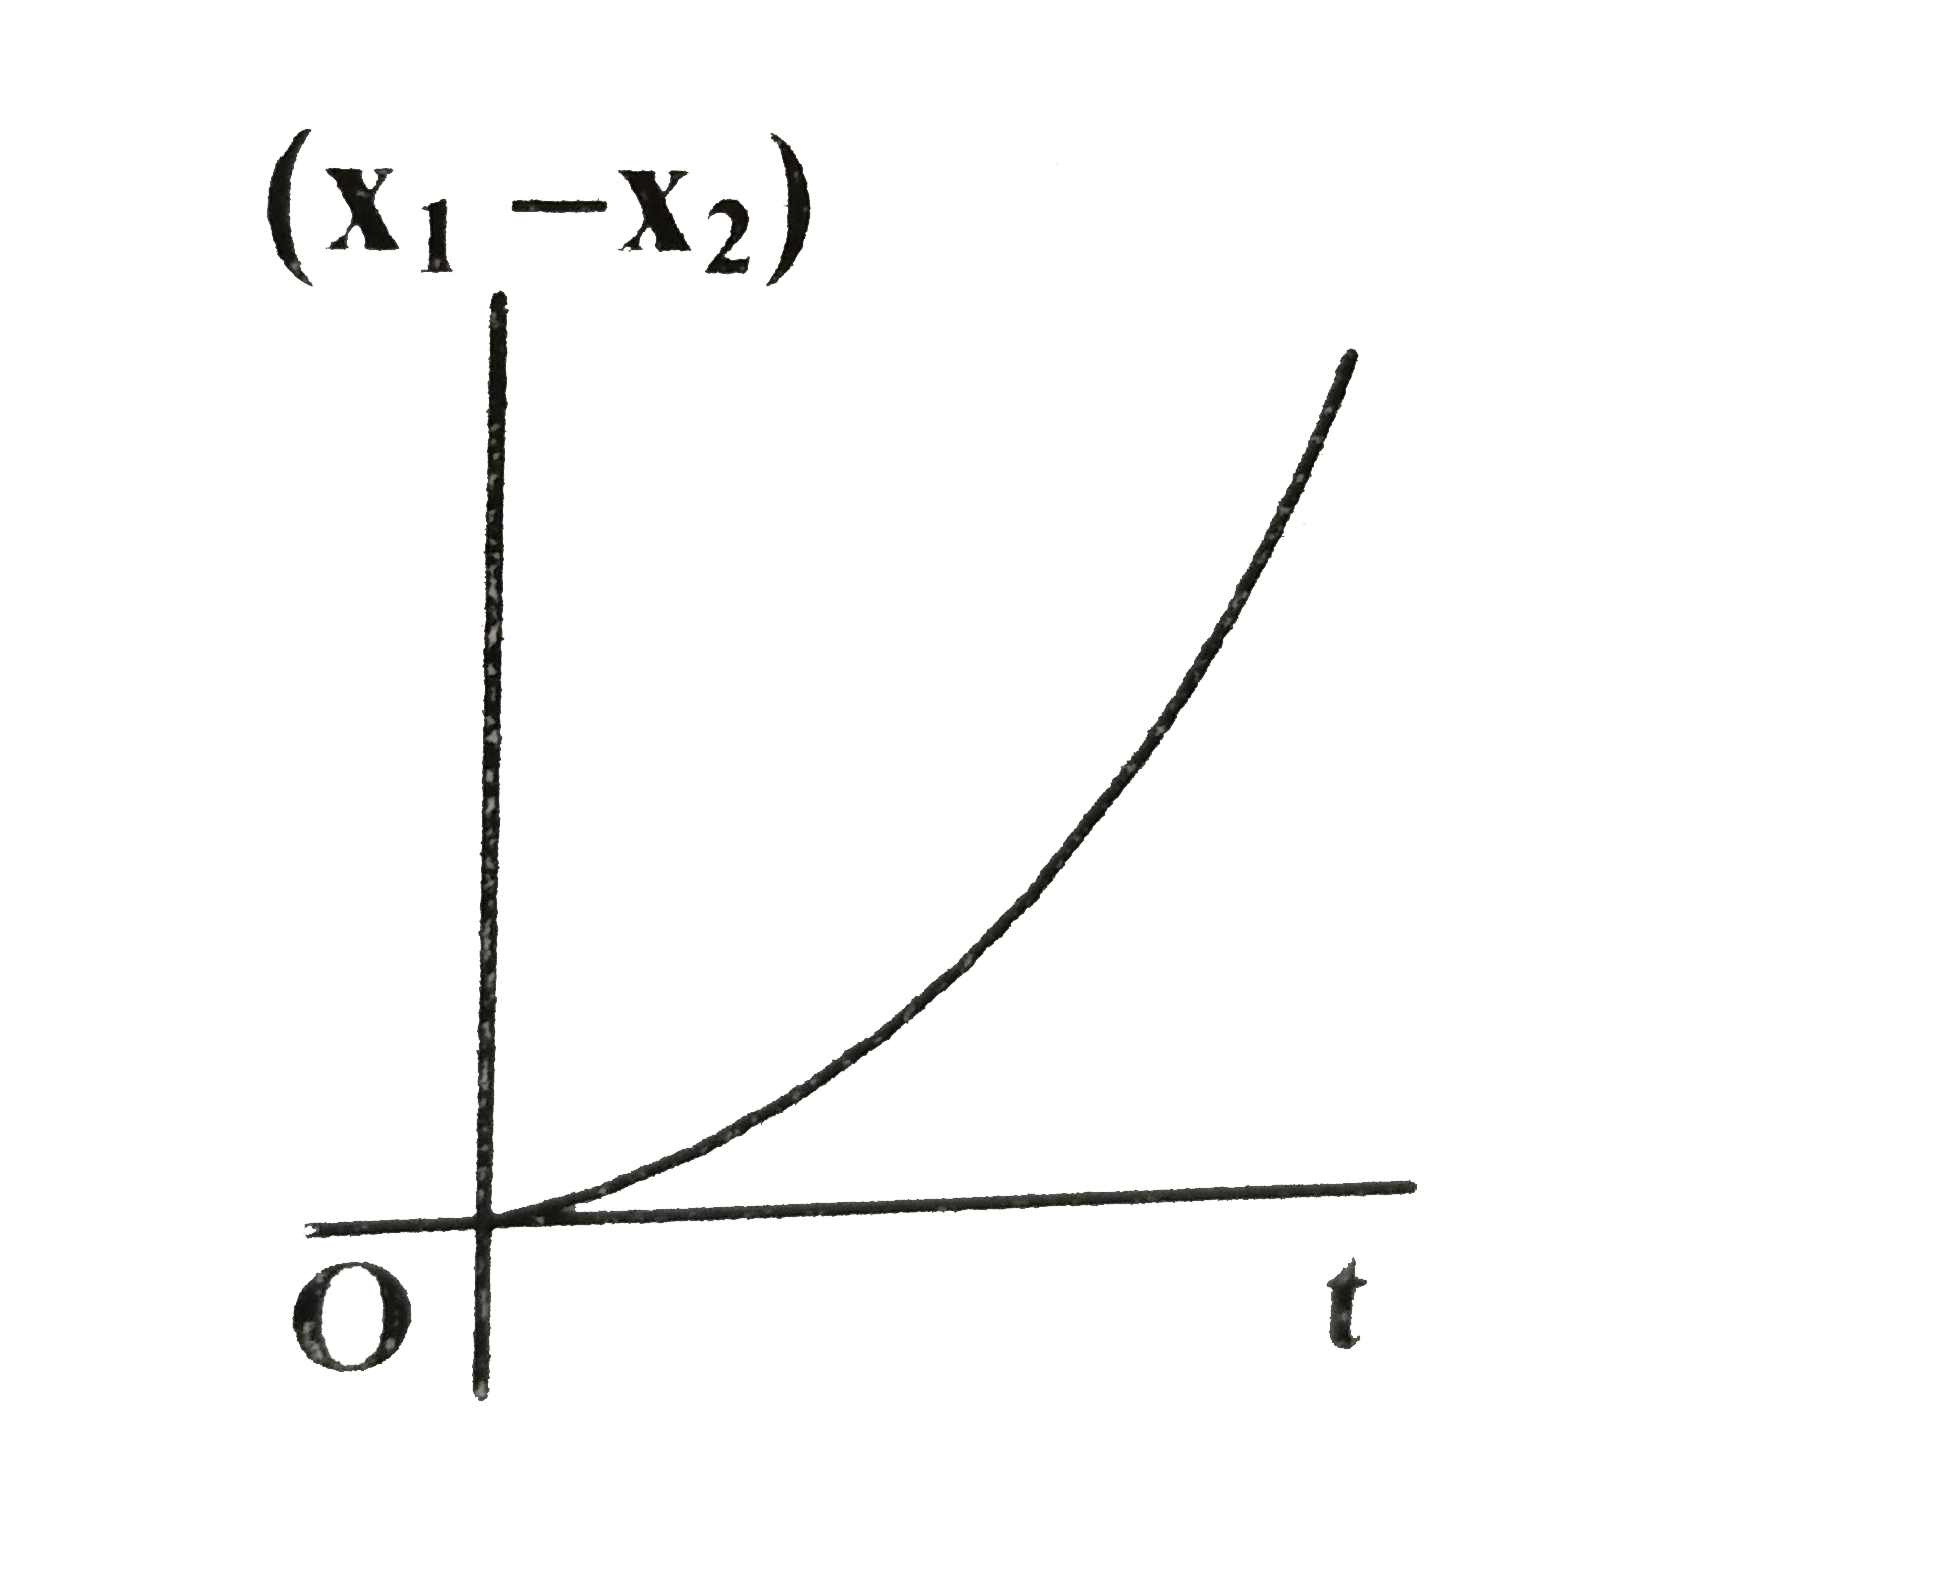
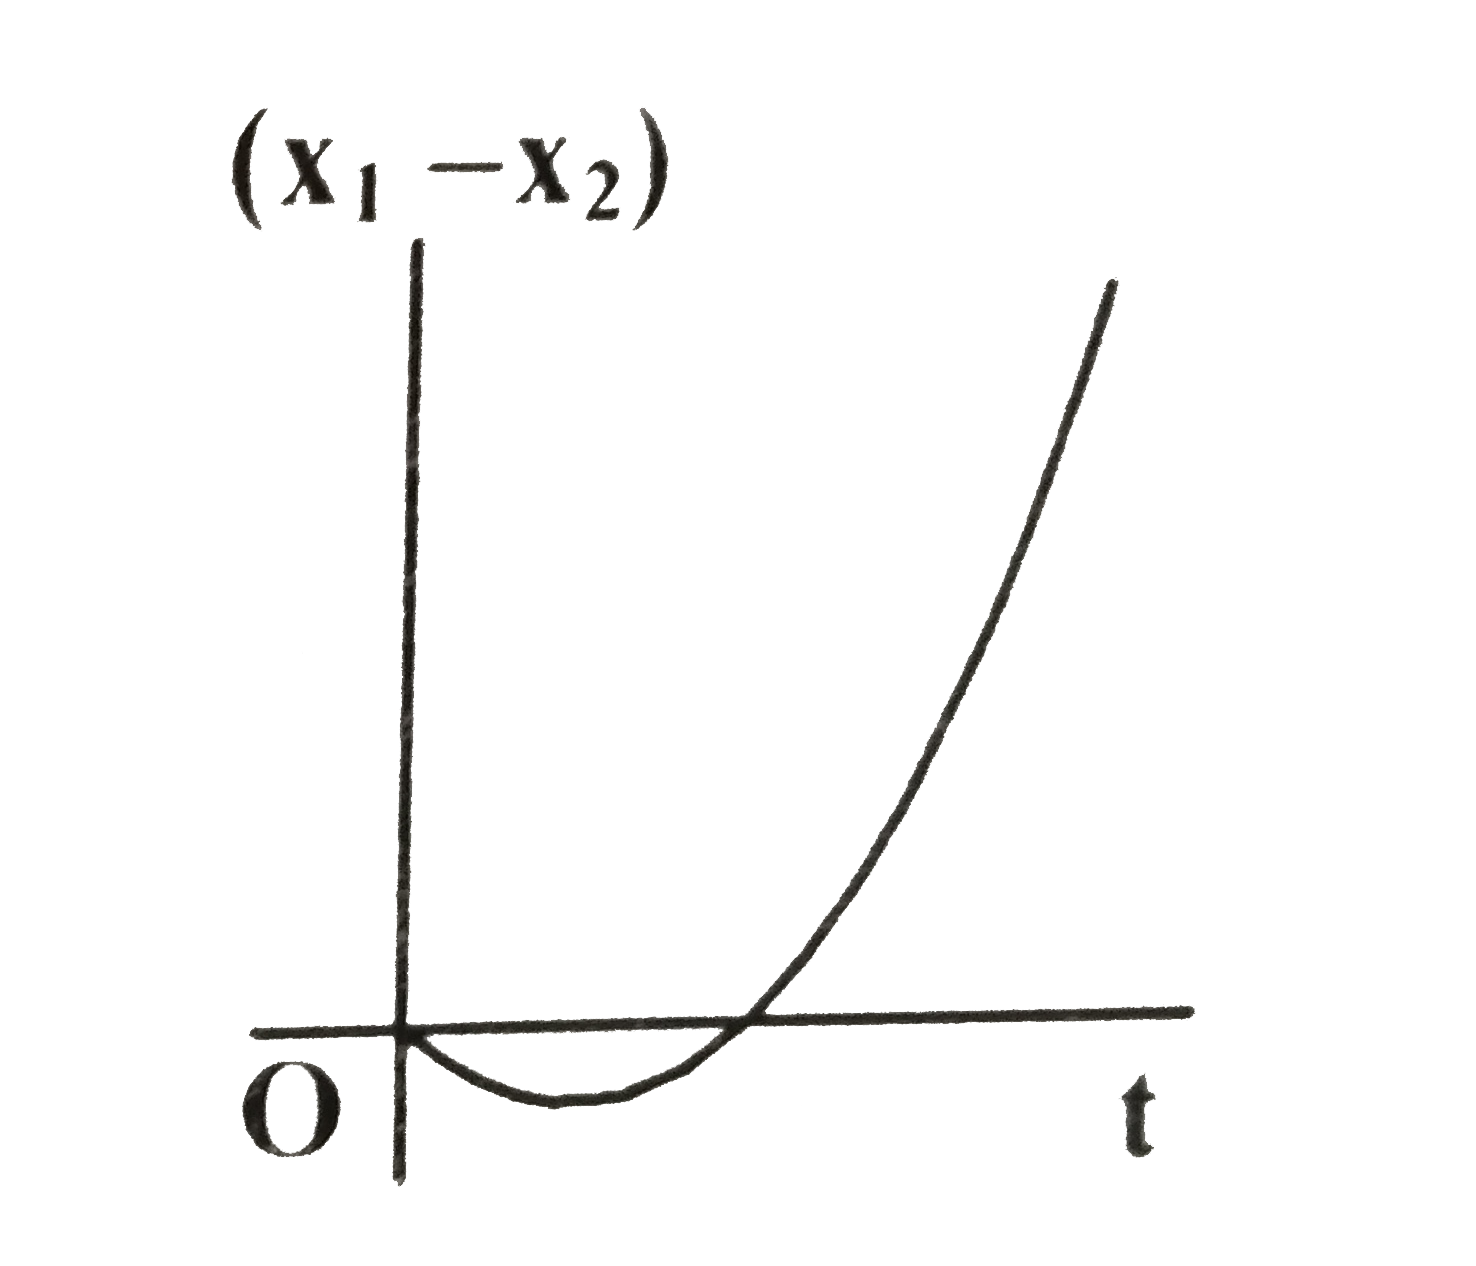
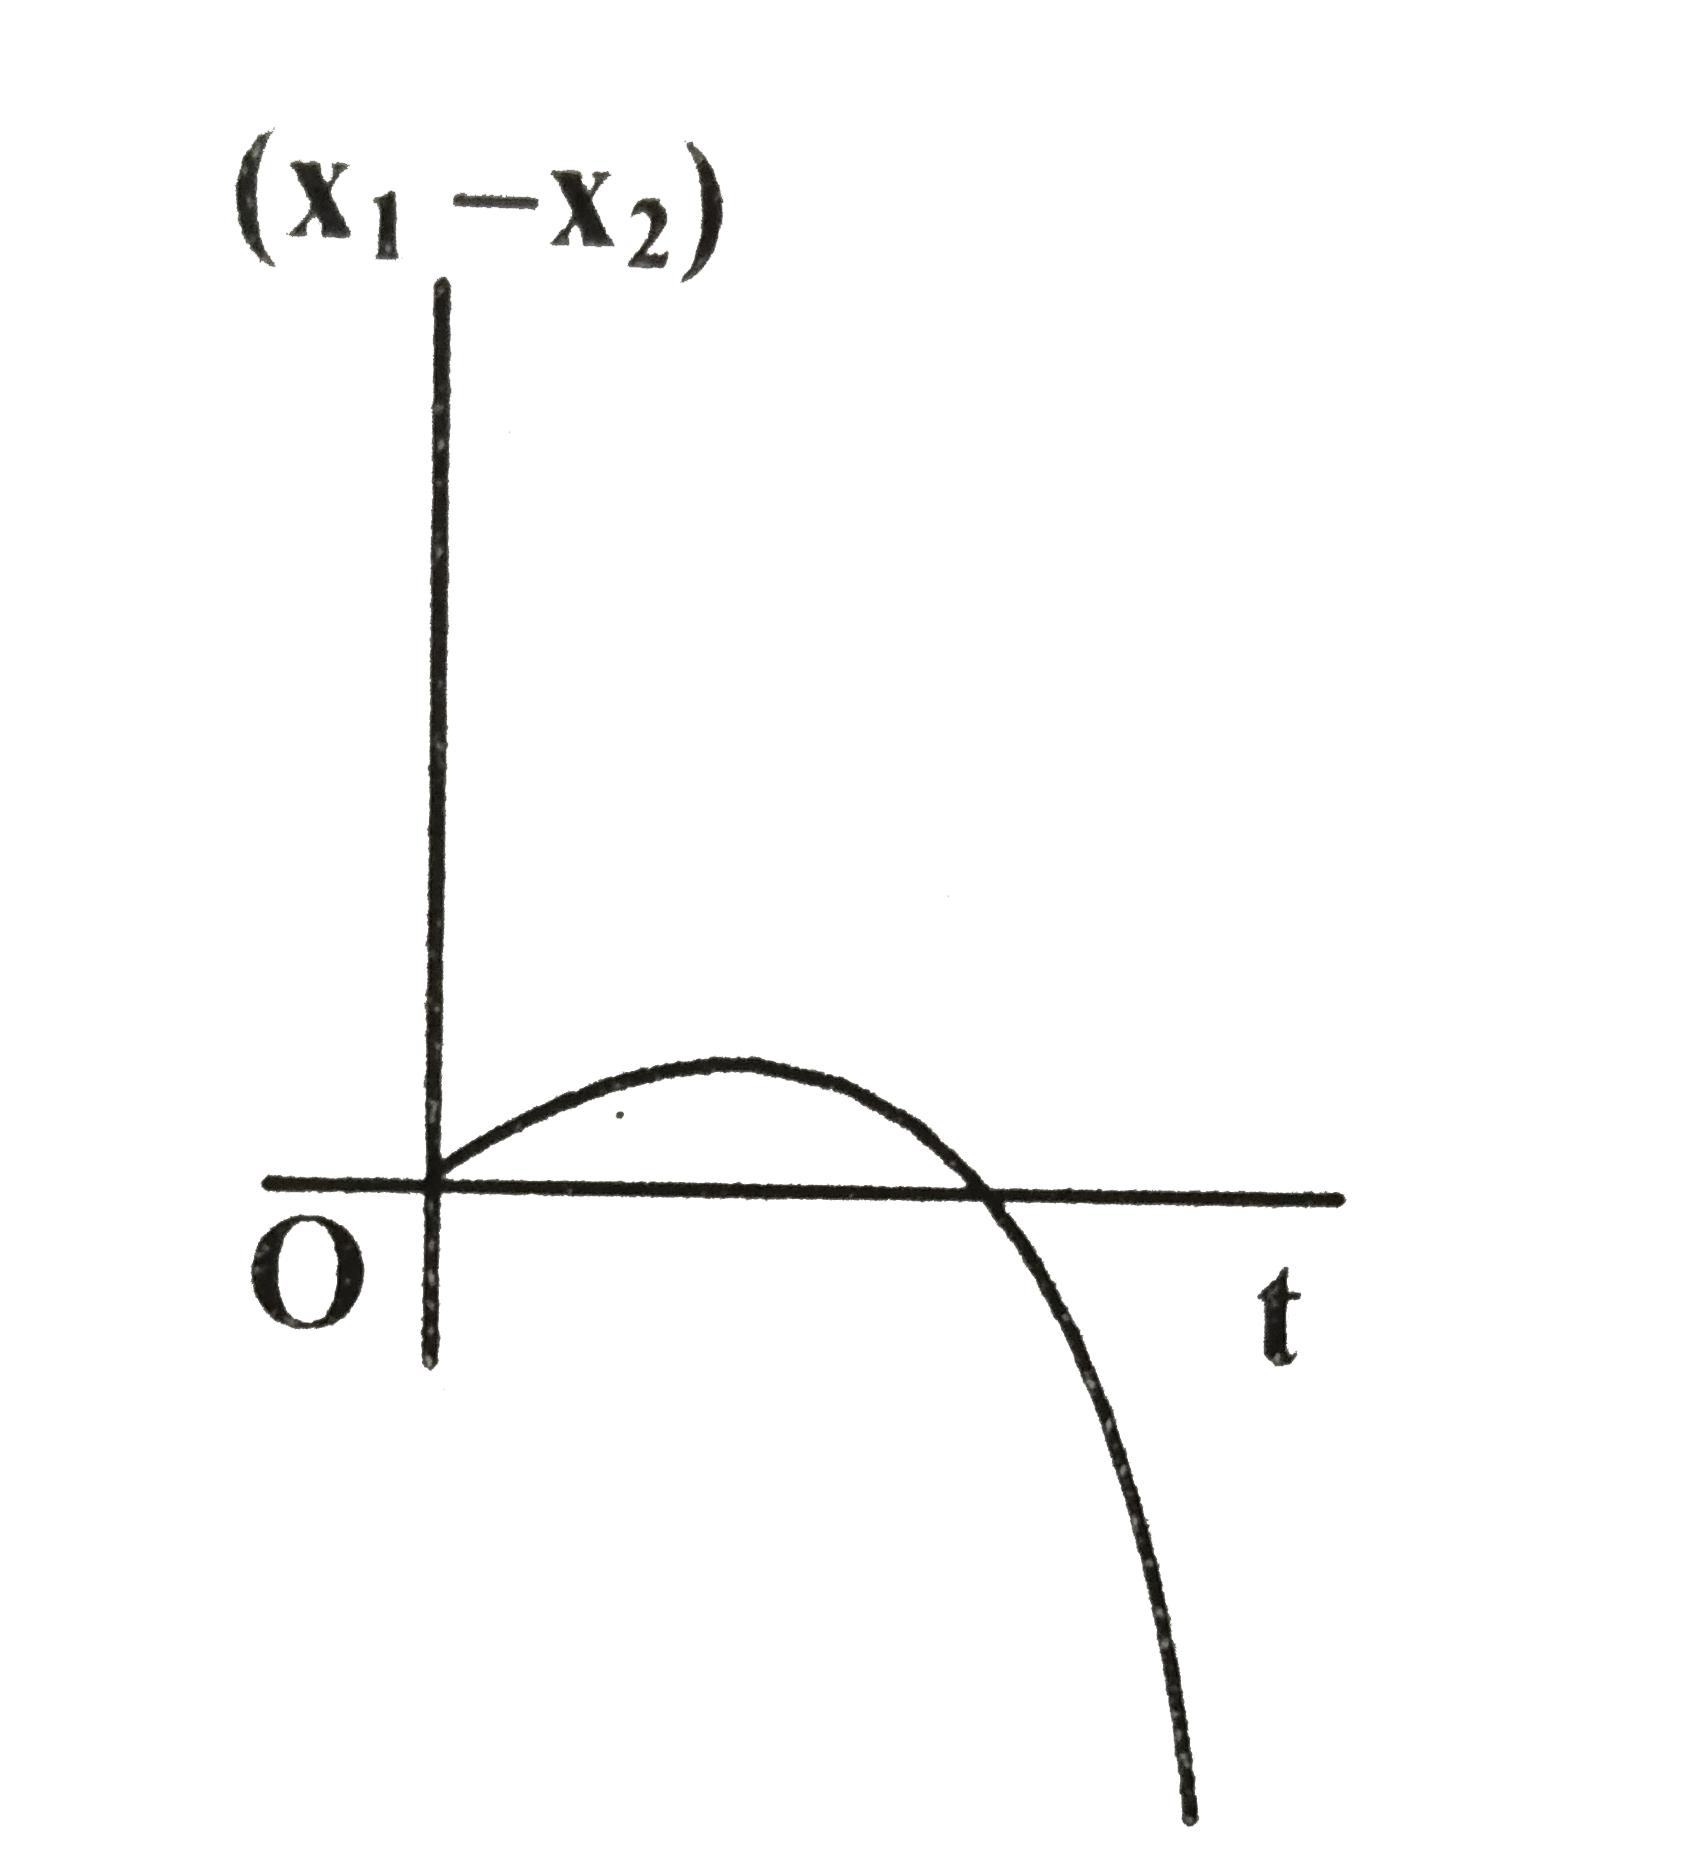
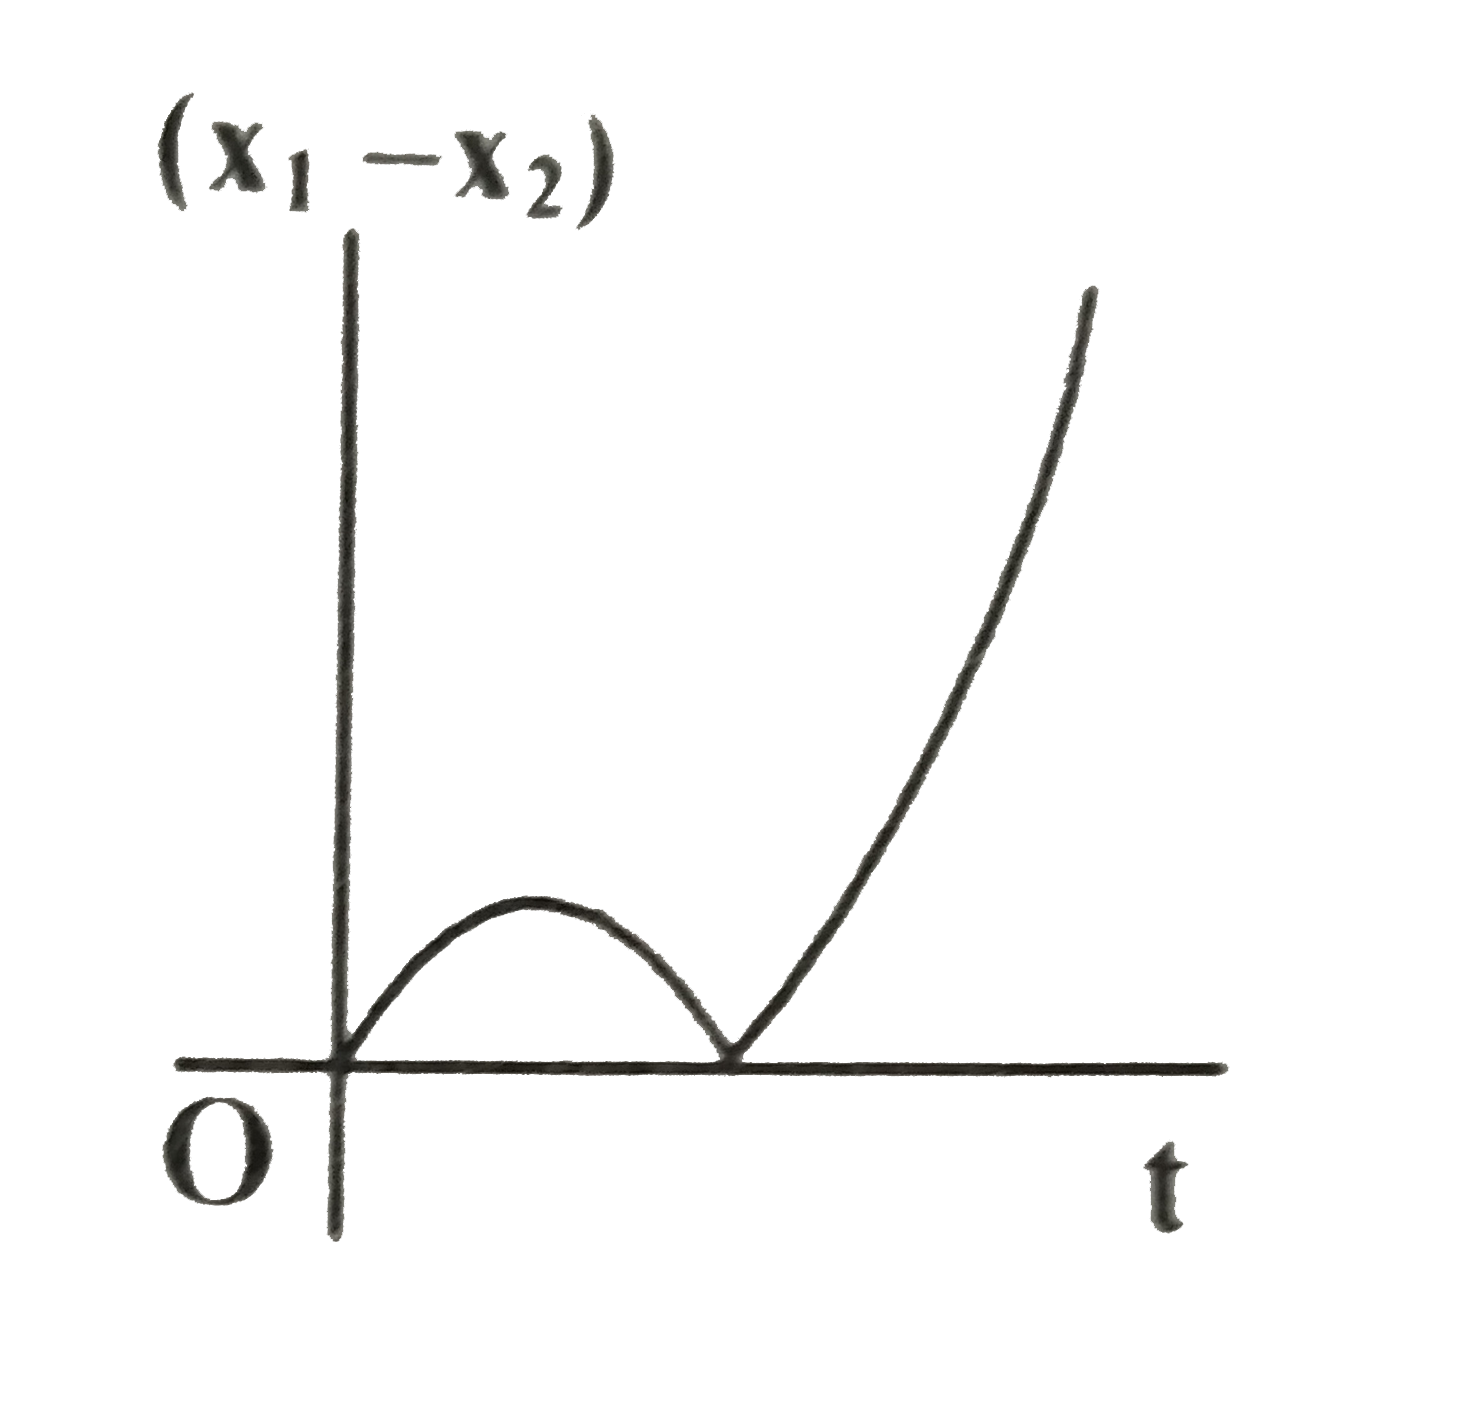
The correct Answer is:B
Step by step video & image solution for A body is at rest at x =0 . At t = 0, it starts moving in the positive x - direction with a constant acceleration . At the same instant another body passes through x= 0 moving in the positive x - direction with a constant speed . The position of the first body is given by x_(1)(t) after time 't', and that of the second body by x_(2)(t) after the same time interval . which of the following graphs correctly describes (x_(1) - x_(2)) as a function of time 't' ? by Physics experts to help you in doubts & scoring excellent marks in Class 12 exams.
Related Playlists
Similar Questions
A particle located at x = 0 at time t = 0, starts moving along the positive x-direction with a velocity that varies as v=p√x. The displacement of the particle varies with time as (where, p is constant)
View SolutionA particle located at x=0 at time t=0, starts moving along with the positive x−direction with a velocity 'v' that varies as v=a√x. The displacement of the particle varies with time as
View SolutionA particle located at x=0 at time t=0, starts moving along with the positive x-direction with a velocity v that varies as v=α√x. The displacement of the particle varies with time as
View SolutionA particle located at position x=0, at time t=0, starts moving along the positive x-direction with a velocity v2=αx (where alpha is a positive constant). The displacement of particle is proportional to
View SolutionA wave propagates in a string in the positive x-direction with velocity v. The shape of the string at t=t0 is given by
f(x,t0)=Asin(x2a2). Then the wave equation at any instant t is given byView SolutionA particle starts moving from position of rest under a constant acceleration. If it travels a distance x in t second, what distance will it travel in next t second?
View SolutionA particle of mass m moving with speed v in position x - direction collides perfectly inelastically with another identical particle moving with same speed in positive y - direction . Find final velocity of the combination.
View SolutionA body lying initially at point (3,7) starts moving with a constant acceleration of 4ˆi. Its position after 3s is given by the coordinates
View SolutionA body of mass m moving with a constant velocity v hits another body of the same mass moving with the same velocity v but in the opposite direction and sticks to it. The velocity of the compound body after collision is
View SolutionA solid metal cube of edge length 2 cm is moving in a positive y-direction at a constant speed of 6 m/s. There is a uniform magnetic field of 0.1 T in the positive z-direction. The potential difference between the two faces of the cube perpendicular to the x-axis, is :
View Solution

